. 2024 Dec 5;7(1):1627.
doi: 10.1038/s42003-024-07313-z.

ICU patient-on-a-chip emulating orchestration of mast cells and cerebral organoids in neuroinflammation

Affiliations

ICU patient-on-a-chip emulating orchestration of mast cells and cerebral organoids in neuroinflammation

Pelin Saglam-Metiner et al. Commun Biol. .

Abstract

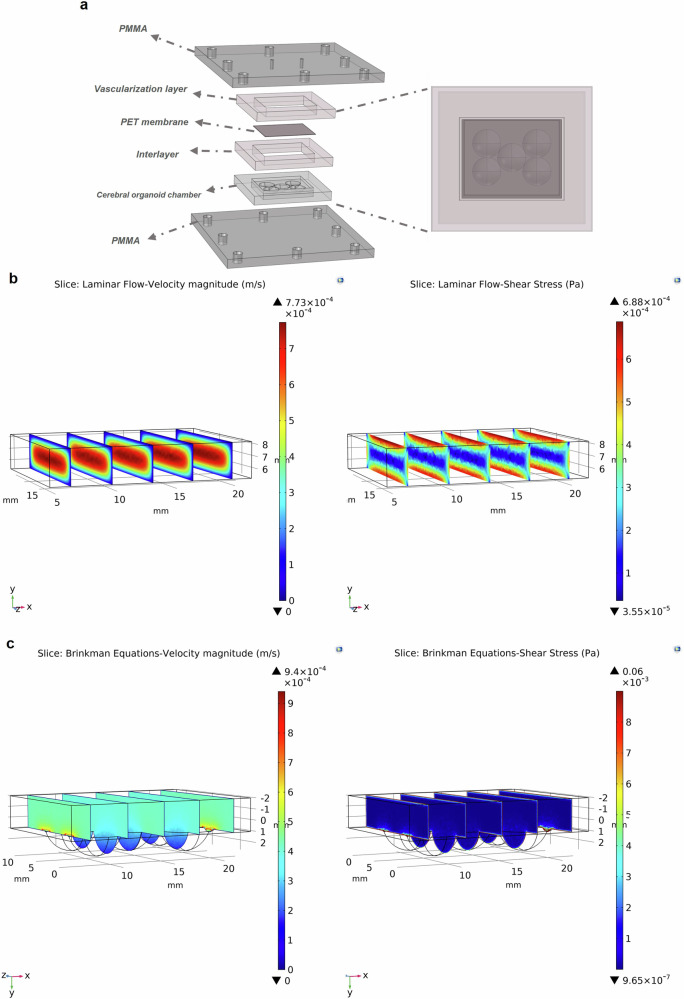
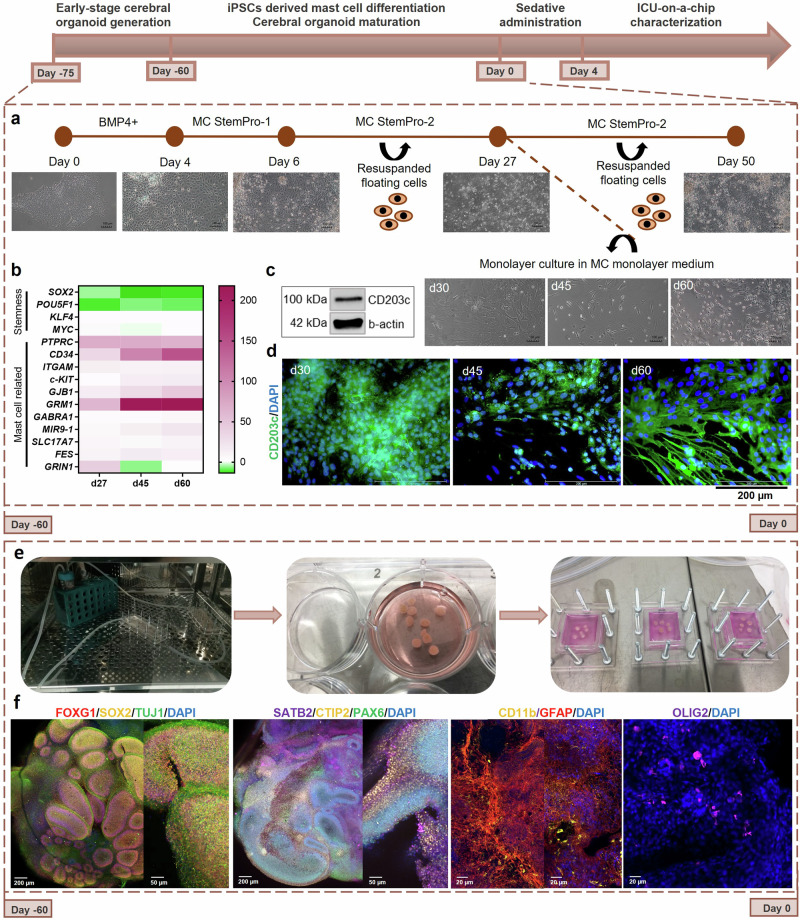
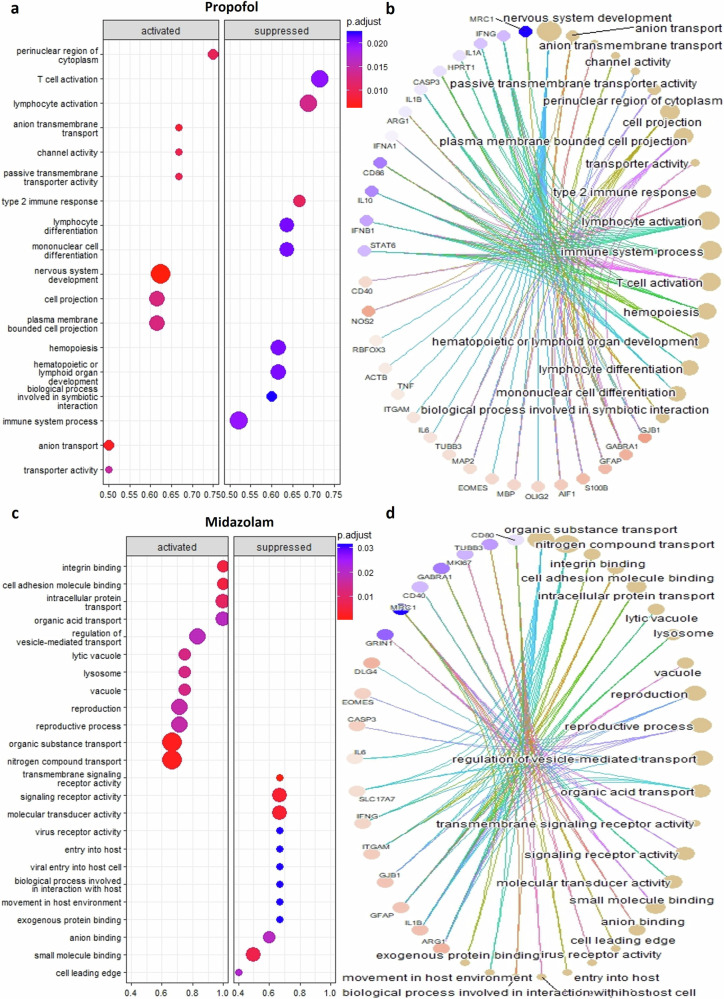
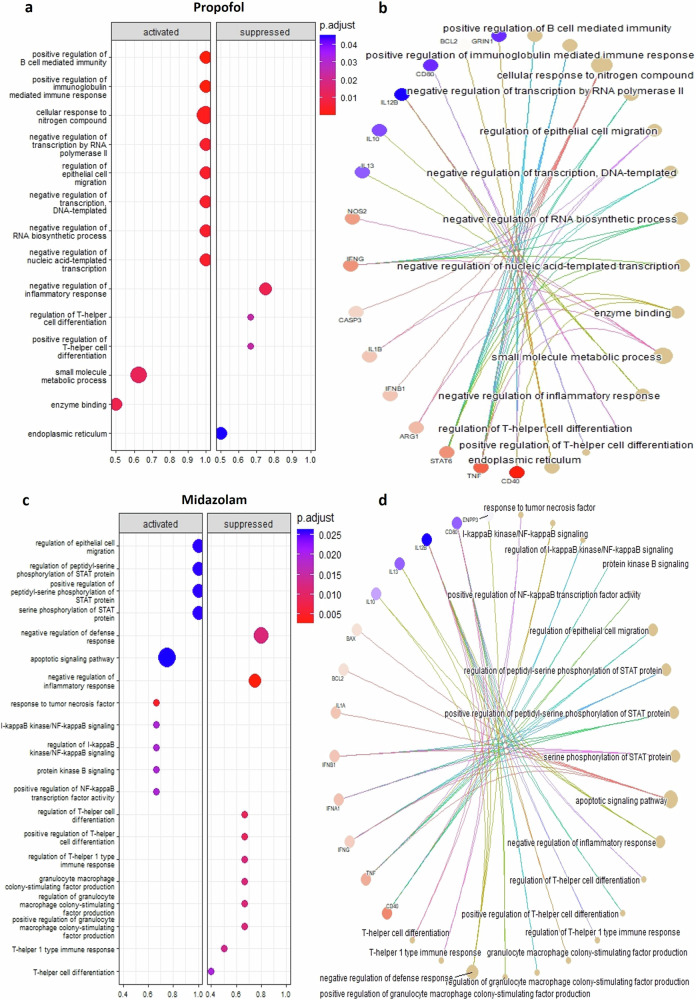
Propofol and midazolam are the current standard of care for prolonged sedation in Intensive Care Units (ICUs). However, the effects and mechanism of these sedatives in brain tissue are unclear. Herein, the development of an ICU patient-on-a-chip platform to elucidate those effects is reported. The humanized neural tissue compartment combines mast cells differentiated from human induced pluripotent stem cells (hiPSCs) with cerebral organoids in a three-dimensional (3D) matrix, which is covered with a membrane populated with human cerebral microvascular endothelial cells (hCMEC/D3) that separates the tissue chamber from the vascular lumen, where sedatives were infused for four days to evaluate neurotoxicity and cell-mediated immune responses. Subsequent to propofol administration, gene expressions of CD40 and TNF-α in mast cells, AIF1 in microglia and GFAP/S100B/OLIG2/MBP in macroglia were elevated, as well as NOS2, CD80, CD40, CD68, IL6 and TNF-α mediated proinflammation is noted in cerebral organoids, which resulted in higher expressions of GJB1, GABA-A and NMDAR1 in the tissue construct of the platform. Besides, midazolam administration stimulated expression of CD40 and CD203c+ reactivated mast cell proliferation and compromised BBB permeability and decreased TEER values with higher barrier disruption, whereas increased populations of CD11b+ microglia, higher expressions of GFAP/DLG4/GJB1 and GABA-A-/NMDAR1- identities, as well as glutamate related neurotoxicity and IL1B, IFNG, IFNA1, IL6 genes mediated proinflammation, resulting in increased apoptotic zones are observed in cerebral organoids. These results suggest that different sedatives cause variations in cell type activation that modulate different pathways related to neuroinflammation and neurotoxicity in the ICU patient-on-chip platform.


Conflict of interest statement

Competing interests: The authors declare no competing interests.

Figures

Fig. 1
Fig. 1. Design and simulation of the ICU patient-on-a-chip.
a Layer-by-layer view of the ICU patient-on-a-chip platform. b numerical simulation of velocity magnitude (m/s) and shear stress (Pa) over BBB at 1 RPM under laminar flow conditions, solved by Navier-stokes equations, and c over brain parenchyma at 1 RPM under 3D biomimetic matrix, solved by Brinkman equations.
Fig. 2
Fig. 2. Mimicry of neural tissue by co-culturing mast cells and cerebral organoids.
a Mast cell differentiation process from iPSCs with brightfield microscopic images (scale bar = 100 μm for ×10 magnification, MOTIC AE31E), b Heatmap generated by qRT-PCR analysis of RNA samples isolated from floating cells on 27 days, and monolayer mast cells on 45 and 60 days compared to control iPSCs (independent repeats = 2) c WB analysis for CD203c protein of mature mast cells on day 60 (independent repeats = 2), d IF staining of mast cells on days 30, 45, and 60 of culture with CD203c in the mast cell differentiation protocol (scale bars = 200 µm for ×40 magnification images, independent repeats = 3, Zeiss Axio Vert.A1). e Newly designed ICU patient-on-a-chip platform with differentiated mast cells, µ-platform matured cerebral organoids on day 60 and hCMEC/D3 populated membrane, for the BBB evaluation and cellular response in neural tissue recapitulating the response of a patient in the ICU to sedatives. f Brief characterization of µ-platform matured cerebral organoids with whole confocal imaging after tissue clearing, highlighted by FOXG1, SOX2, TUJ1, SATB2, CTIP2, PAX6, CD11b, GFAP, OLIG2, and DAPI stainings (scale bars = 200 μm for ×5, 50 μm for ×20 and 20 μm for ×40 magnification images, independent replicates = 3, Zeiss LSM 880).
Fig. 3
Fig. 3. Effects on sedative administration permeability and barrier integrity.
a Schematic illustration of sedative administration on ICU patient-on-a-chip platform. b recapitulating the interaction between BBB, mast cells, and cerebral organoids inflammatory response by cytokine release from neuronal, glial, and mast cells upon sedative administration; both a and b are generated with Servier Medical Art, provided by Servier, licensed under a Creative Commons Attribution 3.0 unported license. c Fluorescein Isothiocyanate (FITC) permeability assay results of BBB construct at the end of 4 days of sedative administration as P (cm/s × 10−6), and d trans-endothelial electrical resistance (TEER) measurement results at the end of 4 days of sedative administration as Ω cm2 (One-way ANOVA Tukey’s multiple comparisons test, ns; p > 0.05, *p < 0.05, **p < 0.01, independent replicates = 3). e IF staining of CD31 and ZO-1 markers (scale bars = 20 μm for ×40 magnification images, independent replicates = 3, Leica Microsystems, Stellaris 5) for BBB construct at the end of 4 days of sedative administration in the ICU patient-on-a-chip.
Fig. 4
Fig. 4. Neuroinflammatory and neurotoxic effects of sedative administration on neural tissue.
a IF staining of specific mast cell marker CD203c (scale bars = 20 μm for ×20 magnification images, independent replicates = 3). b Heatmap generated by fold regulation data obtained as a result of qRT-PCR analysis of RNA samples isolated from mast cells (independent repeats = 2). c TNF-α concentrations (pg/mL) and d extracellular glutamate concentrations (µM) in the supernatant, and e WST-1 analysis of organoids (one-way ANOVA Tukey’s multiple comparisons test, ns; p > 0.05, *p < 0.05, **p < 0.01, ***p < 0.001, independent replicates = 2). f Heatmap generated by fold regulation data obtained as a result of qRT-PCR analysis of RNA samples isolated from organoids (independent repeats = 2). g 3D confocal microscopy images of VGLUT1/MAP2 stained vDISCO tissue cleared cerebral organoids harvested from ICU patient-on-a-chip platform at the end of 4 days of sedative administration (scale bar = 500 μm independent replicates = 3, Zeiss LSM 880).
Fig. 5
Fig. 5. Further characterization of neural tissue from ICU patient-on-a-chip platform by IF and TUNEL after sedative administration.
a 3D confocal microscopy images of Ki-67, NMDAR1, GABA-A, and CD11b stained vDISCO tissue cleared cerebral organoids harvested from ICU patient-on-a-chip platform at the end of 4 days of sedative administration (scale bars = 50 μm for ×20 and 20 μm for ×40 magnification images, independent replicates=3, Leica Microsystems, Stellaris 5). b Quantification of the mean fluorescence intensity signal of NMDAR1 and GABA-A stainings and Ki-67 + & CD11b+ cell % versus DAPI+ cell countings (One-way ANOVA Tukey’s multiple comparisons test, *p < 0.05, **p < 0.01, ***p < 0.001, ****p < 0.0001 independent replicates = 3–5). c TUNEL apoptosis fluorescent staining images of paraffin sectioned cerebral organoids harvested from ICU patient-on-a-chip platform at the end of 4 days of sedative administration. The DAPI-stained cell nucleus (blue), green fluorescent-stained apoptotic zones in the cell nucleus (green) (scale bar = 200 μm, independent replicates = 3, Zeiss Axio Vert.A1). d Percentage of apoptotic zone graph prepared from TUNEL images (independent replicates = 3, one-way ANOVA Tukey’s multiple comparisons test, ns; p > 0.05, **p < 0.01, ****p < 0.0001).
Fig. 6
Fig. 6. GO analysis of the target genes from qRT-PCR analyses of organoids.
a Enriched all GO terms for upregulated (activated) and downregulated (suppressed) genes associated with propofol-administered organoids. b Genes related to enriched GO terms for propofol administered organoids c Enriched all GO terms for upregulated (activated) and downregulated (suppressed) genes associated with midazolam administered organoids d Genes related to enriched GO terms for midazolam administered organoids. (Red nodes indicate upregulated, blue nodes indicate downregulated genes in (b) and (d)).
Fig. 7
Fig. 7. GO analysis of target genes from qRT-PCR analyses of mast cells.
a Enriched all GO terms for upregulated (activated) and downregulated (suppressed) genes associated with propofol-administered mast cells. b Genes related to enriched GO terms for propofol-administered mast cells. c Enriched all GO terms for upregulated (activated) and downregulated (suppressed) genes associated with midazolam-administered mast cells. d Genes related to enriched GO terms for midazolam-administered mast cells (Red nodes indicate upregulated, blue nodes indicate down-regulated genes in (b) and (d)).

References

    1. Diaz-Castro, B., Bernstein, A. M., Coppola, G., Sofroniew, M. V. & Khakh, B. S. Molecular and functional properties of cortical astrocytes during peripherally induced neuroinflammation. Cell Rep.36, 109508 (2021). - PMC - PubMed
    1. Saglam-Metiner, P., Duran, E., Sabour-Takanlou, L., Biray-Avci, C. & Yesil-Celiktas, O. Differentiation of neurons, astrocytes, oligodendrocytes and microglia from human induced pluripotent stem cells to form neural tissue-on-chip: a neuroinflammation model to evaluate the therapeutic potential of extracellular vesicles derived from mesenchymal stem cells. Stem Cell Rev. Rep.20, 413–436 (2024). - PubMed
    1. Hendriksen, E., van Bergeijk, D., Oosting, R. S. & Redegeld, F. A. Mast cells in neuroinflammation and brain disorders. Neurosci. Biobehav. Rev.79, 119–133 (2017). - PubMed
    1. Cecen, B. et al. Biosensor integrated brain-on-a-chip platforms: progress and prospects in clinical translation. Biosens. Bioelectron.225, 115100 (2023). - PubMed
    1. Kempuraj, D. et al. Brain and peripheral atypical inflammatory mediators potentiate neuroinflammation and neurodegeneration. Front. Cell Neurosci.11, 216 (2017). - PMC - PubMed

MeSH terms

LinkOut - more resources