. 2025 Mar;44(9):563-574.
doi: 10.1038/s41388-024-03231-w. Epub 2024 Dec 6.

Metabolic imaging distinguishes ovarian cancer subtypes and detects their early and variable responses to treatment

Affiliations

Metabolic imaging distinguishes ovarian cancer subtypes and detects their early and variable responses to treatment

Ming Li Chia et al. Oncogene. 2025 Mar.

Abstract

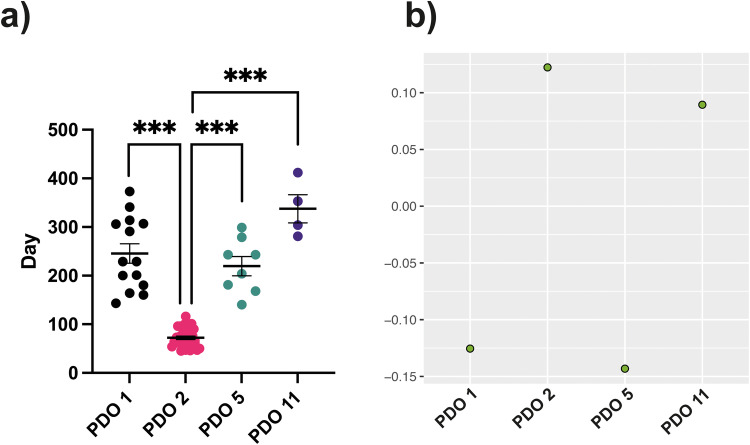
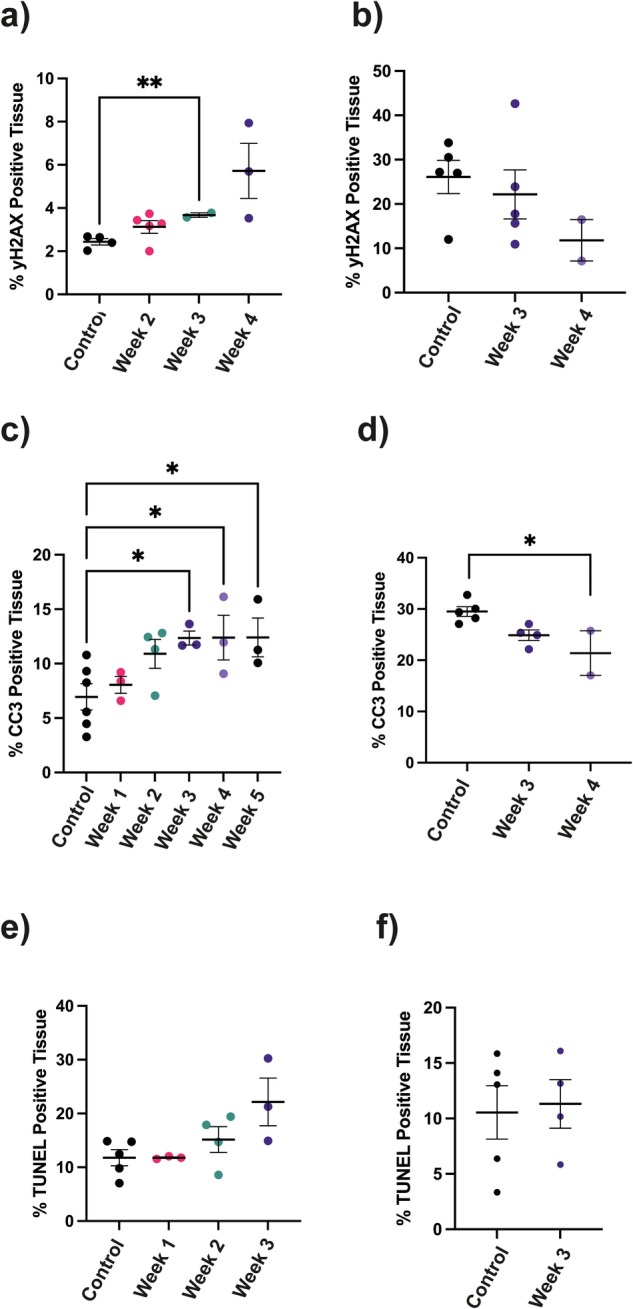
High grade serous ovarian cancer displays two metabolic subtypes; a high OXPHOS subtype that shows increased expression of genes encoding electron transport chain components, increased oxygen consumption, and increased chemosensitivity, and a low OXPHOS subtype that exhibits glycolytic metabolism and is more drug resistant. We show here in patient-derived organoids and in the xenografts obtained by their subcutaneous implantation that the low OXPHOS subtype shows higher lactate dehydrogenase activity and monocarboxylate transporter 4 expression than the high OXPHOS subtype and increased lactate labeling in 13C magnetic resonance spectroscopy (MRS) measurements of hyperpolarized [1-13C]pyruvate metabolism. There was no difference between the subtypes in PET measurements of 2-deoxy-2-[fluorine-18]fluoro-D-glucose ([18F]FDG) uptake. Both metabolic imaging techniques could detect the early response to Carboplatin treatment in drug-sensitive high OXPHOS xenografts and no response in drug-resistant in low OXPHOS xenografts. 13C magnetic resonance spectroscopic imaging of hyperpolarized [1-13C]pyruvate metabolism has the potential to be used clinically to distinguish low OXPHOS and high OXPHOS tumor deposits in HGSOC patients and to detect their differential responses to treatment.


Conflict of interest statement

Competing interests: The authors declare no competing interests. Ethics approval and consent to participate: All methods were performed in accordance with the relevant guidelines and regulations. Organoids were derived from tumor samples collected on the prospective cohort study Cambridge Translational Cancer Research Ovarian Study 04 (CTCR-OV04), with IRAS project ID 4853, and which was approved by the Institutional Ethics Committee (REC reference number 08 /H0306/61). Patients provided written, informed consent for participation and for the use of their donated tissue for laboratory studies.

Figures

Fig. 1
Fig. 1. Tumor growth rates and electron transport chain gene set variation analysis.
a Growth rates of tumors obtained following subcutaneous implantation of PDOs 1, 2, 5, and 11. Time taken for tumors to reach 300 mm3. P ≤ 0.001***. P values were determined using Fisher’s ANOVA. Tukey’s test was used as a post hoc test. b Gene Set Variation Analysis (GSVA) of the expression of electron transport chain (ETC) genes.
Fig. 2
Fig. 2. Characterization of tumor metabolism.
a Tumor lactate labeling following injection of hyperpolarized [1-13C]pyruvate. Ratios of the areas under the lactate and pyruvate labeling curves (AUC). P < 0.01** (b) Lactate dehydrogenase (LDH) activity measured in tumor extracts. P = 0.034*, P < 0.001***. c Expression of lactate dehydrogenase A (LDHA), relative to β-actin, determined by western blot of tumor extracts. P = 0.028*. d Quantitative analysis of MCT 4 membrane expression in tumor sections. e Quantitative analysis of GLUT 1 membrane expression in tumor sections. P = 0.003**, P < 0.001***. f Mean fluorescence intensity of organoids 1 h after incubation with 40 μM 2-NBDG in glucose-free media. Organoids were plated at 150,000/well the day before incubation with 2-NBDG. g PET measurements of [18F]FDG uptake. Tumor SUVmax at 90 min following i.v. injection of [18F]FDG. P < 0.05*, P = 0.002**. h Expression of hexokinase II (HKll) relative to β-actin in tumor extracts. P ≤ 0.05*. For (af) P values were determined Fisher’s ANOVA. Tukey’s test was used as a post hoc test. For (g) P values were determined using Welch’s ANOVA. Dunnetts T3 test was used as a post hoc test.
Fig. 3
Fig. 3. c-Myc shows increased expression in PDO1 and EGFR in PDO5.
a Normalized counts for c-Myc expression from RNA sequencing data [15]. b Densitometric determination of the concentrations of c-Myc relative to β-actin on western blots of tumor extracts. Each biological replicate includes 1–4 technical replicates. P = 0.015*, P = 0.003**. c Normalized counts for EGFR expression from RNA sequencing data [15]. d Quantitative analysis of EGFR staining in tumor sections. Percentage of positive stain. P = 0.001***. e Quantitative analysis of phosphorylated ERK (pERK) staining on tumor sections. Percentage of positive stain. P ≤ 0.01**. For (b) P values were determined using Welch’s ANOVA and Dunnett’s T3 test was used as a post hoc test. For (d, e) P values were determined using Fisher’s ANOVA. Tukey’s test was used as a post hoc test.
Fig. 4
Fig. 4. Treatment of organoids with a Myc inhibitor (Myci975).
a Effect on cell viability. Organoids were plated at 10,000 cells/well and treated for 120 h with 2 nM–200 nM Myci975 and cell viability assessed using the AlarmarBlue assay. Viabilities relative to controls in paired wells are shown. Each biological replicate included 2–4 technical replicates. P = 0.022*, P < 0.001***. b LDH activity following 3 days of treatment with 200 nM Myci975 or matched DMSO control. Each biological replicate included 2–3 technical replicates. Treatment of organoids with an EGFR inhibitor (Erlotinib). c Effect of Erlotinib on cell viability. Organoids were plated at 10,000 cells/well and treated for 120 h with 2–200 nM Erlotinib and cell viability assessed using AlarmarBlue. Viability ratios relative to controls in paired wells of the same experiment. Each biological replicate included 2–4 technical replicates. P = 0.01**, P < 0.001***. For measurements of phosphorylated EGFR (pEGFR), HKII expression and LDH activity organoids were plated at 150,000 cells/well the day before the experiment. Posttreatment measurements were made 3 days after treatment with 200 nM Erlotinib. Each biological replicate included 2–3 technical replicates. d P-EGFR expression relative to β-actin. P = 0.006**. e HKll expression relative to β-actin. P < 0.001***. f LDH activity. P = 0.032*, P < 0.001***. A linear mixed-effects model was used. Adjusted p-values of simultaneous z-tests using General Linear Hypotheses are reported.
Fig. 5
Fig. 5. Effect of Erlotinib treatment on tumor lactate labeling and [18F]FDG uptake.
Effect of Erlotinib treatment on tumor lactate labeling and [18F]FDG uptake. Effect of Erlotinib treatment on tumor lactate labeling from hyperpolarized [1-13C]pyruvate in (a) PDO2 and (b) PDO5 tumors. Mice were treated by oral gavage daily for 7 days after baseline imaging on day 0. Control group: 6% Captisol in water, 10 ml/kg/day. Treatment group: Erlotinib 50 mg/kg/day in 6% Captisol. The ratio of the areas under the lactate and pyruvate labeling curves (AUC) were recorded in the same mouse at baseline and after 7 days of treatment and the difference between the 7 day time point and baseline were calculated for Erlotinib-treated and control mice. P = 0.008**. Change in tumor volumes (mm3) between baseline and after 7 days of treatment in individual treated and control mice with (c) PDO2 and (d) PDO5 tumors, corresponding to the mice shown in (a) and (b) respectively. Effect of Erlotinib treatment on [18F]FDG uptake in (e) PDO 2 and (f) PDO 5 tumors. The change in tumor SUVmax between baseline and after 7 days of treatment are shown in individual treated and control mice. P = 0.004**. Change in tumor volumes (mm3) between baseline and after 7 days of treatment in individual treated and control mice with (g) PDO 2 and (h) PDO 5 tumors, corresponding to the mice shown in (e, f) respectively. P values were determined using paired Student’s t tests.
Fig. 6
Fig. 6. Immunohistochemical analysis of DNA damage and cell death in tumor sections.
Mice were treated with 50 mg CBT/kg/week dissolved in mannitol/water for injection (10 mg/ml). Controls were treated with mannitol alone. Times shown are the number of weeks after the start of treatment. a γH2AX staining in PDO 2 tumor sections. P = 0.006**. b γH2AX staining in PDO 5 tumor sections. c CC3 staining in PDO 2 tumor sections. P < 0.05*. d CC3 staining in PDO 5 tumor sections. P = 0.02*. e TUNEL staining in PDO 2 tumor sections. f TUNEL staining in PDO 5 tumor sections. For (a, e) P values were determined using Tamhane-Dunnett Many-to-One Comparison Test. For (bd, f) P values were determined using Dunnett’s many-to-one comparison test on a natural scale.
Fig. 7
Fig. 7. Imaging response to standard-of-care treatment in drug-sensitive and drug-resistant tumors.
Imaging response to CBT treatment using hyperpolarized [1-13C]pyruvate in (a) CBT-sensitive PDO 2 tumors (P < 0.001***) and (b) CBT-resistant PDO 5 tumors. The ratio of the areas under the lactate and pyruvate labeling curves (AUC) were recorded in the same mouse at baseline and at the indicated times after the start of treatment and the difference calculated for CBT-treated and control mice. c Change in PDO 2 tumor volumes (mm3) from baseline in individual treated and control mice, corresponding to the mice shown in (a). d Change in PDO 5 tumor volumes (mm3) from baseline in individual treated and control mice, corresponding to the mice shown in (b). Imaging response to CBT treatment using [18F]FDG-PET in (e) CBT-sensitive PDO2 tumors (P = 0.015*, P = 0.006**, P < 0.001***) and (f) CBT-resistant PDO 5 tumors. Change in SUVmax from baseline in individual treated and control mice and at the indicated times after the start of treatment. g Change in PDO 2 tumor volumes (mm3) from baseline in individual treated and control mice, corresponding to the mice shown in (e). h Change in PDO 5 tumor volumes (mm3) from baseline in individual treated and control mice, corresponding to the mice shown in (f). For (a, c, eh) P values were determined using likelihood ratio tests for maximum likelihood fits for mixed-effects models. Simultaneous Z-tests for General Linear Hypotheses were used as post hoc tests. For (b, d) P values were determined using Student’s t test.
Fig. 8
Fig. 8. Metabolic changes in PDO 2 and PDO 5 tumors following Carboplatin treatment.
Liquid Chromatography - Mass Spectrometry measurements of NAD+ and NADH in tumor extracts before and at the indicated times after the start of treatment. Changes in peak areas show the relative changes in NAD+ and NADH concentrations. Peak areas in extracts of PDO 2 tumors, (a) NAD+ (P = 0.037*) and (b) NADH (P = 0.049*) and in PDO 5 tumors, (c) NAD+ and (d) NADH. LDH activity (units/mg tumor protein) in (e) PDO 2 (P = 0.024*) and (f) PDO 5 tumor extracts before and at the indicated times after the start of treatment. g RT-qPCR measurements of GLUT 1 expression in fine needle aspirates from PDO 2 tumors in treated and control mice. Paired values were recorded in the same mouse at baseline and at the indicated times following treatment. The fold change from the baseline value was calculated using the 2(-Delta Delta C(T)) method [1]. h Fluorescence measurements of NBDG uptake in organoids at 3 days post treatment with 50 μM Carboplatin. Mean NBDG fluorescence from paired control and treatment organoids were recorded and the data expressed relative to the paired control. P = 0.003**. Fisher’s t-test was used for (a, cf). Welch’s t-test was used for (b). P = 0.049*. One-sample t- test was used for (h).

References

    1. Jelovac D, Armstrong DK. Recent progress in the diagnosis and treatment of ovarian cancer. CA Cancer J Clin. 2011;61:183–203. - PMC - PubMed
    1. Ferlay J, Colombet M, Soerjomataram I, Dyba T, Randi G, Bettio M, et al. Cancer incidence and mortality patterns in Europe: estimates for 40 countries and 25 major cancers in 2018. Eur J Cancer. 2018;103:356–87. - PubMed
    1. Garofano L, Migliozzi S, Oh YT, D’Angelo F, Najac RD, Ko A, et al. Pathway-based classification of glioblastoma uncovers a mitochondrial subtype with therapeutic vulnerabilities. Nat Cancer. 2021;2:141–56. - PMC - PubMed
    1. Daemen A, Peterson D, Sahu N, McCord R, Du X, Liu B, et al. Metabolite profiling stratifies pancreatic ductal adenocarcinomas into subtypes with distinct sensitivities to metabolic inhibitors. Proc Natl Acad Sci USA. 2015;112:E4410–7. - PMC - PubMed
    1. Caro P, Kishan AU, Norberg E, Stanley IA, Chapuy B, Ficarro SB, et al. Metabolic signatures uncover distinct targets in molecular subsets of diffuse large B cell lymphoma. Cancer Cell. 2012;22:547–60. - PMC - PubMed

LinkOut - more resources