

Detecting departures from the conditional independence assumption in diagnostic latent class models: a simulation study
- PMID: 39639189
- PMCID: PMC11619692
- DOI: 10.1186/s12874-024-02432-x
Detecting departures from the conditional independence assumption in diagnostic latent class models: a simulation study
Abstract
Background: Latent class models can be used to estimate diagnostic accuracy without a gold standard test. Early studies often assumed independence between tests given the true disease state, however this can lead to biased estimates when there are inter-test dependencies. Residual correlation plots and chi-squared statistics have been commonly utilized to assess the validity of the conditional independence assumption and, when it does not hold, identify which test pairs are conditionally dependent. We aimed to assess the performance of these tools with a simulation study covering a wide range of scenarios.
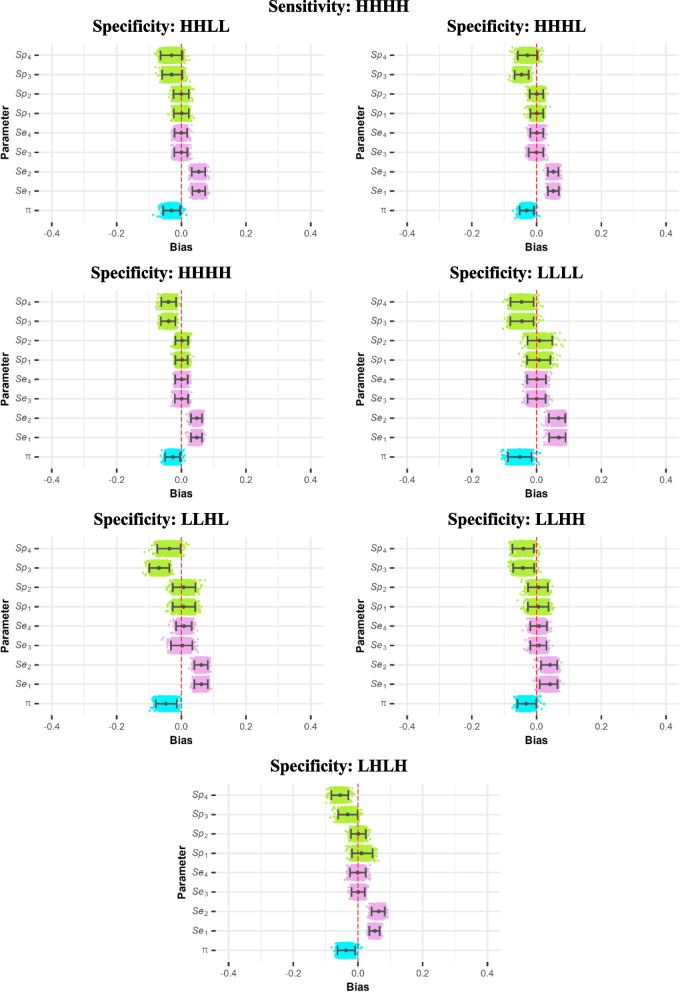
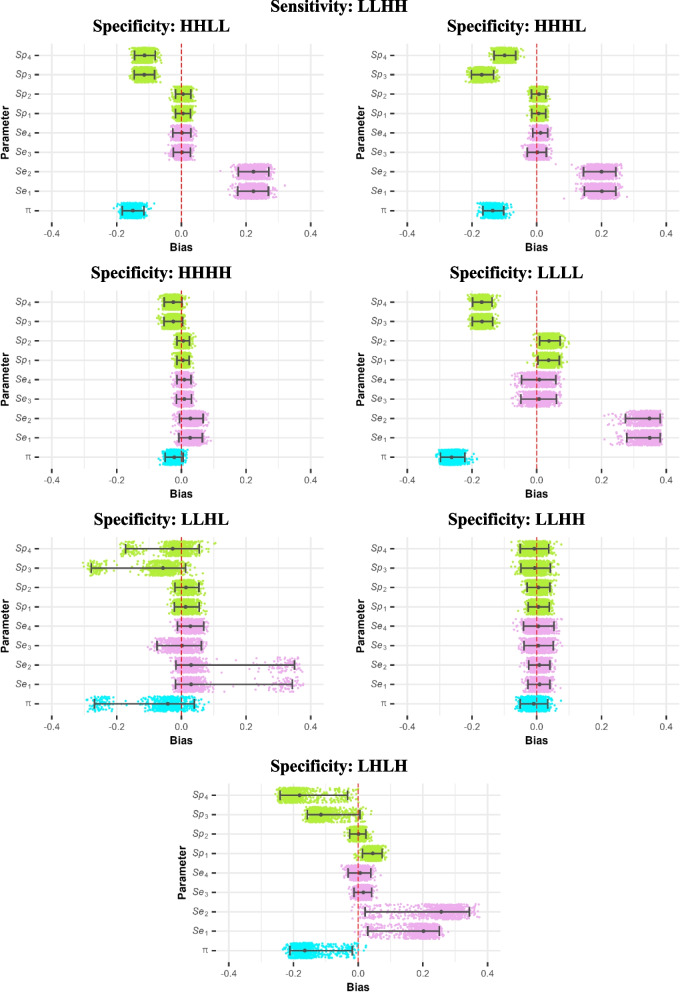
Methods: We generated data sets from a model with four tests and a dependence between tests 1 and 2 within the diseased group. We varied sample size, prevalence, covariance, sensitivity and specificity, with 504 combinations of these in total, and 1000 data sets for each combination. We fitted the conditional independence model in a Bayesian framework, and reported absolute bias, coverage, and how often the residual correlation plots, and statistics indicated lack-of-fit globally or for each test pair.
Results: Across all settings, residual correlation plots, pairwise and detected the correct correlated pair of tests only 12.1%, 10.3%, and 10.3% of the time, respectively, but incorrectly suggested dependence between tests 3 and 4 64.9%, 49.7%, and 49.5% of the time. We observed some variation in this across parameter settings, with these tools appearing to perform more as intended when tests 3 and 4 were both much more accurate than tests 1 and 2. Residual correlation plots, and statistics identified a lack of overall fit in 74.3%, 64.5% and 67.5% of models, respectively. The conditional independence model tended to overestimate the sensitivities of the correlated tests (median bias across all scenarios 0.094, 2.5th and 97.5th percentiles -0.003, 0.397) and underestimate prevalence and the specificities of the uncorrelated tests.
Conclusions: Residual correlation plots and chi-squared statistics cannot be relied upon to identify which tests are conditionally dependent, and also have relatively low power to detect lack of overall fit. This is important since failure to account for conditional dependence can lead to highly biased parameter estimates.
Keywords: Conditional independence; Diagnostic accuracy; Goodness of fit; Latent class model; Model selection; Residual correlation plots.
© 2024. The Author(s).
Conflict of interest statement
Declarations. Ethics approval and consent to participate: Not applicable. Consent for publication: Not applicable. Competing interests: The authors declare no competing interests.
Figures
Similar articles
-
Estimating sensitivity and specificity of diagnostic tests using latent class models that account for conditional dependence between tests: a simulation study.BMC Med Res Methodol. 2023 Mar 10;23(1):58. doi: 10.1186/s12874-023-01873-0. BMC Med Res Methodol. 2023. PMID: 36894883 Free PMC article.
-
Bayesian hierarchical latent class models for estimating diagnostic accuracy.Stat Methods Med Res. 2020 Apr;29(4):1112-1128. doi: 10.1177/0962280219852649. Epub 2019 May 30. Stat Methods Med Res. 2020. PMID: 31146651 Free PMC article.
-
Problems in detecting misfit of latent class models in diagnostic research without a gold standard were shown.J Clin Epidemiol. 2016 Jun;74:158-66. doi: 10.1016/j.jclinepi.2015.11.012. Epub 2015 Nov 25. J Clin Epidemiol. 2016. PMID: 26628335
-
Diagnosing diagnostic tests: evaluating the assumptions underlying the estimation of sensitivity and specificity in the absence of a gold standard.Prev Vet Med. 2005 Apr;68(1):19-33. doi: 10.1016/j.prevetmed.2005.01.006. Prev Vet Med. 2005. PMID: 15795013 Review.
-
Bayesian meta-analysis of diagnostic tests allowing for imperfect reference standards.Stat Med. 2013 Dec 30;32(30):5398-413. doi: 10.1002/sim.5959. Epub 2013 Sep 4. Stat Med. 2013. PMID: 24003003 Review.
References
-
- Hui SL, Walter SD. Estimating the error rates of diagnostic-tests. Biometrics. 1980;36(1):167–71. - PubMed
-
- Young MA. Evaluating diagnostic criteria: a latent class paradigm. J Psychiatr Res. 1982;17(3):285–96. - PubMed
-
- Walter SD, Irwig LM. Estimation of test error rates, disease prevalence and relative risk from misclassified data - a review. J Clin Epidemiol. 1988;41(9):923–37. - PubMed
-
- Dendukuri N, Joseph L. Bayesian approaches to modeling the conditional dependence between multiple diagnostic tests. Biometrics. 2001;57(1):158–67. - PubMed
-
- Vacek PM. The effect of conditional dependence on the evaluation of diagnostic-tests. Biometrics. 1985;41(4):959–68. - PubMed
MeSH terms
Grants and funding
LinkOut - more resources
Full Text Sources
