. 2024 Dec 5;22(1):284.
doi: 10.1186/s12915-024-02025-6.

Revisiting microgenderome: detecting and cataloguing sexually unique and enriched species in human microbiomes

Affiliations

Revisiting microgenderome: detecting and cataloguing sexually unique and enriched species in human microbiomes

Zhanshan Sam Ma. BMC Biol. .

Abstract

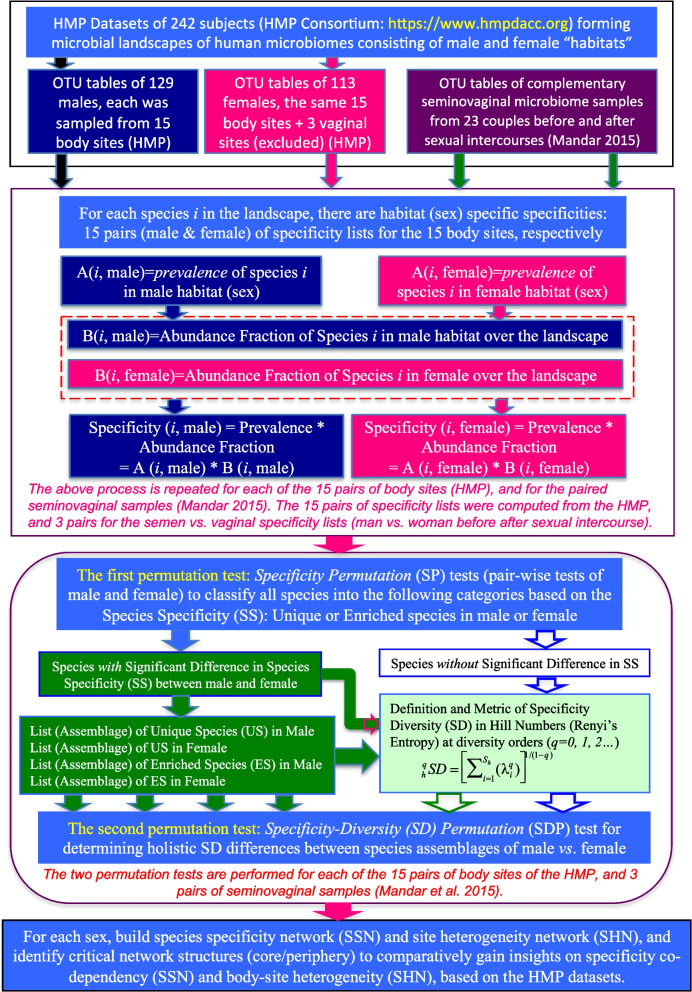
Background: Microgenderome or arguably more accurately microsexome refers to studies on sexual dimorphism of human microbiomes aimed at investigating bidirectional interactions between human microbiomes, sex hormones, and immune systems. It is important because of its implications to disease susceptibility and therapy, in which men and women demonstrate divergence in many diseases especially autoimmune diseases. In a previous report [1], we presented analyses of several key ecological aspects of microgenderome by leveraging the large datasets of the HMP (human microbiome project) but failed to offer species-level composition differences such as sexually unique species (US) and enriched species (ES). Existing approaches, for such tasks, including differential species relative abundance analysis and differential network analysis, possess certain limitations given that virtually all rely on species abundance alone or are univariate, while ignoring species distribution information across samples. Obviously, it is both species abundance and distribution that shape/drive the structure and dynamics of human microbiomes, and both should be equally responsible for the universal heterogeneity of microbiomes including the sexual dimorphism.

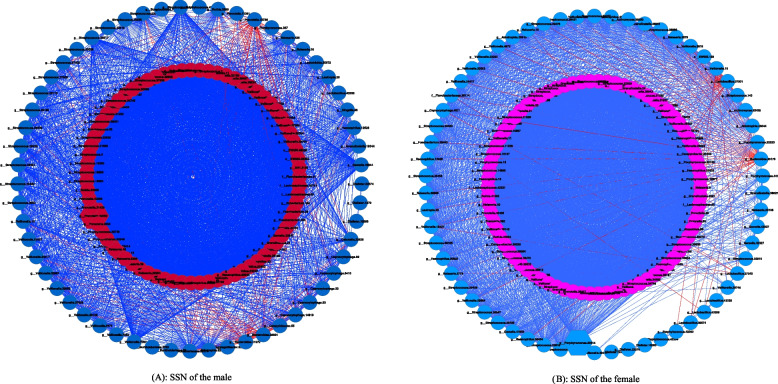
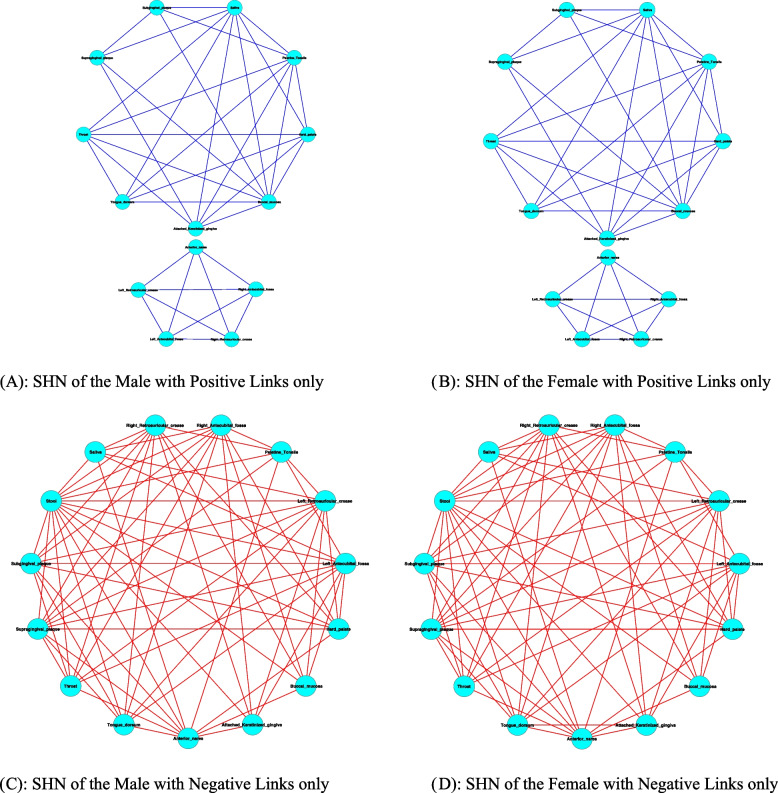
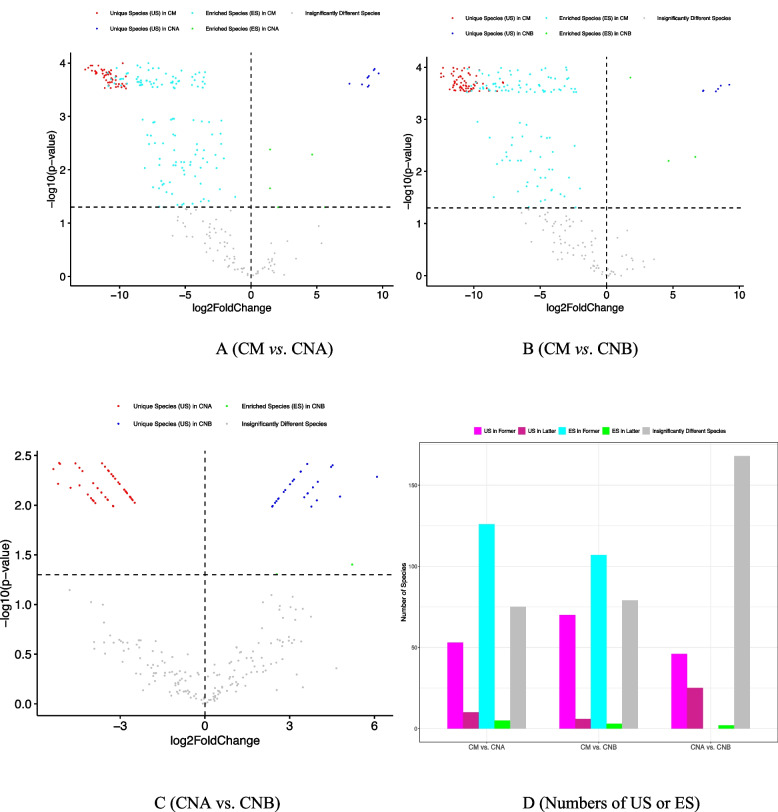
Results: Here, we fill the gap by taking advantages of a recently developed computational algorithm, species specificity, and specificity diversity (SSD) framework (refer to the companion article) to reanalyze the HMP and complementary seminovaginal microbiome datasets. The SSD framework can randomly search and catalogue the sexually specific unique/enriched species with statistical rigor, guided by species specificity (a synthetic metric of abundance and distribution) and specificity diversity (SD). The SSD framework reveals that men seem to have more unique species than women in their gut and reproductive system microbiomes, but women seem to have more unique species than men in the airway, oral, and skin microbiomes, which is likely due to sexual dimorphism in the hormone and immune systems. We further investigate co-dependency and heterogeneity of those sexually unique/enriched species across 15 body sites, with core/periphery network analyses.

Conclusions: This study not only produced sexually unique/enriched species in the human microbiomes and analyzed their codependency and heterogeneity but also further validated the robustness of the SSD framework presented in the companion article, by performing all negative control tests based on the HMP gut microbiome samples.

Keywords: Microgenderome; Permutation test; Sexually enriched species (ES); Sexually unique species (US); Species specificity (SS); Species specificity and specificity diversity (SSD) framework; Specificity diversity (SD).


Conflict of interest statement

Declarations. Ethics approval and consent to participate: This is not applicable since the study does not involve any wet-lab experiments or survey on human or animal subjects, and all analyzed datasets are already available in public domain, as mentioned above. Consent for publication: All authors approved the submission for publication. Competing interests: The author declares no competing interests.

Figures

Fig. 1
Fig. 1
The histograms of species specificity (SS) for both sexes at each of the 15 body sites, computed from the HMP datasets: the green was for the male and the purple for the female
Fig. 2
Fig. 2
The volcano map showing the distribution of unique species (US), enriched species (ES), and the insignificantly different species, from specificity permutation (SP) tests: the X-axis represents the log-transformation of the specificity fold change between male and female, where fold change = S(male)/S(female) (S represents specificity of species); Y-axis represents the negative log-transformation of the P-value from SP tests of the specificity differences between male and female cohorts. The vertical dotted line at X = 0 represents fold change = 1 [i.e., S(male) = S(female)]; the points in the right side of this dotted line represent species with S(male)/S(female) > 1 [i.e., S(male) > S(female)]; the left points represent species with S(male)/S(female) < 1 [i.e., S(male) < S(female)]. The horizontal dotted line represents P-value = 0.05 [–log10 × (0.05) = 1.301]; the points above the line represent species specificity with significant differences between male and female, and the points below represent species of non-significant differences in specificity. Therefore, the grey points represent species of non-significant differences in species specificity between male and female, cyan points represent significant enriched species in male, green points represent significant enriched species in female, and red and blue points represent unique species in male and female, respectively. See Fig. S1A in the OSI for the volcanos of other sites; Fig. S1B also included the “directly drawn” [without using log(fold changes)] volcano graphs of these graphs
Fig. 3
Fig. 3
The specificity diversity (SD) for the “Anterior nares” and “Stool” body site: Y-axis shows the SD at different diversity order (q = 0–4, X-axis) for each of the six species categories (from top to bottom plot) including unique species (US) in male, US in female, enriched species (ES) in male, ES in female, species with significant differences, and all species (with + without differences). See Fig. S2 in the OSI for the results of SDP tests of other body sites
Fig. 4
Fig. 4
The numbers of unique species (US) and enriched species (ES) at each body site: the number of the US in the female is approximately 6–16 times more than the number of the US in the male, while the number of ES is similar in both sexes
Fig. 5
Fig. 5
The species specificity network (SSN) of the male (A) and female (B): core nodes are in pink color, and periphery nodes are in cyan color; positive links are in green and negative links are in red; hexagon represents for hub. See Fig. S3 in the OSI for the top two strongest clusters detected from the SSNs, in which both male and female exhibited the same patterns: core and periphery forms the top two strongest clusters, and the within core links seem to be positively only
Fig. 6
Fig. 6
The site heterogeneity network (SHN) for the male (A and C) and female (B and D), respectively: to facilitate visual inspection, each SHN network was decomposed as two sub-networks of positive and negative links. Two observations can be made: (i) both sexes show the virtually same SHN structures; (ii) positive links exist within the sites of the same habitat except for the anterior nares, and negative links occurred between habitats (stool vs. oral, stool vs. skin, oral vs. skin,…). See Fig. S4 in the OSI for the total graphs (positive and negative networks restored as whole networks)
Fig. 7
Fig. 7
The comparisons of seminovaginal microbiomes (CM = semen, CNA = vaginal before sex, CNB = vaginal after sex): CMA vs. CNA, CM vs. CNB, and CAN vs. CNB. AC are volcano graphs of US (unique species), ES (enriched species), and insignificantly different species, and (D) further illustrated the species numbers of different species categories. Similar to gut, men seem to have more US/ES species than women, and the sexual intercourse seems to raise the level of the differences. See Fig. S5-S6 for the other results (histograms, SDP tests) of the seminovaginal microbiome comparisons
Fig. 8
Fig. 8
Diagram illustrating the computational procedures of species specificity and specificity diversity (SSD) framework: (i) the top block—the HMP datasets as input, (ii) the 2nd block—definition of species specificity (SS), (iii) the 3rd block—definition and algorithms of specificity diversity (SD) and specificity permutation (SP) and SD permutation (SDP) tests, (iv) the bottom block—network analysis for specificity co-dependency and human body site heterogeneity in specificity

Similar articles

Cited by

References

    1. Ma ZS, Li W. How and why men and women differ in their microbiomes: medical ecology and network analyses of the microgenderome. Adv Sci. 2019;6(23):1902054. - PMC - PubMed
    1. Flak MB, Neves JF, Blumberg RS. Welcome to the microgenderome. Science. 2013;339(6123):1044–5. - PMC - PubMed
    1. Klein SL, Flanagan KL. Sex differences in immune responses. Nat Rev Immunol. 2016;16(10):626–38. - PubMed
    1. Rizzetto L, Fava F, Tuohy KM, Selmi C. Connecting the immune system, systemic chronic inflammation and the gut microbiome: the role of sex. J Autoimmun. 2018;1(92):12–34. - PubMed
    1. Vogelzang A, Guerrini MM, Minato N, Fagarasan S. Microbiota—an amplifier of autoimmunity. Curr Opin Immunol. 2018;1(55):15–21. - PubMed

LinkOut - more resources