

Increased spatial coupling of integrin and collagen IV in the immunoresistant clear-cell renal-cell carcinoma tumor microenvironment
- PMID: 39639369
- PMCID: PMC11622564
- DOI: 10.1186/s13059-024-03435-z
Increased spatial coupling of integrin and collagen IV in the immunoresistant clear-cell renal-cell carcinoma tumor microenvironment
Abstract
Background: Immunotherapy has improved survival for patients with advanced clear cell renal cell carcinoma (ccRCC), but resistance to therapy develops in most patients. We use cellular-resolution spatial transcriptomics in patients with immunotherapy naïve and exposed primary ccRCC tumors to better understand immunotherapy resistance.
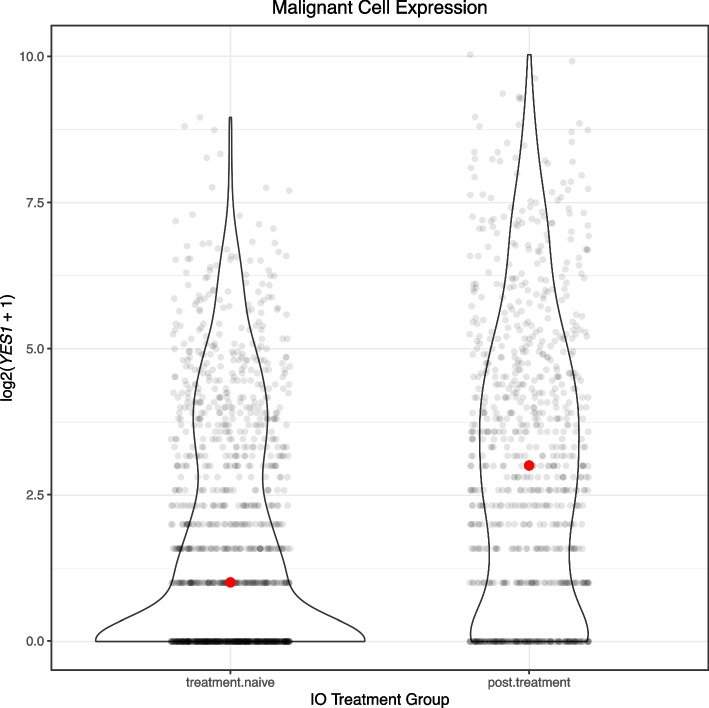
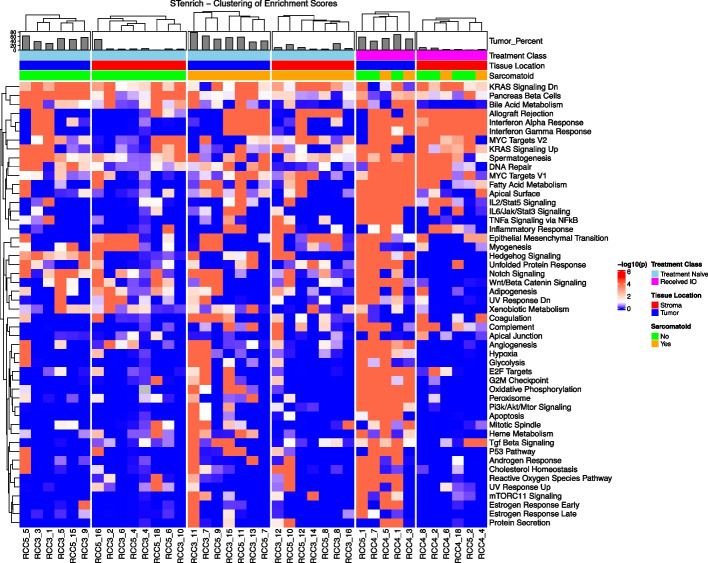
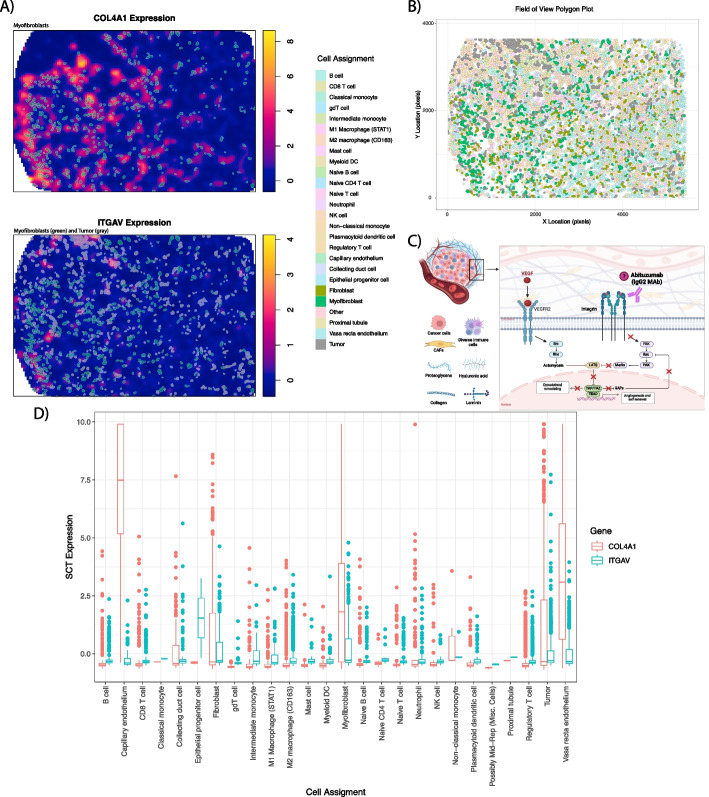
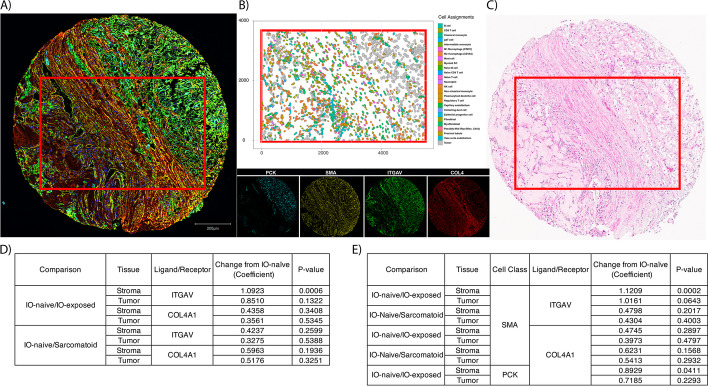
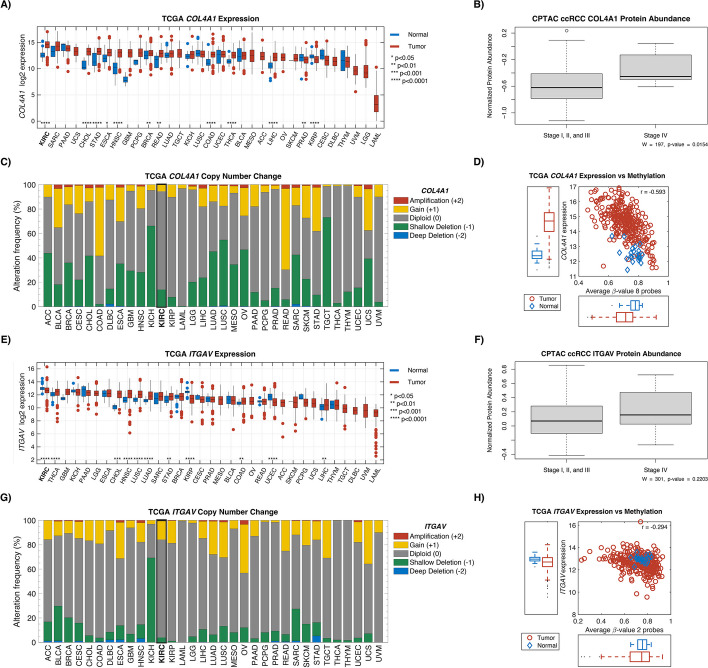
Results: Spatial molecular imaging of tumor and adjacent stroma samples from 21 tumors suggests that viable tumors following immunotherapy harbor more stromal CD8 + T cells and neutrophils than immunotherapy naïve tumors. YES1 is significantly upregulated in immunotherapy exposed tumor cells. Spatial GSEA shows that the epithelial-mesenchymal transition pathway is spatially enriched and the associated ligand-receptor transcript pair COL4A1-ITGAV has significantly higher autocorrelation in the stroma after exposure to immunotherapy. More integrin αV + cells are observed in immunotherapy exposed stroma on multiplex immunofluorescence validation. Compared to other cancers in TCGA, ccRCC tumors have the highest expression of both COL4A1 and ITGAV. Assessing bulk RNA expression and proteomic correlates in CPTAC databases reveals that collagen IV protein is more abundant in advanced stages of disease.
Conclusions: Spatial transcriptomics of samples of 3 patient cohorts with cRCC tumors indicates that COL4A1 and ITGAV are more autocorrelated in immunotherapy-exposed stroma compared to immunotherapy-naïve tumors, with high expression among fibroblasts, tumor cells, and endothelium. Further research is needed to understand changes in the ccRCC tumor immune microenvironment and explore potential therapeutic role of integrin after immunotherapy treatment.
Keywords: Immunotherapy resistance; Ligand receptor; Malignant-cell typing; Single-cell RNA; Spatial transcriptomics.
© 2024. The Author(s).
Conflict of interest statement
Declarations. Ethics approval and consent to participate: Consent to participate was acquired through the Institutional Review Board under the Total Cancer care protocol (MCC #20148, Advarra [Pro00038234]). All experimental methods comply with the Declaration of Helsinki for Medical Research involving Human Subjects. Consent for publication: Not applicable. Competing interests: The corresponding author certifies that all conflicts of interest, including specific financial interests and relationships and affiliations relevant to the subject matter or materials discussed in the manuscript (i.e., employment/affiliation, grants or funding, consultancies, honoraria, stock ownership or options, expert testimony, royalties, or patents filed, received, or pending), are the following: ACS, MTH, TCP, OEO, NHC, AEB, PAS, JN, CMS, NLF, PMRE, KYT, JAB, YCP, JD, LAM, WEG, and BLF have no relevant disclosures; BJM is an NCCN Kidney Cancer Panel Member and an advisor for Merck; RL received research support from Predicine, Veracyte, CG Oncology, Valar Labs, and Merck, is on the clinical trials committee for CG Oncology, is scientific advisor for Bristol Myers Squibb, Merck, Fergene, Arquer Diagnostics, Urogen Pharma, Lucence, CG Oncology, and Janssen, and has received honoraria from SAI MedPartners, Solstice Health Communications, Putnam Associates, and UroToday; JJM is Associate Center Director at Moffitt Cancer Center, has ownership interest in Aleta Biotherapeutics, CG Oncology, Turnstone Biologics, Ankyra Therapeutics, and AffyImmune Therapeutics, and is a paid consultant/paid advisory board member for ONCoPEP, CG Oncology, Turnstone Biologics, Vault Pharma, Ankyra Therapeutics, AffyImmune Therapeutics, UbiVac, Vycellix, and Aleta Biotherapeutics; NS, SK, and MG are or formerly were employees of NanoString.
Figures
Update of
-
Increased spatial coupling of integrin and collagen IV in the immunoresistant clear cell renal cell carcinoma tumor microenvironment.bioRxiv [Preprint]. 2023 Nov 17:2023.11.16.567457. doi: 10.1101/2023.11.16.567457. bioRxiv. 2023. Update in: Genome Biol. 2024 Dec 5;25(1):308. doi: 10.1186/s13059-024-03435-z. PMID: 38014063 Free PMC article. Updated. Preprint.
Similar articles
-
Lessons learned from spatial transcriptomic analyses in clear-cell renal cell carcinoma.Nat Rev Urol. 2025 Jan 9. doi: 10.1038/s41585-024-00980-x. Online ahead of print. Nat Rev Urol. 2025. PMID: 39789293 Review.
-
Increased spatial coupling of integrin and collagen IV in the immunoresistant clear cell renal cell carcinoma tumor microenvironment.bioRxiv [Preprint]. 2023 Nov 17:2023.11.16.567457. doi: 10.1101/2023.11.16.567457. bioRxiv. 2023. Update in: Genome Biol. 2024 Dec 5;25(1):308. doi: 10.1186/s13059-024-03435-z. PMID: 38014063 Free PMC article. Updated. Preprint.
-
Single-cell transcriptomics reveals the heterogeneity and function of mast cells in human ccRCC.Front Immunol. 2025 Jan 7;15:1494025. doi: 10.3389/fimmu.2024.1494025. eCollection 2024. Front Immunol. 2025. PMID: 39840068 Free PMC article.
-
Construction of a Novel Immune-Related lncRNA Pair Signature with Prognostic Significance for Kidney Clear Cell Renal Cell Carcinoma.Dis Markers. 2021 Sep 1;2021:8800358. doi: 10.1155/2021/8800358. eCollection 2021. Dis Markers. 2021. PMID: 34512816 Free PMC article.
-
Roles of the Dynamic Tumor Immune Microenvironment in the Individualized Treatment of Advanced Clear Cell Renal Cell Carcinoma.Front Immunol. 2021 Mar 4;12:653358. doi: 10.3389/fimmu.2021.653358. eCollection 2021. Front Immunol. 2021. PMID: 33746989 Free PMC article. Review.
Cited by
-
Quantifying and interpreting biologically meaningful spatial signatures within tumor microenvironments.NPJ Precis Oncol. 2025 Mar 11;9(1):68. doi: 10.1038/s41698-025-00857-1. NPJ Precis Oncol. 2025. PMID: 40069556 Free PMC article. Review.
-
Cancer therapy resistance from a spatial-omics perspective.Clin Transl Med. 2025 Jul;15(7):e70396. doi: 10.1002/ctm2.70396. Clin Transl Med. 2025. PMID: 40677104 Free PMC article. Review.
-
Exact Expectation of Complete Spatial Randomness for Nearest Neighbor G(r): A Scalable Alternative to Permutations.bioRxiv [Preprint]. 2025 Jun 17:2025.06.11.659088. doi: 10.1101/2025.06.11.659088. bioRxiv. 2025. PMID: 40666920 Free PMC article. Preprint.
-
Lessons learned from spatial transcriptomic analyses in clear-cell renal cell carcinoma.Nat Rev Urol. 2025 Jan 9. doi: 10.1038/s41585-024-00980-x. Online ahead of print. Nat Rev Urol. 2025. PMID: 39789293 Review.
-
Astragaloside IV regulates macrophage polarization via the TLR4/NF-κB/STAT3 pathway to inhibit the malignant phenotype of renal clear cell carcinoma.Naunyn Schmiedebergs Arch Pharmacol. 2025 May 9. doi: 10.1007/s00210-025-04219-3. Online ahead of print. Naunyn Schmiedebergs Arch Pharmacol. 2025. PMID: 40343452
References
-
- Rini BI, Plimack ER, Stus V, Gafanov R, Hawkins R, Nosov D, Pouliot F, Alekseev B, Soulières D, Melichar B, et al. Pembrolizumab plus axitinib versus sunitinib for advanced renal-cell carcinoma. N Engl J Med. 2019;380:1116–27. - PubMed
-
- Albiges L, Tannir NM, Burotto M, McDermott D, Plimack ER, Barthélémy P, Porta C, Powles T, Donskov F, George S, et al. Nivolumab plus ipilimumab versus sunitinib for first-line treatment of advanced renal cell carcinoma: extended 4-year follow-up of the phase III CheckMate 214 trial. ESMO Open. 2020;5: e001079. - PMC - PubMed
-
- Tannir NM, Signoretti S, Choueiri TK, McDermott DF, Motzer RJ, Flaifel A, Pignon JC, Ficial M, Frontera OA, George S, et al. Efficacy and safety of nivolumab plus ipilimumab versus sunitinib in first-line treatment of patients with advanced sarcomatoid renal cell carcinoma. Clin Cancer Res. 2021;27:78–86. - PMC - PubMed
MeSH terms
Substances
Grants and funding
LinkOut - more resources
Full Text Sources
Medical
Research Materials
Miscellaneous
