

Whole-genome resequencing to investigate the genetic diversity and mechanisms of plateau adaptation in Tibetan sheep
- PMID: 39639384
- PMCID: PMC11622566
- DOI: 10.1186/s40104-024-01125-1
Whole-genome resequencing to investigate the genetic diversity and mechanisms of plateau adaptation in Tibetan sheep
Abstract
Introduction: Tibetan sheep, economically important animals on the Qinghai-Tibet Plateau, have diversified into numerous local breeds with unique characteristics through prolonged environmental adaptation and selective breeding. However, most current research focuses on one or two breeds, and lacks a comprehensive representation of the genetic diversity across multiple Tibetan sheep breeds. This study aims to fill this gap by investigating the genetic structure, diversity and high-altitude adaptation of 6 Tibetan sheep breeds using whole-genome resequencing data.
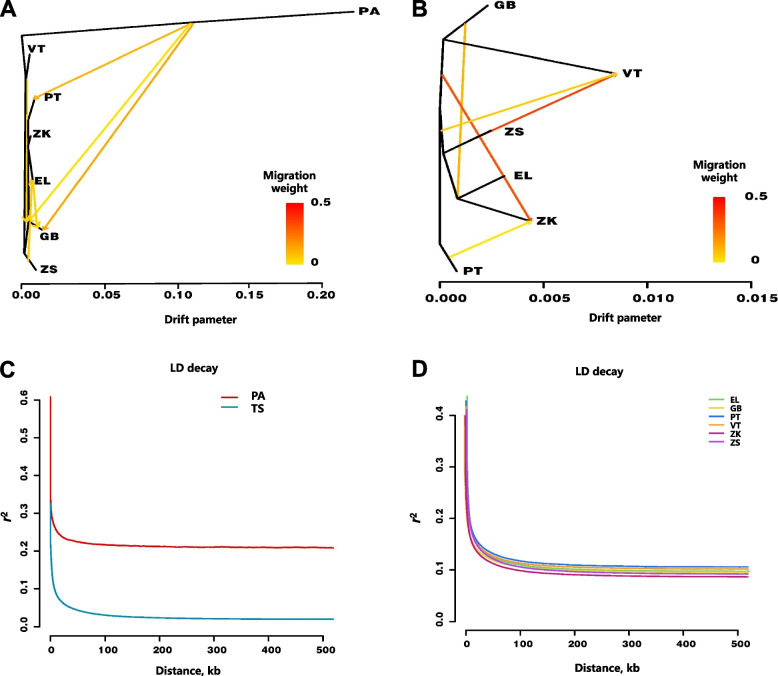
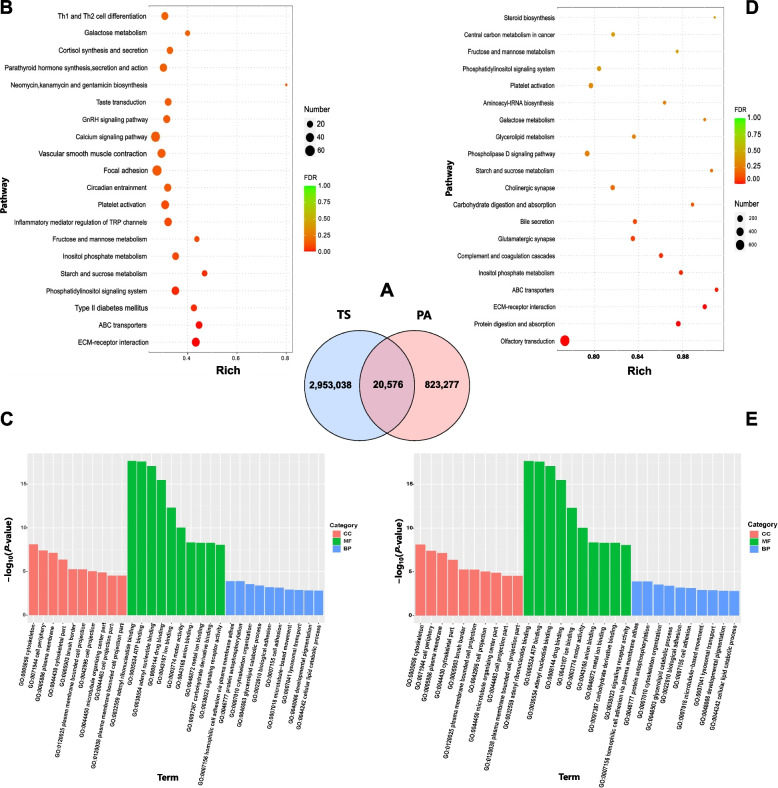
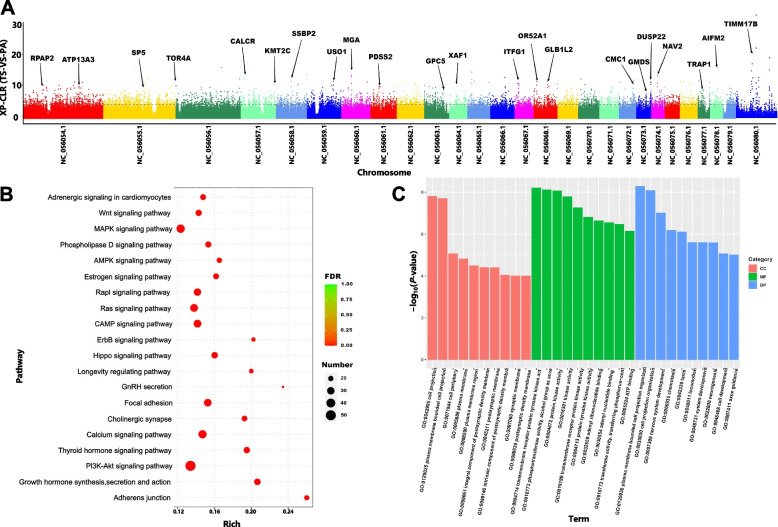
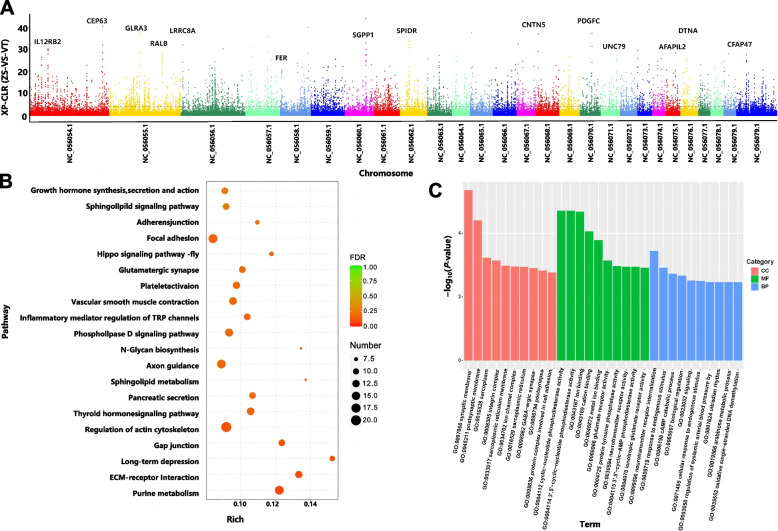
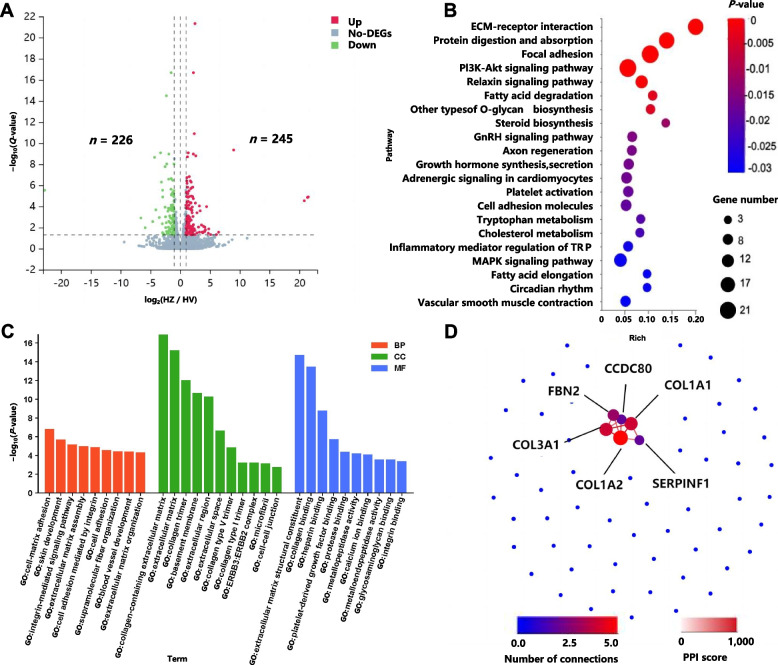
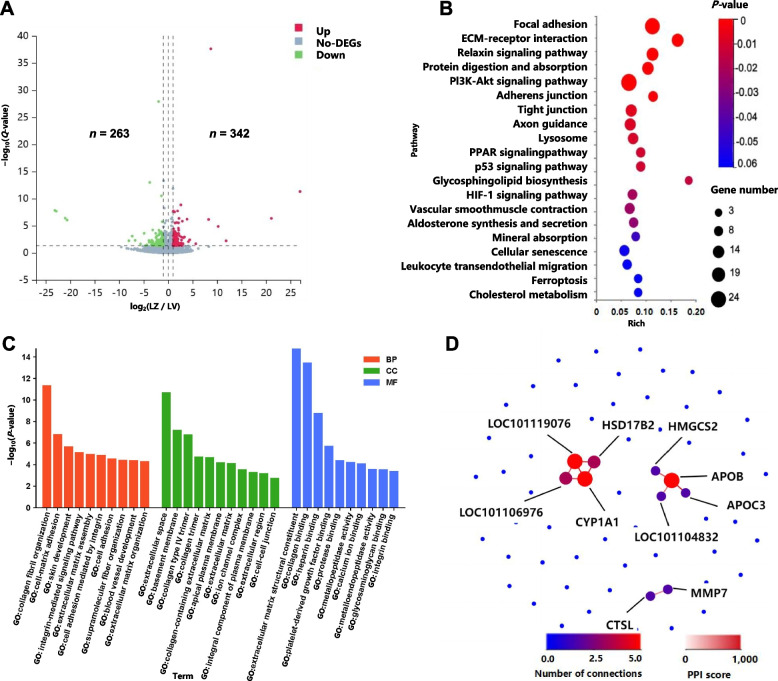
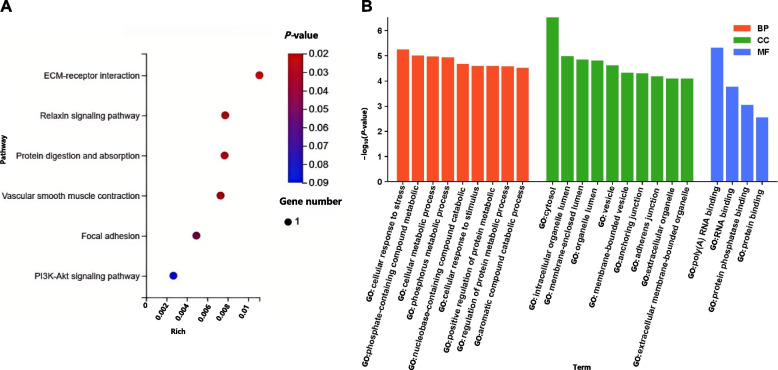
Results: Six Tibetan sheep breeds were investigated in this study, and whole-genome resequencing data were used to investigate their genetic structure and population diversity. The results showed that the 6 Tibetan sheep breeds exhibited distinct separation in the phylogenetic tree; however, the levels of differentiation among the breeds were minimal, with extensive gene flow observed. Population structure analysis broadly categorized the 6 breeds into 3 distinct ecological types: plateau-type, valley-type and Euler-type. Analysis of unique single-nucleotide polymorphisms (SNPs) and selective sweeps between Argali and Tibetan sheep revealed that Tibetan sheep domestication was associated primarily with sensory and signal transduction, nutrient absorption and metabolism, and growth and reproductive characteristics. Finally, comprehensive analysis of selective sweep and transcriptome data suggested that Tibetan sheep breeds inhabiting different altitudes on the Qinghai-Tibet Plateau adapt by enhancing cardiopulmonary function, regulating body fluid balance through renal reabsorption, and modifying nutrient digestion and absorption pathways.
Conclusion: In this study, we investigated the genetic diversity and population structure of 6 Tibetan sheep breeds in Qinghai Province, China. Additionally, we analyzed the domestication traits and investigated the unique adaptation mechanisms residing varying altitudes in the plateau region of Tibetan sheep. This study provides valuable insights into the evolutionary processes of Tibetan sheep in extreme environments. These findings will also contribute to the preservation of genetic diversity and offer a foundation for Tibetan sheep diversity preservation and plateau animal environmental adaptation mechanisms.
Keywords: Altitude adaptation; Domestication; Genetic selection; Population genetic structure; Tibetan sheep; Whole-genome sequencing.
© 2024. The Author(s).
Conflict of interest statement
Declarations. Ethics approval and consent to participate: All animal experiments adhered to the protocols outlined in the Guidelines for Animal Care and Use manual (Approval No. NWIPB2023015, Date: July 12, 2023), which were approved by the Animal Care and Use Committee of the Northwest Institute of Plateau Biology, Chinese Academy of Sciences. Consent for publication: Not applicable. Competing interests: The authors declare that they have no competing interests.
Figures

Similar articles
-
Leveraging Whole-Genome Resequencing to Uncover Genetic Diversity and Promote Conservation Strategies for Ruminants in Asia.Animals (Basel). 2025 Mar 13;15(6):831. doi: 10.3390/ani15060831. Animals (Basel). 2025. PMID: 40150358 Free PMC article. Review.
-
Genetic diversity and population structure of Tibetan sheep breeds determined by whole genome resequencing.Trop Anim Health Prod. 2021 Feb 20;53(1):174. doi: 10.1007/s11250-021-02605-6. Trop Anim Health Prod. 2021. PMID: 33611716
-
Whole genome sequencing revealed genetic diversity, population structure, and selective signature of Panou Tibetan sheep.BMC Genomics. 2023 Jan 28;24(1):50. doi: 10.1186/s12864-023-09146-2. BMC Genomics. 2023. PMID: 36707771 Free PMC article.
-
Resequencing reveals population structure and genetic diversity in Tibetan sheep.BMC Genomics. 2024 Sep 30;25(1):906. doi: 10.1186/s12864-024-10800-6. BMC Genomics. 2024. PMID: 39350030 Free PMC article.
-
Rumen microbiota of indigenous and introduced ruminants and their adaptation to the Qinghai-Tibetan plateau.Front Microbiol. 2022 Oct 10;13:1027138. doi: 10.3389/fmicb.2022.1027138. eCollection 2022. Front Microbiol. 2022. PMID: 36299720 Free PMC article. Review.
Cited by
-
Leveraging Whole-Genome Resequencing to Uncover Genetic Diversity and Promote Conservation Strategies for Ruminants in Asia.Animals (Basel). 2025 Mar 13;15(6):831. doi: 10.3390/ani15060831. Animals (Basel). 2025. PMID: 40150358 Free PMC article. Review.
-
Genetic and Epigenetic Adaptation Mechanisms of Sheep Under Multi-Environmental Stress Environment.Int J Mol Sci. 2025 Apr 1;26(7):3261. doi: 10.3390/ijms26073261. Int J Mol Sci. 2025. PMID: 40244095 Free PMC article. Review.
-
Molecular Genetic Basis of Reproductive Fitness in Tibetan Sheep on the Qinghai-Tibet Plateau.Genes (Basel). 2025 Jul 29;16(8):909. doi: 10.3390/genes16080909. Genes (Basel). 2025. PMID: 40869957 Free PMC article.
-
Whole-genome sequencing resources of 301 indigenous Tibetan sheep from the Himalayan region.Sci Data. 2025 Aug 4;12(1):1351. doi: 10.1038/s41597-025-05650-0. Sci Data. 2025. PMID: 40760128 Free PMC article.
-
Genome-wide identification of selection signatures across altitudinal gradients in dairy sheep breeds.Sci Rep. 2025 Aug 8;15(1):29117. doi: 10.1038/s41598-025-14767-6. Sci Rep. 2025. PMID: 40781355 Free PMC article.
References
-
- Molaei Moghbeli S, Barazandeh A, Vatankhah M, Mohammadabadi M. Genetics and non-genetics parameters of body weight for post-weaning traits in Raini Cashmere goats. Trop Anim Health Prod. 2013;45(7):1519–24. - PubMed
-
- Barazandeh A, Mohammadabadi MR, Ghaderi-Zefrehei M, Nezamabadipour H. Genome-wide analysis of CpG islands in some livestock genomes and their relationship with genomic features. Czech J Anim Sci. 2016;61(11):487–95.
-
- Vahabzadeh M, Chamani M, Dayani O, Sadeghi AA, Mohammadabadi M. Effect of Origanum majorana leaf (Sweet marjoram) feeding on lamb’s growth, carcass characteristics and blood biochemical parameters. Small Ruminant Res. 2020;192:106233.
-
- Askari N, Mohammadabadi M, Baghizadeh A. ISSR markers for assessing DNA polymorphism and genetic characterization of cattle, goat and sheep populations. Iran J Biotechnol. 2011;9(3):222–9.
Grants and funding
LinkOut - more resources
Full Text Sources
Miscellaneous
