. 2024 Oct 28;35(4):102369.
doi: 10.1016/j.omtn.2024.102369. eCollection 2024 Dec 10.

The role of Sertoli cell-derived miR-143-3p in male fertility declines with age

Affiliations

The role of Sertoli cell-derived miR-143-3p in male fertility declines with age

Jinlian Liang et al. Mol Ther Nucleic Acids. .

Abstract

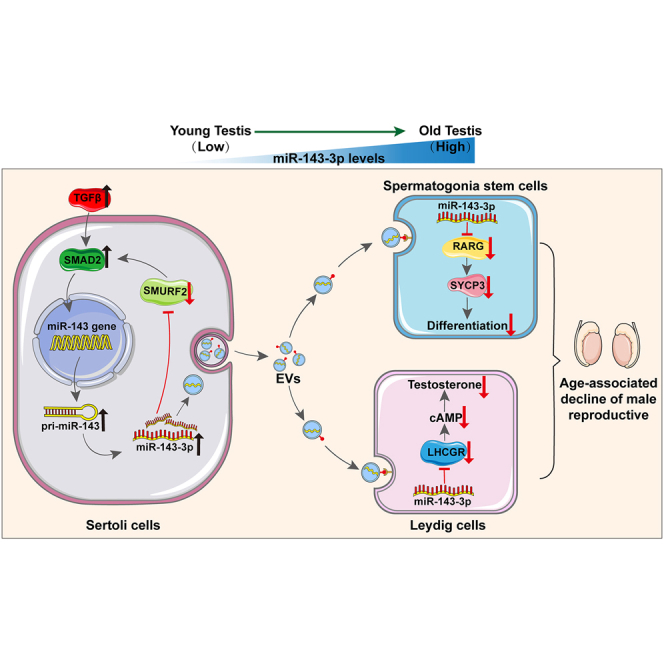
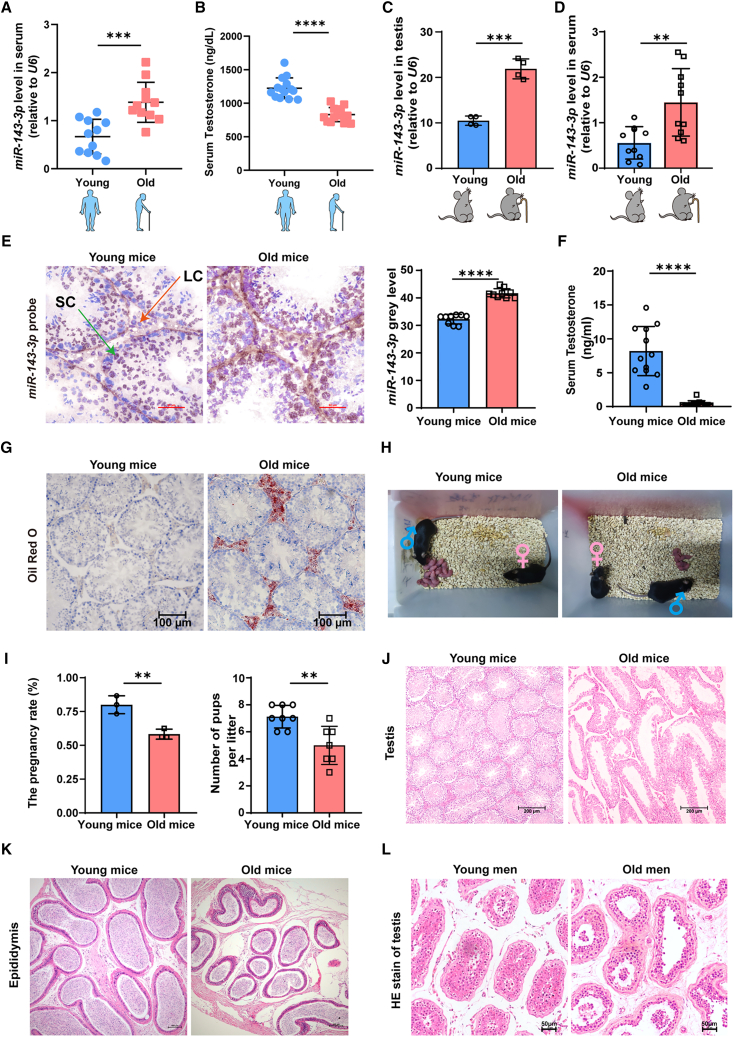
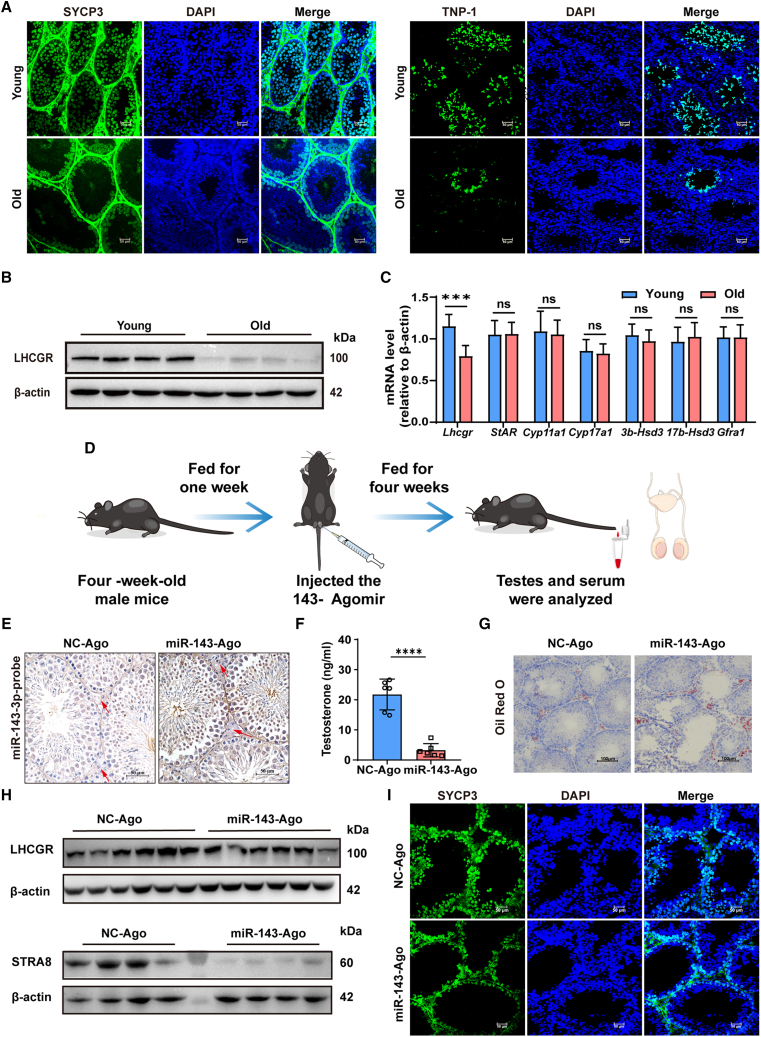
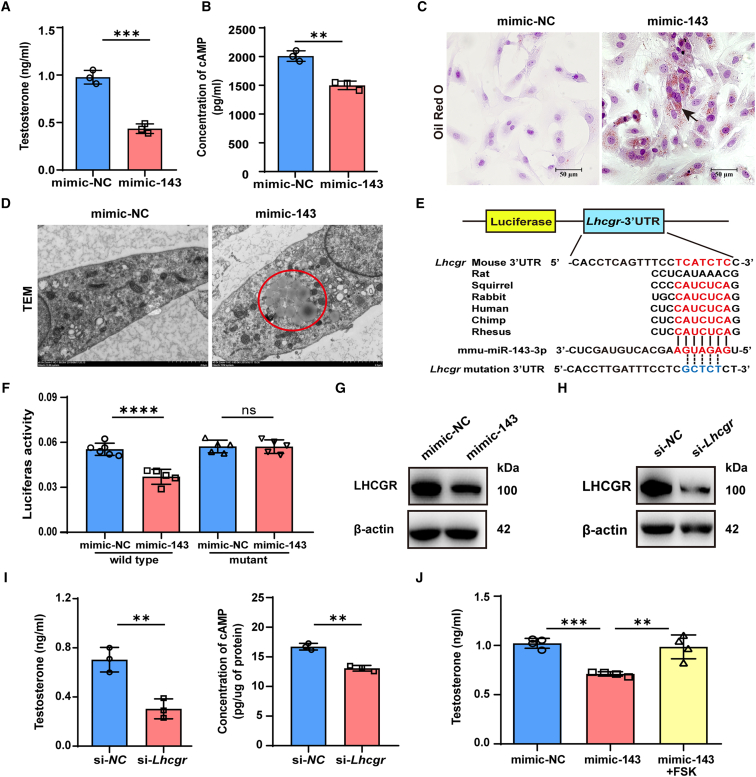
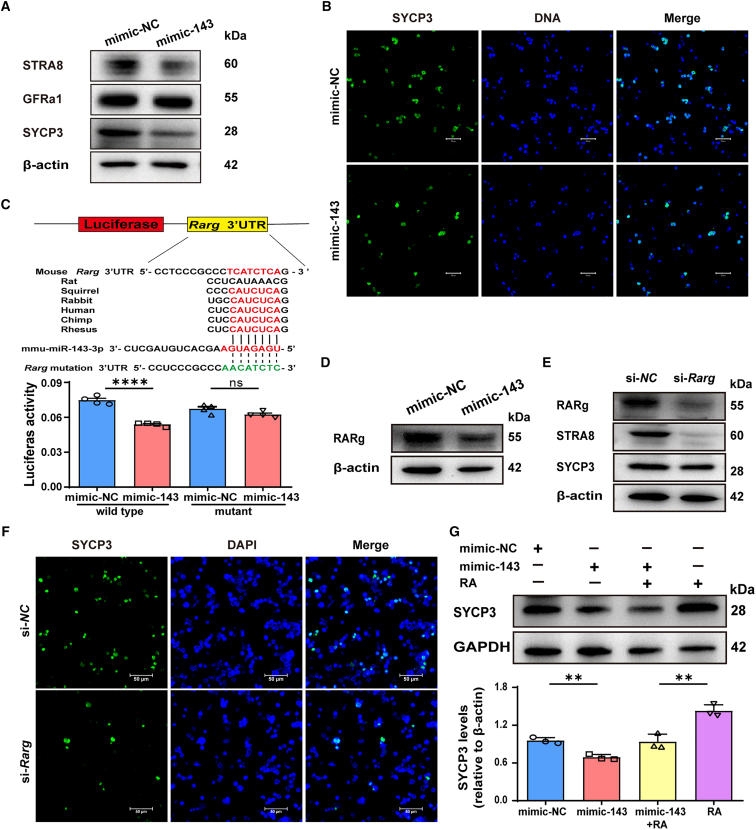
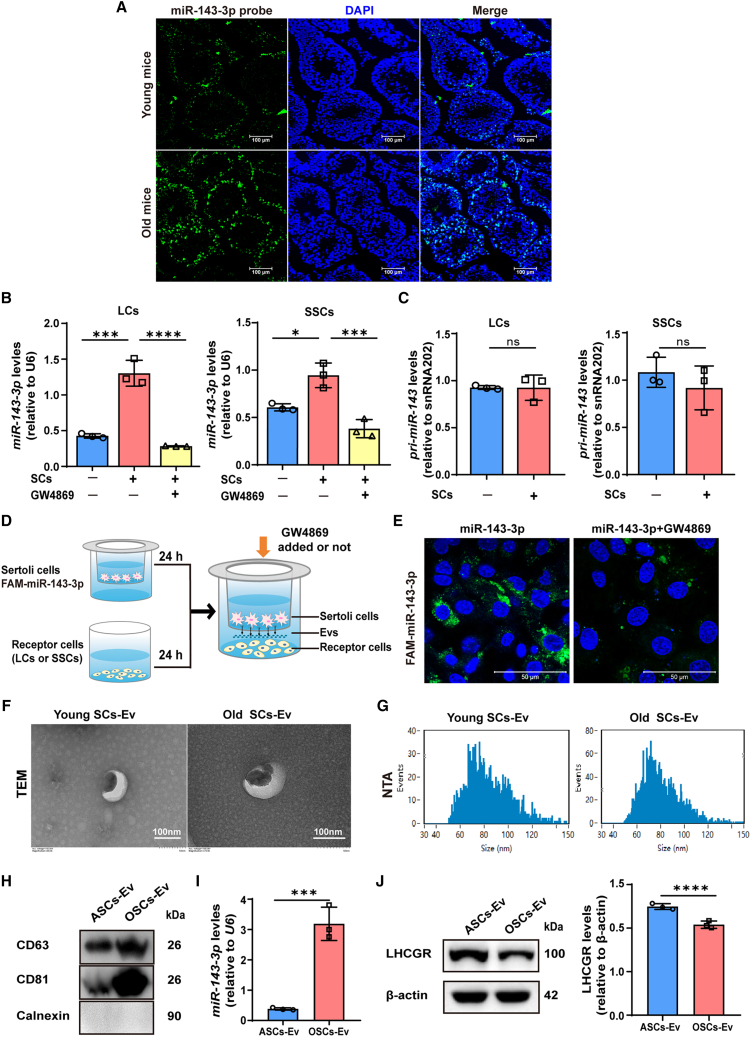
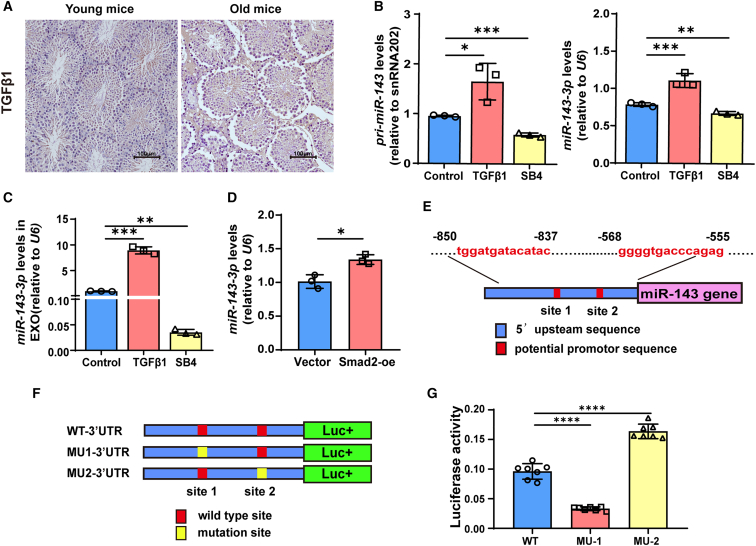
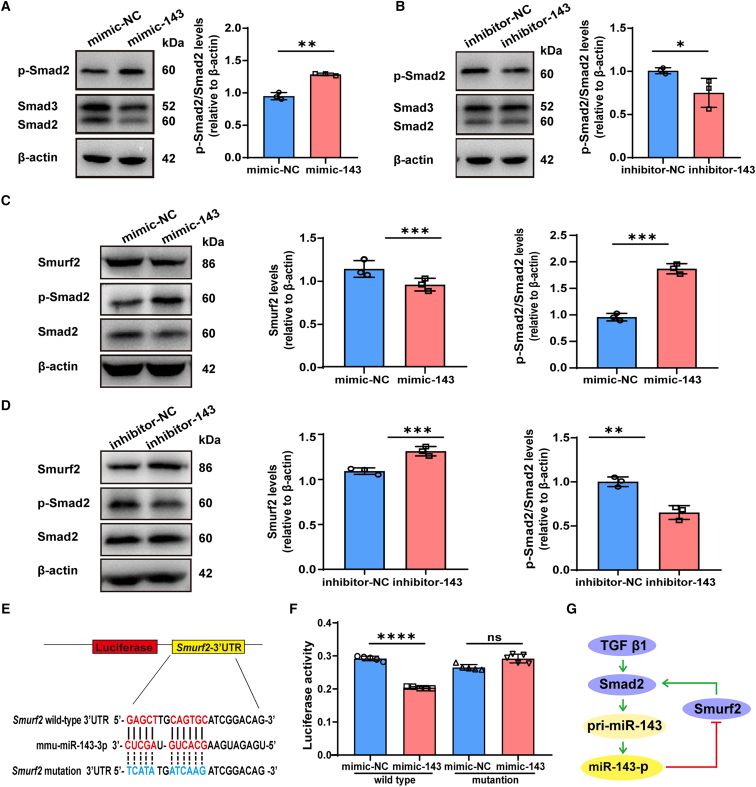
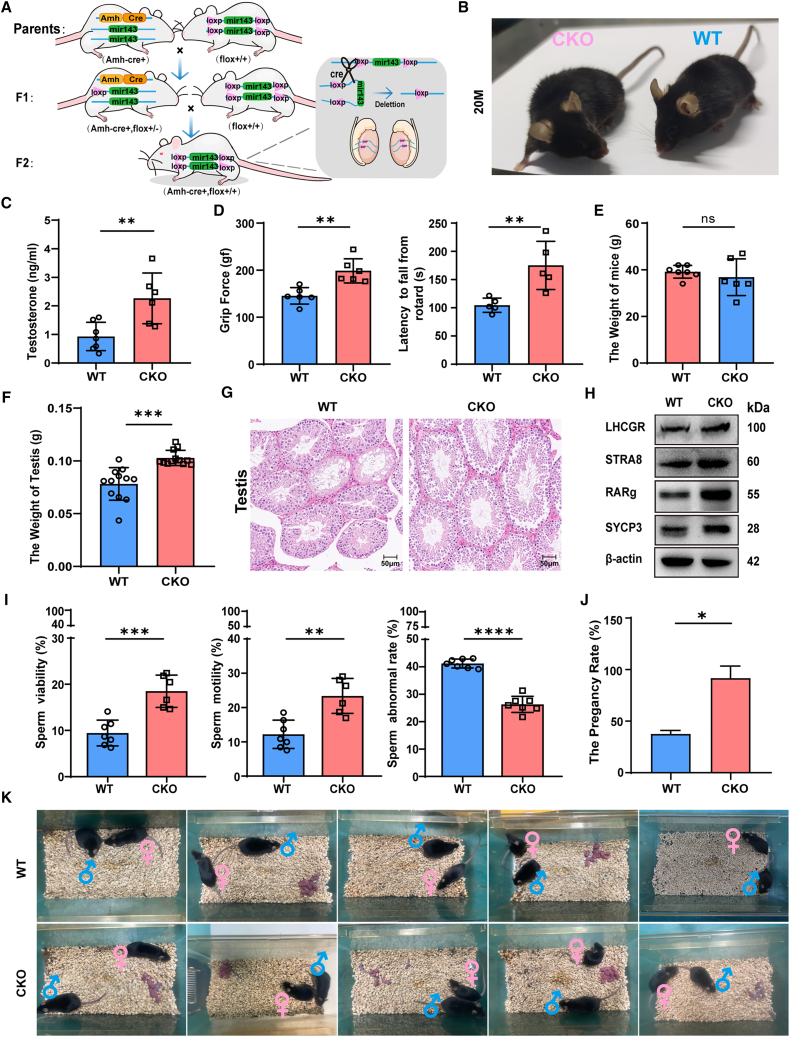
As delayed parenthood becomes more prevalent, understanding age-related testosterone decline and its impact on male fertility has gained importance. However, molecular mechanisms concerning testicular aging remain largely undiscovered. Our study highlights that miR-143-3p, present in aging Sertoli cells (SCs), is loaded into extracellular vesicles (EVs), affecting Leydig cells (LCs) and germ cells, thus disrupting testicular tissue homeostasis and spermatogenesis. Intriguingly, in SCs, transforming growth factor-β signaling promotes miR-143 precursors transcription, increasing mature miR-143-3p levels. This inhibits Smurf2, activating Smad2, and further enhancing miR-143-3p accumulation. EVs transporting miR-143-3p, originating from SCs, contribute to the age-related decline of testosterone and male fertility by targeting the luteinizing hormone receptor and retinoic acid receptor. Diminishing endogenous miR-143-3p in SCs postpones testis aging, preserving and prolonging male fertility. Thus, our study identified miR-143-3p as a key regulator of testicular function and fertility, revealing miR-143-3p as a potential therapeutic target for male abnormal sexual and reproductive function.

Keywords: EVs; MT: Non-coding RNAs; Sertoli cells; aging; extracellular vesicles; male fertility; miR-143-3p.


Conflict of interest statement

The authors declare no competing interests.

Figures

None
Graphical abstract
Figure 1
Figure 1
miR-143-3p involved in age-associated decline of male reproductive capacity (A) miR-143-3p levels in serum of young, middle-aged, and old men detected by quantitative reverse-transcription PCR (n = 11). (B) Serum testosterone concentration of the young, middle-aged, and old men (n = 14) measured by radioimmunoassay (RIA). (C) Expression of miR-143-3p in testicular tissue of young and old mice detected by quantitative reverse-transcription PCR (n = 4). (D) miR-143-3p levels in serum of young and old male mice (n = 10). (E) Representative images of in situ hybridization of testicular tissue of young and old male mice, and the statistics results of gray values (n = 10), scale bar, 50 μm. LC was pointed out by an orange arrow and SC was pointed out by a green arrow. (F) RIA analysis of testosterone concentrations in young and old male mice serum (n = 10). (G) Representative images of Oil Red O staining in testicular tissue of young and old mice, scale bar, 100 μm. (H) Image of young and old male mice and their offspring produced after mating with female mice. (I) The pregnancy rate and number of pups produced by the young and old mice mating with female mice of appropriate age (n = 8). (J) and (K) H&E staining of testis and epididymis of young and old mice, scale bar, 200 μm and 100 μm. (L) H&E staining of testis from young and old male prostate cancer patients, scale bar, 50 μm. The data are shown as the mean ± SD; unpaired t test (A–F, I). ∗∗p < 0.01, ∗∗∗p < 0.001, ∗∗∗∗p < 0.0001.
Figure 2
Figure 2
Overexpression of miR-143-3p induced testicular dysfunction in vivo (A) The expression of SCYP3 (green) and TNP-1 (green) in testis of different ages were detected by immunofluorescence, scale bar, 50 μm. (B) Expression level of LHCGR in young and aging mice testis (n = 4), and statistical analyses are shown in Figure S1A. (C) Expression of steroid-related genes (Lhcgr, Star, Cyp11a1, Cyp17a1, 3b-Hsd3, 17b-Hsd3, and Gfra1) in testis of young and old mice (n = 6). (D) Schematic of miR-143-3p agomir (miR-143-ago) injection into interstitium of adult mice testes (n = 10). (E) In situ hybridization was used to detect the expression of miR-143-3p after mice were injected with miR-143-3p agomir (n = 6), scale bar, 100 μm. (F) Serum testosterone was measured by radioimmunoassay after miR-143-3p agomir treatment (n = 6). (G) Representative images of Oil Red O staining for 4 weeks after miR-143-3p agomir injections, scale bar,100 μm. Statistical analyses are shown in Figure S1E. (H) LHCGR and STRA8 protein expression in testes was analyzed by western blotting for 4 weeks after miR-143-3p agomir injections, and statistical analyses are shown in Figure S1F. (I) Detection of SYCP3 (green) in testes by immunofluorescence 4 weeks after miR-143-3p agomir injection; scale bar, 50 μm. The data are shown as the mean ± SD, unpaired t test (B), (F), and (H), one-way ANOVA with multiple comparisons tests (C), ∗∗∗p < 0.001, and ns = not significant.
Figure 3
Figure 3
miR-143 attenuated testosterone synthesis by targeting LHCGR (A) After LCs were transfected with miR-143-3p mimic (mimic-143) or NC mimic (mimic-NC) for 24 h, the complete medium was collected to detect testosterone concentration. (B) LCs transfected with miR-143-3p mimic or NC mimic for 24 h, the cells were collected to detected cAMP by ELISA. (C) Representative images of Oil Red O staining of LCs transfected with the miR-143-3p mimic or NC mimic, scale bar, 50 μm. (D) TEM images showing the formation of lipid droplet clusters in LCs overexpressing miR-143-3p, scale bar, 2 μm. (E) TargetScan predicted that miR-143-3p binds to the 3′ UTR of Lhcgr. (F) The wild-type and mutant vectors (Psi-Check 2 containing wild-type or 3 ′UTR Lhcgr mutant) were co-transfected with NC mimic or miR-143-3p mimic into HEK293T cells, and the relative renilla luciferase activity was measured and normalized to firefly luciferase activity. (G) LHCGR protein levels in LCs transfected with the miR-143-3p mimic. (H) The protein level of LHCGR in LCs transfected with control siRNA (si-NC) or Lhcgr siRNA (si-Lhcgr) for 48 h. Statistical data are shown in Figures S2A and S2B. (I) After LCs were transfected with Lhcgr siRNA for 24 h, LC culture supernatant was collected to test testosterone by RIA, and LC was collected to detected cAMP by ELISA. (J) Testosterone concentration of LCs co-treated with the FSK (5 μM) and miR-143-3p or NC mimic for 48 h. The data are presented as the mean ± SD of at least three independent experiments, unpaired t test (A), (B), (G), (H), and (I); one-way ANOVA with multiple comparisons tests (F) and (J); ∗∗p < 0.01, ∗∗∗p < 0.001, ∗∗∗∗p < 0.0001, and ns = not significant.
Figure 4
Figure 4
miR-143-3p inhibited SSCs differentiation by targeting Rarg (A) The protein expressions of STRA8, GFRα1, and SYCP3 after miR-143-3p overexpression in spermatogonial stem cells (SSCs) were detected. Statistical data are shown in Figure S5A. (B) Detection of SYCP3 (green) in SSCs transfected with the miR-143-3p mimic or NC mimic by immunofluorescence, mimic-NC = simulated negative control. Scale bars, 50 μm. (C) TargetScan predicted that miR-143-3p binds to the 3′ UTR of Rarg. The wild-type and mutant vectors (Psi-Check 2 containing wild-type or 3′UTR Rarg mutant) were co-transfected with NC mimic or miR-143-3p mimic into HEK293T cells, and the relative renilla luciferase activity was measured and normalized to firefly luciferase activity. (D) RARg protein levels in SSCs transfected with the miR-143-3p mimic. The statistics are shown in Figure S5C. (E) The protein level of RARg, STRA8, and SYCP3 in SSCs transfected with control siRNA (siRNA-NC), Rarg siRNA (siRNA-Rarg) for 48 h. The statistical data are shown in Figure S5D. (F) Protein level of RARg (green) detected by immunofluorescence in SSCs transfected with siRNA-NC and siRNA-Rarg for 48 h, scale bars, 50 μm. Fluorescence statistics are shown in Figure S5E. (G) Protein levels and the result of RARg in SSCs co-transfected with the RA and miR-143-3p or NC mimic for 48 h, β-actin was used as the internal reference. The data are shown as the mean ± SD of at least three independent experiments, unpaired t test (A), (D), and (E), one-way ANOVA with multiple comparisons tests (C) and (G). ∗∗p < 0.01, ∗∗∗∗p < 0.0001, and ns = not significant.
Figure 5
Figure 5
EVs mediate the transfer of miR-143-3p from Sertoli cells to both Leydig cells and SSCs (A) Detection of the expression of miR-143-3p (green) in testis of young and old mice, scale bars, 100 μm. (B) Quantitative reverse-transcription PCR was used to detect the expression of miR-143-3p in LCs or SSCs co-cultured with SCs in medium with or without GW4869 for 48 h. Untreated LCs and SSCs were used as the control. (C) The pri-miR-143 expression in LCs and SSCs co-cultured with SCs for 48 h were measured by quantitative reverse-transcription PCR. Untreated LCs and SSCs were used as the control. Taqman probe of pri-miR-143 was synthesized by Thermo Fisher Scientific (assay ID: Mm03306564_pri). (D) Schematic of the co-culture system of LCs or SSCs with SCs transfected with FAM-labeled miR-143-3p. SCs transfected with FAM-labeled miR-143-3p were plated in the upper chamber of transwell culture plates, and LCs or SSCs were plated in the lower chamber. (E) Representative fluorescence images of FAM-labeled miR-143-3p (green) in LCs. SCs were transfected with FAM-labeled miR-143-3p for 24 h, then co-cultured with LCs for 48 h in medium with or without GW4869, scale bars, 50 μm. (F) Transmission electron microscopy of images of EVs isolated from the culture supernatant of young SCs and old SCs, scale bars, 100 nm. (G) NTA was used to evaluate the size distribution of EVs secreted by young and old SCS. (H) Western blot analysis of EV markers (CD63 and CD81) and Calnexin in EVs secreted by adult SCs (ASCs-Ev) or old SCs (OSCs-Ev). (I) The expression level of miR-143-3p in EVs (9.0 × 109 particles) from young and old SCs determined by quantitative reverse-transcription PCR. (J) LHCGR protein levels and the statistics in LCs treated with EVs (∼3.0 × 108 particles/mL) from the young or old SCs. The presented data are the mean ± SD of at least three independent experiments, unpaired t test (E), (H), (I), and (J), one-way ANOVA with multiple comparisons tests (D). ∗p < 0.5, ∗∗∗p < 0.001, ∗∗∗∗p < 0.0001, and ns = not significant.
Figure 6
Figure 6
TGF-β triggers the transcription of miR-143 in Sertoli cells (A) In situ hybridization images show TGF-β1 expression in the testis of young and aged mice, scale bar, 100 μm. (B) The mRNA levels of pri-miR-143 and miR-143-3p in primary SCs treated with TGFβ1 (5 ng/mL) or SB431542 (2 μM) for 24 h. (C) The expression of miR-143-3p in EVs of primary SCs treated with TGF-β1 and SB431542 for 24 h. (D) miR-143-3p was detected after overexpression of Smad2 in SCs by quantitative reverse-transcription PCR. (E) and (F) Schematic diagram of potential binding sites of Smad2 in miR-143 gene and mutation in the 5′ upstream region sequence of miR-143 recombined to PGL-3 basic vector. It was used to study the promoter motif of miR-143. (G) The luciferase reporter vector and PRL-TK vector were co-transfected with Smad2 overexpression vector in HEK293T cells for 48 h. The relative luciferase activity of firefly was measured and normalized to renilla luciferase activity. Data are presented as the mean ± SD of at least three independent experiments, unpaired t test (D), one-way ANOVA with multiple comparisons tests (B), (C), and (G). ∗p < 0.5, ∗∗p < 0.01, ∗∗∗p < 0.001, ∗∗∗∗p < 0.0001.
Figure 7
Figure 7
miR-143-mediated feedback loop that directly regulates the Smad2 by targeting Smurf2 (A) The protein level of p-Smad2, Smad2, and Smad3 in SCs transfected with mimic of miR-143-3p for 48 h. (B) The protein level of p-Smad2, Smad2, and Smad3 in SCs transfected with inhibitor of miR-143-3p for 48 h. (C) Expression of Smurf2, p-Smad2, and Smad2 in SCs transfected with miR-143-3p mimic for 48 h. (D) The protein levels of Smurf2, p-Smad2, and Smad2 in SCs transfected with miR-143-3p inhibitor for 48 h. (E) and (F) TargetScan predicted that miR-143-3p binds to the 3′ UTR of Smurf2. The wild-type and mutant vectors (Psi-Check 2 containing wild-type or 3′UTR Smurf2 mutant) were co-transfected with mimic-NC or miR-143-3p mimic into HEK293T cells, and the relative renilla luciferase activity was measured and normalized to firefly luciferase activity. (G) Schematic diagram of Smurf2/Smad2/miR-143-3P loop regulation expression. Data are presented as the mean ± SD of at least three independent experiments, unpaired t test (A–D), one-way ANOVA with multiple comparisons tests (F). ∗p < 0.5, ∗∗p < 0.01, ∗∗∗p < 0.001, ∗∗∗∗p < 0.0001, and ns = not significant.
Figure 8
Figure 8
Deletion of miR-143 in SCs alleviates the male reproductive aging (A) Schematic diagram of specific conditional knockout of miR-143 in SCs performed in C57 mice. (B) Representative appearance of 20-month-old wild-type (WT) and CKO mice. (C) Serum testosterone was measured by radioimmunoassay in 20-month-old WT (n = 7) and CKO (n = 6) mice. (D) Detection of motor capacity (Rotarod and Grip strength test) in WT and CKO mice (n = 6). (E) Body weight of 20-month-old WT and CKO mice (n = 6). (F) Testis weight of WT and CKO mice (n = 6). (G) H&E staining in testes of 20-month-old WT and CKO mice (n = 6). (H) The protein expression of LHCGR, STRA8, RARg, and SYCP3 in WT and CKO mouse testes, the statistical results are shown in Figure S8C. (I) Statistical results of spermatozoa detection (sperm viability, sperm motility, sperm abnormal rate) in 20-month-old WT (n = 7) and CKO (n = 6) mice. (J) Differences in fertility between WT and CKO mice. (K) Presentation of the fertility of WT and CKO mice in co-cage mating (n = 5). Data are shown as the mean ± SD, unpaired t test (C)–(F), (H)–(J), ∗p < 0.5, ∗∗p < 0.01, ∗∗∗p < 0.001, ∗∗∗∗p < 0.0001, and ns = not significant.

Similar articles

Cited by

References

    1. Meyer R.G., Meyer-Ficca M.L. Metabolism in Male Reproductive Aging. Adv. Geriatr. Med. Res. 2021;3 - PMC - PubMed
    1. Almeida S., Rato L., Sousa M., Alves M.G., Oliveira P.F. Fertility and Sperm Quality in the Aging Male. Curr. Pharmaceut. Des. 2017;23:4429–4437. - PubMed
    1. Kaufman J.M., Lapauw B., Mahmoud A., T'Sjoen G., Huhtaniemi I.T. Aging and the Male Reproductive System. Endocr. Rev. 2019;40:906–972. - PubMed
    1. Lunenfeld B. Endocrinology of the aging male. Minerva Ginecol. 2006;58:153–170. - PubMed
    1. Zhang Q., Sun J., Huang Y., Bu S., Guo Y., Gu T., Li B., Wang C., Lai D. Human Amniotic Epithelial Cell-Derived Exosomes Restore Ovarian Function by Transferring MicroRNAs against Apoptosis. Mol. Ther. Nucleic Acids. 2019;16:407–418. - PMC - PubMed

LinkOut - more resources