. 2024 Dec;19(6):100971.
doi: 10.1016/j.ajps.2024.100971. Epub 2024 Oct 23.

A new nano approach to prevent tumor growth in the local treatment of glioblastoma: Temozolomide and rutin-loaded hybrid layered composite nanofiber

Affiliations

A new nano approach to prevent tumor growth in the local treatment of glioblastoma: Temozolomide and rutin-loaded hybrid layered composite nanofiber

Melis Ercelik et al. Asian J Pharm Sci. 2024 Dec.

Abstract

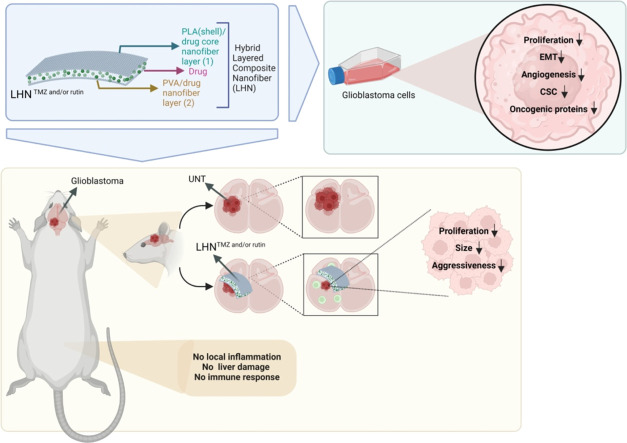
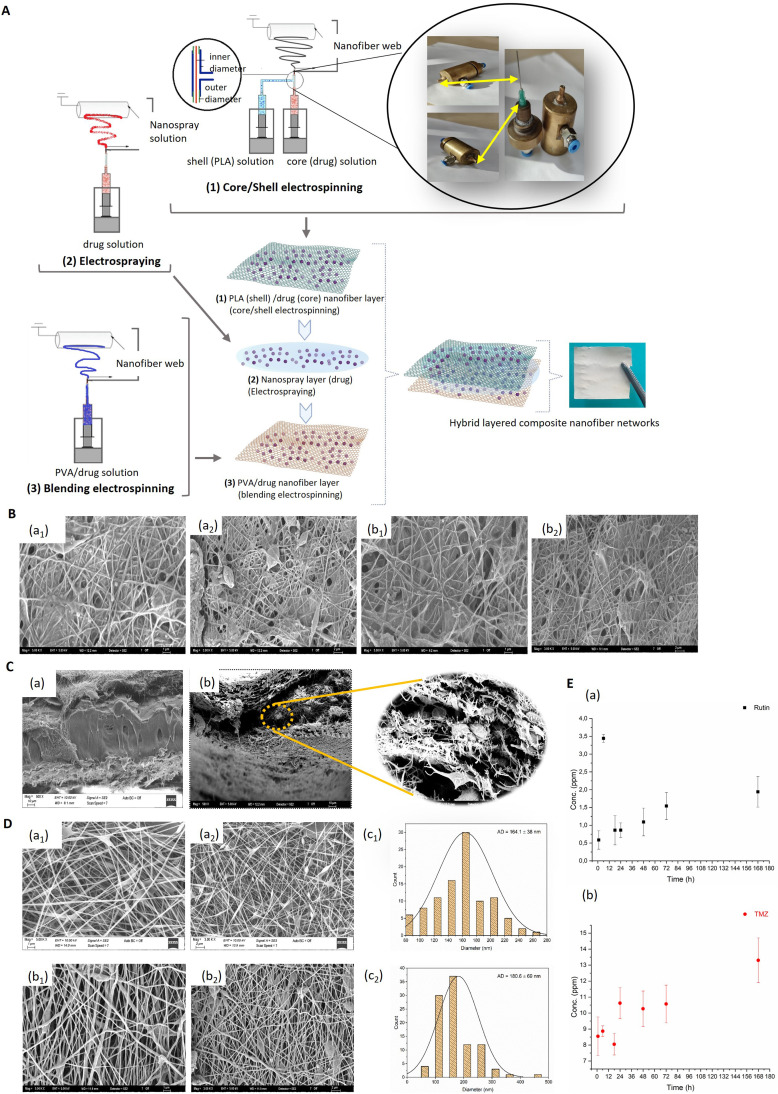
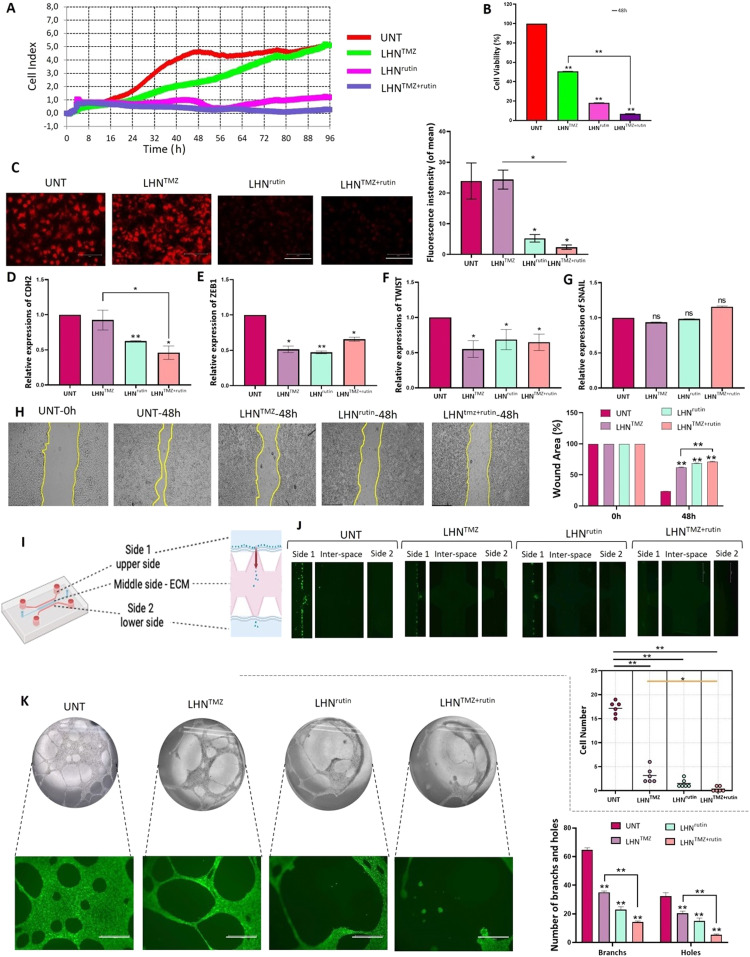
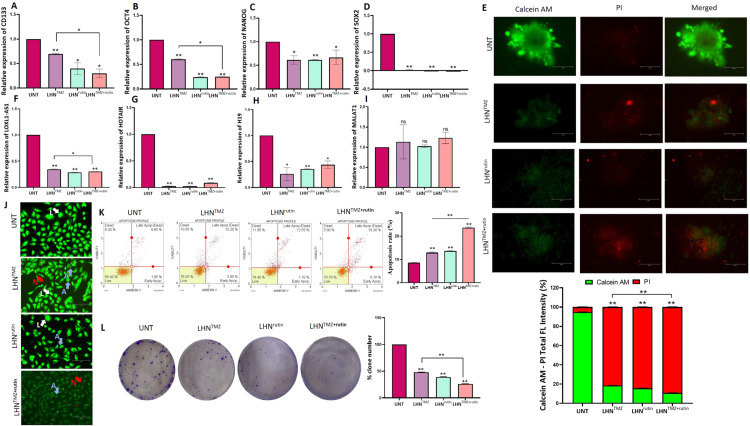
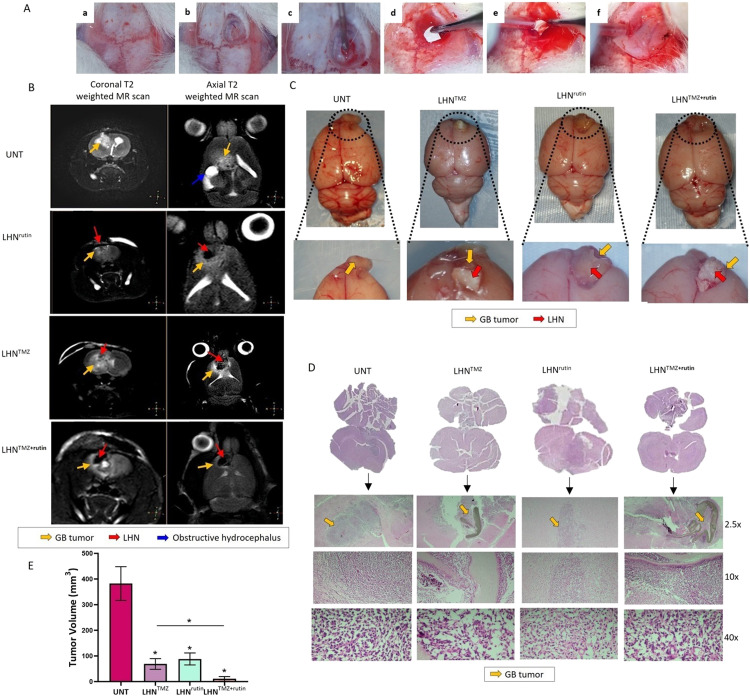
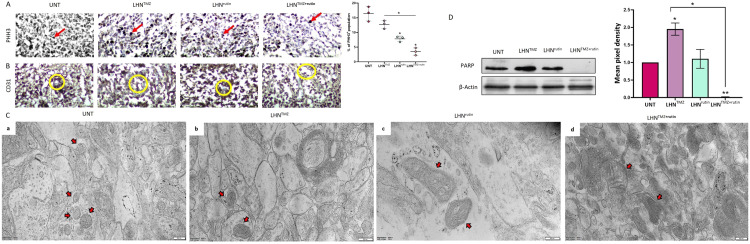
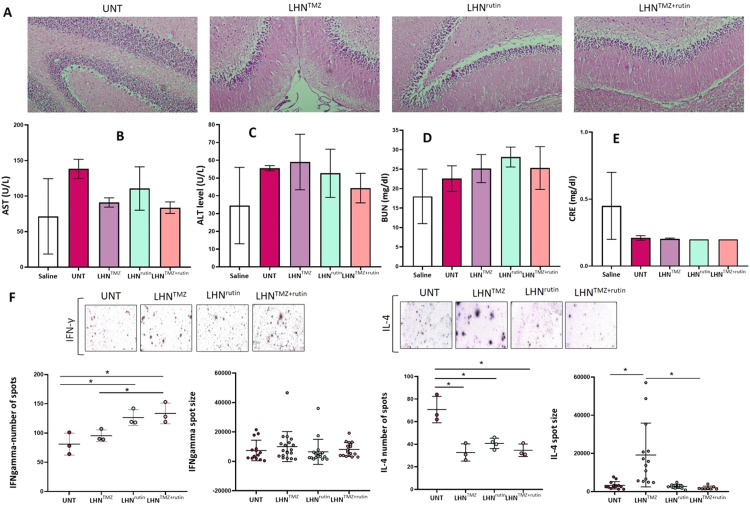
Total resection of glioblastoma (GB) tumors is nearly impossible, and systemic administration of temozolomide (TMZ) is often inadequate. This study presents a hybrid layered composite nanofiber mesh (LHN) designed for localized treatment in GB tumor bed. The LHN, consisting of polyvinyl alcohol and core-shell polylactic acid layers, was loaded with TMZ and rutin. In vitro analysis revealed that LHNTMZ and LHNrutin decelerated epithelial-mesenchymal transition and growth of stem-like cells, while the combination, LHNTMZ +rutin, significantly reduced sphere size compared to untreated and LHNTMZ-treated cells (P < 0.0001). In an orthotopic C6-induced GB rat model, LHNTMZ +rutin therapy demonstrated a more pronounced tumor-reducing effect than LHNTMZ alone. Tumor volume, assessed by magnetic resonance imaging, was significantly reduced in LHNTMZ +rutin-treated rats compared to untreated controls. Structural changes in tumor mitochondria, reduced membrane potential, and decreased PARP expression indicated the activation of apoptotic pathways in tumor cells, which was further confirmed by a reduction in PHH3, indicating decreased mitotic activity of tumor cells. Additionally, the local application of LHNs in the GB model mitigated aggressive tumor features without causing local tissue inflammation or adverse systemic effects. This was evidenced by a decrease in the angiogenesis marker CD31, the absence of inflammation or necrosis in H&E staining of the cerebellum, increased production of IFN-γ, decreased levels of interleukin-4 in splenic T cells, and lower serum AST levels. Our findings collectively indicate that LHNTMZ +rutin is a promising biocompatible model for the local treatment of GB.

Keywords: Glioblastoma; Hybrid layered composite nanofiber web; Local treatment; Rutin; Temozolomide.


Conflict of interest statement

The authors declare no conflicts of interest.

Figures

Image, graphical abstract
Graphical abstract
Fig 1
Fig. 1
(A) Schematic illustration of the fabrication of LHN webs. (B) SEM micrographs of the first layer of the LHN webs: (a1, a2) LHNrutin and (b1, b2) LHNTMZ (Magnification: 5 kX, scale: 1 µm; 3 kX, scale: 2 µm). (C) SEM cross-sectional images of the LHN webs: (a) LHNrutin and (b) LHNTMZ (Magnification: 500 kX, scale: 10 µm). (D) SEM micrographs of the third LHN webs: (a1, a2) LHNrutin and (b1, b2) LHNTMZ (Magnification: 5 kX, scale: 1 µm; 3 kX, scale: 2 µm) and distribution of fiber sizes for (c1) LHNrutin and (c2) LHN™Z. (E) Drug release profiles of the LHN webs: (a) LHNrutin and (b) LHNTMZ. LHN: layered hybrid nanofiber,.
Fig 2
Fig. 2
The effects of LHNTMZ, LHNrutin and LHNTMZ+rutin on T98 G cell growth and aggressiveness. T98 G cells were treated with 0.5 cm2 of LHNs encapsulated with IC50 doses of TMZ (1,000 µM), rutin (142.2 µM) and their combination. (A) The effects of LHNTMZ, LHNrutin, and LHNTMZ+rutin treatments on real-time cell proliferation of T98 G cells over 96 h (B) The T98 G cell viability percentage after 48-h treatment with LHNTMZ, LHNrutin and LHNTMZ+rutin (**P < 0.001). (C) The effect of LHNTMZ, LHNrutin and LHNTMZ+rutin on Δψm in T98 G cells. TMRE accumulation of cells (red color) is a sign of high membrane potential. Depolarized mitochondria result in reduced TMRE accumulation. (D) RNA expression of EMT-signaling gene, CDH2. (E-G) RNA expression of EMT regulator transcription factors ZEB1, TWIST and SNAIL. For D-G: Ct values were normalized to the Ct of GAPDH. (*P < 0.05, **P < 0.0001). (H) The representative images of the findings on the scratch wound healing assay. 90 % confluent cell monolayer scratched and recorded as the time 0. The change in the size of the wounded area was recorded after 48-h of treatment with LHNTMZ, LHNrutin or LHNTMZ+rutin. Scale bar: 595.2 µm. (I) The schema of the microfluidic invasion model on an IC—Chip. (J) The movement of GFP-expressing T98 G cells from side 1 (upper side) to side 2 (lower side) and their invasion to the EMC at the interspace was observed by fluorescent microscopy over 48 h 10 % FBS was used as the chemoattractant. Scale bar: 750 µm. *P < 0.05, **P < 0.0001. (K) The effect of the TMZ, rutin and TMZ+rutin release of LHN on tube forming of HUVEC cells. Calcein AM confirmed the viability of HUVEC cells of the capillary structure during decomposition by green color. Scale bar: 750 µm. **P < 0.0001 CDH-2: N-cadherin, ZEB-1: zinc finger E-box binding homeobox 1, TWIST-2: Twist-related protein, SNAIL: zinc finger protein SNAI1. The number of biological replicates was A-H:3, J:6 and K:5. All values were expressed as the mean ± SD (standard deviation) of the biological replicates. All P values were presented for comparison with the UNT samples.
Fig 3
Fig. 3
Effects of LHNTMZ, LHNrutin, and LHNTMZ+rutin on GSC phenotype of T98 G cells. The RNA expression of (A) CD133, (B) OCT4, (C) NANOG and (D) SOX2. (E) 3D-spheroid formation. T98 G cell spheres were formed in a 96-well, round-bottom, ultra-low attachment plate for 3 d Calcein-AM and PI staining identified the vitality of the spheres. Calcein-AM staining (green) indicates metabolically viable or proliferative regions, whereas PI staining (red) indicates the sites of necrosis or death. ImageJ software measured the size of captured tumor spheres and the ratio of the diameter of live/dead area. Scalebar: 150 µm. The RNA expression of (F) LOXL1-AS1, (G) HOTAIR, (H) H19 and (I) MALAT1. (J) Viability of T98 G cells after treatment with loaded LHNs by AO/PI staining. In morphological analysis, green cells with granular nuclei on one side showed apoptosis. In contrast, a circular nucleus evenly distributed in the center of the cell indicated that a cell is in interphase. Dark red cells with a vague rim indicated necrosis. Color-coded arrows indicate: live cells in white, early apoptosis in blue, late apoptosis in orange, and necrosis in red. (K) Analysis of apoptotic T98 G cells using Annexin V assay after loaded LHN's treatments. (L) The colony formation of T98 G cells after LHNTMZ, LHNrutin, and LHNTMZ+rutin treatments. All values represent mean ± SD (n = 3). *P < 0.05, **P < 0.0001. CSC: Cancer Stem Cell, CD133: Prominin-1, OCT4: POU5F1, NANOG: Nanog Homeobox, SOX2: SRY-box 2, L: alive cells, A: apoptosis, N: necrosis.
Fig 4
Fig. 4
(A) A heatmap depicting differentially expressed proteins resulting from the label-free proteomics analysis of treatment groups. The clustering was generated using the average-linkage method along with Euclidean distance, utilizing the Heatmapper online tool (http://www.heatmapper.ca/expression/). (B) Venn diagram of biological process and cellular localization of the differentially up- and down-regulated proteins. (C) Venn diagram of up- and down-regulated proteins and their biological process. Analysis of the down/up-regulated mitochondria-associated proteins (D), ER-Golgi-associated proteins (E), angiogenesis-associated proteins (F), and cell differentiation-associated proteins (G) interactions created using the STRING analysis tool. GTP: Guanosine-5′-triphosphate.
Fig 5
Fig. 5
The effect of LHNTMZ, LHNrutin and LHNTMZ+rutin on GB tumor growth. (A) Generation of an allograft GB model and insertion of LHN webs. (a) A midline skin incision exposed the right frontal intracranial surfaces. (b) The dura was opened following a 5 mm x 5 mm right frontal craniectomy. (c) Injected 2.5 × 10⁶/10 µl of C6 cell into 2 mm lateral and anterior to bregma. (d, e) LHN webs were inserted into the resected area. (f) A bone wax was used to cover the resection area. (B) Coronal T2 weighted and axial T2 weighted MR scans on Day 11. UNT GB rats: Tumor lesion causing infiltrative edema in the right frontal deep white matter (yellow arrow) and hydrocephalus secondary to compression (blue arrow). After LHNTMZ: a slightly hyperintense infiltrative tumoral lesion (yellow arrow) in the right frontal region extends transcallosally from the anterior part of the corpus callosum, with the LHN network observed at its center (red arrow). After LHNrutin: In the deep white matter of the right frontal lobe, tumor lesion (yellow arrow) and a prominent hypointense large-sized nanofiber (red arrow) are observed. The lesion extends transcallosally to the opposite hemisphere, exerting pressure on the LHN network. After LHNTMZ+rutin: Hypointense LHN (red arrow) in the right frontal area and a small tumoral lesion of a millimetric thickness (yellow arrow) surrounding it. (C) The appearance of the resected brain and the tumor at the end of the experiment. (D) H&E staining of brain sections on Day 11. (E) The volume of the GB tumors. *P < 0.05.
Fig 6
Fig. 6
The effects of LHNTMZ, LHNrutin and LHNTMZ+rutin on GB tumor in pathological examination (A) IHC staining of PHH3 indicates the mitotic and proliferation capacity (staining areas are shown with red arrows). (B) IHC staining of CD31 shows the intratumoral microvessel density (staining areas are shown with yellow circles). (C) TEM images of GB tumor cells focusing on the structure of mitochondria (red arrows). (D) Immunoblotting of PARP protein expression in GB tumors. All values were expressed as the biological replicates' mean± SD. *P < 0.05, **P < 0.0001.
Fig 7
Fig. 7
The biocompatibility of LHNTMZ, LHNrutin and LHNTMZ+rutin. (A) H&E staining of the cerebellum after LHNTMZ, LHNrutin and LHNTMZ+rutin application. The peripheral blood serum (B) AST, (C) ALT, (D) BUN and (E) CRE. (F) Analysis of IFN-γ and IL-4 levels at splenic cells by ELISPOT assays. Spot numbers were normalized according to the background seen in PBS. The experiments were performed in three biological replicates. All data are presented as mean ± SE; *P < 0.05.

References

    1. Iacob G., Dinca E.B. Current data and strategy in glioblastoma multiforme. J Med Life. 2009;2:386–393. - PMC - PubMed
    1. Templeton A., Hofer S., Töpfer M., Sommacal A., Fretz C., Cerny T., et al. Extraneural spread of glioblastoma–report of two cases. Onkologie. 2008;31(4):192–194. - PubMed
    1. Castañeda C.A., Casavilca S., Orrego E., García-Corrochano P., Deza P., Heinike H., et al. Glioblastoma: análisis molecular y sus implicancias clínicas [Glioblastoma: molecular analysis and its clinical implications] Rev Peru Med Exp Salud Publica. 2015;32(2):316–325. - PubMed
    1. Chacko A.M., Li C., Pryma D.A., Brem S., Coukos G., Muzykantov V. Targeted delivery of antibody-based therapeutic and imaging agents to CNS tumors: crossing the blood-brain barrier divide. Expert Opin Drug Deliv. 2013;10(7):907–926. - PMC - PubMed
    1. Juillerat-Jeanneret L. The targeted delivery of cancer drugs across the blood-brain barrier: chemical modifications of drugs or drug-nanoparticles? Drug Discov Today. 2008;13:1099–1106. - PubMed

LinkOut - more resources