. 2024 Nov 21:15:1426869.
doi: 10.3389/fimmu.2024.1426869. eCollection 2024.

PTX3 is expressed in terminal lymphatics and shapes their organization and function

Affiliations

PTX3 is expressed in terminal lymphatics and shapes their organization and function

Andrea Doni et al. Front Immunol. .

Abstract

Introduction: The lymphatic system is a multifaceted regulator of tissue homeostasis and an integral part of immune responses. Previous studies had shown that subsets of lymphatic endothelial cells (LEC) express PTX3, an essential component of humoral innate immunity and tissue homeostasis.

Methods: In the present study using whole-mount imaging and image-based morphometric quantifications, Ptx3-targeted mice and in vivo functional analysis, we investigated the involvement of PTX3 in shaping and function of the lymphatic vasculature.

Results: We found that PTX3 is localized in the extracellular matrix (ECM) surrounding human and murine lymphatic vessels (LV). In murine tissues, PTX3 was localized in the ECM close to LV terminals and sprouting. Ptx3-deficient mice showed LV abnormalities in the colon submucosa and diaphragm, including a disorganized pattern and hyperplasia of initial LV capillaries associated with altered distribution of tight junction-associated molecules. Mice with LEC-restricted PTX3 gene inactivation showed morphological and organization abnormalities similar to those observed in Ptx3-deficient animals. Ptx3-deficient mice showed defective fluid drainage from footpads and defective dendritic cell (DC) trafficking.

Discussion: Thus, PTX3 is strategically localized in the ECM of specialized LV, playing an essential role in their structural organization and immunological function.

Keywords: extracellular matrix; innate immunity; lymphatic system; pattern recognition molecule; tissue homeostasis.


Conflict of interest statement

The authors declare that the research was conducted in the absence of any commercial or financial relationships that could be construed as a potential conflict of interest.

Figures

Figure 1
Figure 1
Localization of PTX3 in murine lymphatic vessels. (A–H) Whole mount immunofluorescence of the diaphragm, intestine, and ear skin analyzed in WT and Ptx3−/− mice. (A) Maximum intensity projection (MIP) of a mosaic image showing LYVE-1+ (white) LV distribution in whole mouse diaphragm. LVs extended radially and in parallel from thoracic wall to central tendon forming a reticular arrangement. Central tendon contained LYVE-1+ irregularly shaped lymphatic lacunae connected with mesothelium. Scale bar = 1 mm. (B–D) Close-up images of the yellow dashed areas I, II, and III of (A) analyzed after staining for LYVE-1 (white), CD31 (red), and PTX3 (green). (B) Close-up image of (A) showing the muscle–tendon interface (I); inset, Ptx3−/− diaphragm as control; (C) close-up images of (A) showing tendon (II); (D) close-up images of (A) showing peripheral muscle (III). N = 8 (WT) and 6 (Ptx3−/− ) mice on 129/SV background; similar results were obtained in C57BL/6J mice (n = 6/genotype). (B, C, right) 3D isosurface rendering of confocal z-stacks of correspondent blue dashed area of (B, C). Blue arrowheads indicate PTX3 around blind-ended LVs protruding toward central tendon (B, I) and around lacunae (C, II). B, C, left, D, scale bar = 500 µm; B, C, right, scale bar = 100 µm. (E) MIP image of representative of PTX3+ ECM around LYVE-1+ LEC sprouting in diaphragm. Scale bar = 10 µm. (F–H) MIP images of LYVE-1+ (white) LVs and PTX3 (green) localization in lymphatic plexus of distal colon laminae (F), proximal transverse intestine submucosa (G), and distal colon submucosa (H). Insets in F–H, Ptx3−/− mice as control. N = 8 (WT) and 6 (Ptx3−/− ) mice on 129/SV background; similar results were obtained in C57BL/6J mice (n = 6/genotype). Blue arrowheads indicate PTX3 associated with LYVE-1+ terminal LV capillaries in submucosa of proximal transverse (G) and distal colon (H). (H, right) close-up MIP fluorescence image of blind-ended terminals in colon submucosa (inset) and 3D isosurface reconstruction of fluorescence signals in the blue dashed area. Scale bar = 500 µm (F, G, H, left), 10 µm (H, right), 100 µm (H, right, close-up). (I, J) Examples of MIP image of PTX3+ (green) ECM around LYVE-1+ (white) LVs (I) and LEC sprouting (L) in ear skin observed in the inner side. Blue arrowheads indicate PTX3 around blind-ended LVs (I) and cell sprouting (J). (I, J, middle) Extracted signals of LYVE-1 and PTX3. (I, J, right) 3D isosurface rendering of z-stack images of correspondent blue dashed area of I (left) and J (left) (n = 4 WT, 3–5 z-stack confocal images for each). (I, inset) Ptx3−/− skin (n = 3) as control. Scale bar = 100 µm (I, J, left and I middle) and 10 µm (J, middle and I, J, right).
Figure 2
Figure 2
Localization of PTX3 in human lymphatic vessels. (A, B) Classic immunohistochemistry and multifluorescence microscopy analysis of normal human skin samples. (A) Images are representatives of n = 3 independent donors. Left, PTX3 (DAB, brown) localization at ECM around LVs (black arrowheads) of the dermis counterstained with H&E. Blood vessels (white arrowheads) resulted negative to PTX3 staining. Right, acquisitions at different magnification of LVs (black arrowheads) and blood vessels (white arrowheads). Scale bar = 100 µm. (B) Immunofluorescence analysis on normal skin confirming PTX3 positivity in the perilymphatic interstitium while blood vessels are negative. PTX3 staining is in green, LECs are identified by positivity with human D2-40 (upper right panel), and vascular ECs are recognized by positivity to Factor VIII (lower right panel), both in red. DAPI is used for nuclear staining (blue). Scale bar = 10 µm.
Figure 3
Figure 3
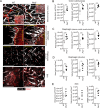
PTX3 deficiency is associated with morphometric alterations of terminal lymphatic capillaries. (A) Upper panel, MIP of confocal z-stack images showing CD31+ (red) blood and LYVE-1+ (white) lymphatic vasculature in colon submucosa and lamina (inset) of WT (n = 5) and Ptx3−/− (n = 5) mice on 129/SV background. Yellow arrowheads indicate blind-ended terminal LV capillaries; blue arrowheads, disorganized LV pattern and anastomosis in Ptx3−/− mice. Middle panels, MIP of confocal z-stack images of diaphragm at the muscle–tendon interface (middle; n = 5 WT and Ptx3−/− mice) and tendon (lower; n = 5 WT and Ptx3−/− mice). Yellow dashed line traces the demarcation between sterno-costal muscle and tendon. Lower panel, MIP of confocal z-stack images showing LVs of the ear skin (n = 5 WT; n = 4 Ptx3−/− mice). Scale bar = 800 µm. (B–E) Quantification of (A) as expression of area (µm2/mm2), volume (µm3/mm2), and length (µm/mm2) of LYVE-1+ LVs in colon submucosa (B), diaphragm at the muscle–tendon interface (C), diaphragm tendon (D), and skin (E). Each spot refers to a mean of n = 3–7 (B), n = 2–6 (C), n = 3–5 (D), or n = 1–6 (E) 3D reconstructed z-stack images of 1.65 mm2 of each single mouse and expression of mean±SE per mm2. *p < 0.05; **p < 0.01 (two-tailed, Mann–Whitney test).
Figure 4
Figure 4
PTX3 deficiency is associated with alterations in LEC junctions at initial lymphatics. (A) Representative MIP images of z-stack images referring two mice/genotype of the distribution of CD31 (green) and CD144 (red) on LYVE-1+ (white) terminal LVs in colon submucosa are shown. From left to right for each mouse, the following are shown: MIP images of the contribution of fluorescence signals; extracted fluorescence signal related to LEC junctions (CD31 and CD144); 3D isosurface rendering aimed at reconstituting LEC junction distribution; relative close-up of the area delimited by white dotted line showing junction distribution on single LECs. Scale bar = 100 µm (left) and 10 µm (right). (B) CD144+ signal extracted from the corresponding MIP images of (A) and used for the quantification of zipper vs. button junctions (left). Quantification of zipper vs. button junctions in WT (n = 4) and Ptx3−/− (n = 5) mice on 129/SV background (right). Each spot refers to the mean ± SE of two to three images of 0.32 mm2 per mouse colon and results are expressed as % of LECs with button (discontinuous staining of CD144 for each LEC) junctions on total LYVE-1+ LECs (87.48 ± 0.83% vs. 93.25 ± 1.09%, Ptx3−/− vs. WT; *p < 0.05; two-tailed, Mann–Whitney test). (C) Structural alterations in the perilymphatic ECM of Ptx3-deficient mice. EM micrographs of terminal LVs forming stomata in the diaphragm of WT (left; n = 3) and Ptx3−/− (right; n = 3) mice. In WT mice, organization of the different ECM components around stomata (arrowheads) and in peri-stomata areas appears as an ordinate alternation of elastic (El) and collagen (COL) fibers, and pericellular spaces (outlined in yellow) containing non-fibrillar ECM. Ptx3-deficient mice showed a reduction in HA-rich pericellular ECM (outlined in yellow). Left panels, ×9,000 magnification; right panels, ×36,000 magnification of the blue dashed areas. El, elastic fibers; COL, collagen fibers; LEC, lymphatic EC; M, mesothelial cells.
Figure 5
Figure 5
Deficiency in stromal PTX3 is responsible of the morphometric alterations of terminal lymphatic capillaries. (A) MIP of z-stack images showing expression and localization of PTX3 (green) in LYVE-1+ (white) LVs of WT and Ptx3−/− mice receiving WT and Ptx3−/− BM, respectively (n = 3–4 mice/group; C57BL/6J). Upper panel, colon submucosa. Yellow arrowheads indicate blind-ended terminal LV capillaries; blue arrowheads, alterations in blind ends of LVs in mice deficient in PTX3 in the stroma. Lower panel, z-stack images of the diaphragm at the muscle–tendon interface of different chimeric groups. Scale bar = 800 µm. (B) Quantification of PTX3+ voxels around LYVE-1+ LVs after 3D rendering. Results are expressed as mean ± SE of PTX3+ voxels/mm3. Each spot corresponds to quantification of a single MIP image of 1.20 mm2 [(colon: n = 34 BM WT/WT, n = 21 BM Ptx3−/− /WT, n = 23 BM WT/Ptx3−/− , n = 15 BM Ptx3−/− /Ptx3−/− ; diaphragm: n = 45 BM WT/WT, n = 46 BM Ptx3−/− /WT, n = 24 BM WT/Ptx3−/− , n = 29 BM Ptx3−/− /Ptx3−/− ) n of images] of n = 3 (BM WT/Ptx3−/− ) and 4 (BM WT/WT; BM Ptx3−/− /WT; BM Ptx3−/− /Ptx3−/− ) mice/group. **p < 0.01; ****p < 0.0005 (two-tailed; unpaired t-test). (C–E) Morphometric analysis of (A) after 3D isosurface rendering of z-stack images expressed as area (µm2/mm2), volume (µm3/mm2), and length (µm/mm2) of LYVE-1+ LVs in colon submucosa (C), diaphragm at the muscle–tendon interface (D), and diaphragm tendon (E). Each spot refers to the mean of n = 4–25 (C), n = 2–9 (D), or n = 3–12 (E) 3D reconstructed z-stack images of 1.2 mm2 of each single mouse and expressed as mean ± SE per mm2. *p < 0.05 (two-tailed, Mann–Whitney test).
Figure 6
Figure 6
LEC-restricted PTX3 deficiency recapitulates the morphometric alterations at terminal lymphatic capillaries. (A) MIP of z-stack images showing the expression and localization of PTX3 (green) in LYVE-1+ (white) LVs of Prox-1-Cre-/Ptx3flox/flox and Prox-1-Cre+/Ptx3flox/flox mice (n = 4/genotype; C57BL/6J). Upper panel, colon submucosa; lower panel, diaphragm at the tendon–muscle interface. Yellow arrowheads indicate blind-ended terminal LV capillaries; blue arrowheads, morphometric alterations in blind ends of LVs of Prox-1-Cre+/Ptx3flox/flox mice. Scale bar = 800 µm. (B, C) Morphometric analyses after 3D rendering of z-stack images of area (µm2/mm2), volume (µm3/mm2), and length (µm/mm2) of LYVE-1+ LVs in colon submucosa (B) and diaphragm at the muscle–tendon interface (C). Each spot refers to the mean ± SE of 2–10 (colon submucosa) or 1–12 (diaphragm) MIP images of 1.20 mm2 per mouse tissue and presented per mm2. *p < 0.05 (two-tailed, Mann–Whitney test).
Figure 7
Figure 7
Impaired fluid drainage and DC trafficking. (A) Lymphatic fluid drainage. Evans Blue (EB) dye was injected into the foot pads of WT and Ptx3-deficient animals (129/SV) and drained EB was quantified at different time points in serum (left), popliteal (middle), and iliac (right) LNs. Each spot corresponds to a single animal and refers to the mean EB in the blood (38.22 ± 7.02 vs. 50.42 ± 5.02 µg/mL, Ptx3−/− vs. WT), or draining LN (at 15 min, 0.18 ± 0.04 vs. 0.34 ± 0.05 µg/pLN; 0.09 ± 0.02 vs. 0.23 ± 0.05 µg/iLN; at 30 min, 0.24 ± 0.05 vs. 0.42 ± 0.06 µg/pLN). Results refer to one independent experiment (15 and 60 min) or two pooled experiments (30 min) out of two (15 min) or three (30 min) performed. *p < 0.05 (two-tailed; unpaired t-test). (B) DC trafficking. Mice were painted with 0.2 mL of a 5 mg/mL FITC solution and inguinal LNs collected and disaggregated at indicated time points. LN cells were counted and analyzed by FACS. Results are reported as the number of CD11c and FITC double-positive DCs per LN (6 h, 1.13 ± 0.12 × 10⁴ vs. 2.37±0.37 × 10⁴ CD11c+FITC+ DCs/LN, Ptx3−/− vs. WT; 12 h, 2.03 ± 0.24 × 10⁴ vs. 2.62 ± 0.33 × 10⁴ CD11c+FITC+ DCs/LN, Ptx3−/− LNs). Each spot corresponds to a single LN. N = 12 mice/group at 6 and 12 h Two experiments pooled per time point out of four performed on C57BL/6J genetic background or four (6 h) and three (12 h) performed in 129/SV mice with similar results. **p < 0.01; ****p < 0.0005 (two-tailed; unpaired t-test).
Figure 8
Figure 8
Schematic representation of PTX3 function in the organization and biology of LVs. PTX3 localizes in the ECM surrounding lymphatic terminals and LEC sprouting and is essential in the organization and function of the lymphatic system.

References

    1. Oliver G, Kipnis J, Randolph GJ, Harvey NL. The lymphatic vasculature in the 21(st) century: novel functional roles in homeostasis and disease. Cell. (2020) 182:270–96. doi: 10.1016/j.cell.2020.06.039 - DOI - PMC - PubMed
    1. Angeli V, Lim HY. Biomechanical control of lymphatic vessel physiology and functions. Cell Mol Immunol. (2023) 20:1051–62. doi: 10.1038/s41423-023-01042-9 - DOI - PMC - PubMed
    1. Maisel K, Sasso MS, Potin L, Swartz MA. Exploiting lymphatic vessels for immunomodulation: Rationale, opportunities, and challenges. Adv Drug Delivery Rev. (2017) 114:43–59. doi: 10.1016/j.addr.2017.07.005 - DOI - PMC - PubMed
    1. Fujimoto N, He Y, D’Addio M, Tacconi C, Detmar M, Dieterich LC. Single-cell mapping reveals new markers and functions of lymphatic endothelial cells in lymph nodes. PloS Biol. (2020) 18:e3000704. doi: 10.1371/journal.pbio.3000704 - DOI - PMC - PubMed
    1. Jalkanen S, Salmi M. Lymphatic endothelial cells of the lymph node. Nat Rev Immunol. (2020) 20:566–78. doi: 10.1038/s41577-020-0281-x - DOI - PubMed

LinkOut - more resources