

Variations in the milk lipidomic profile of lactating dairy cows fed the diets containing alfalfa hay versus alfalfa silage
- PMID: 39640557
- PMCID: PMC11617287
- DOI: 10.1016/j.aninu.2024.06.009
Variations in the milk lipidomic profile of lactating dairy cows fed the diets containing alfalfa hay versus alfalfa silage
Abstract
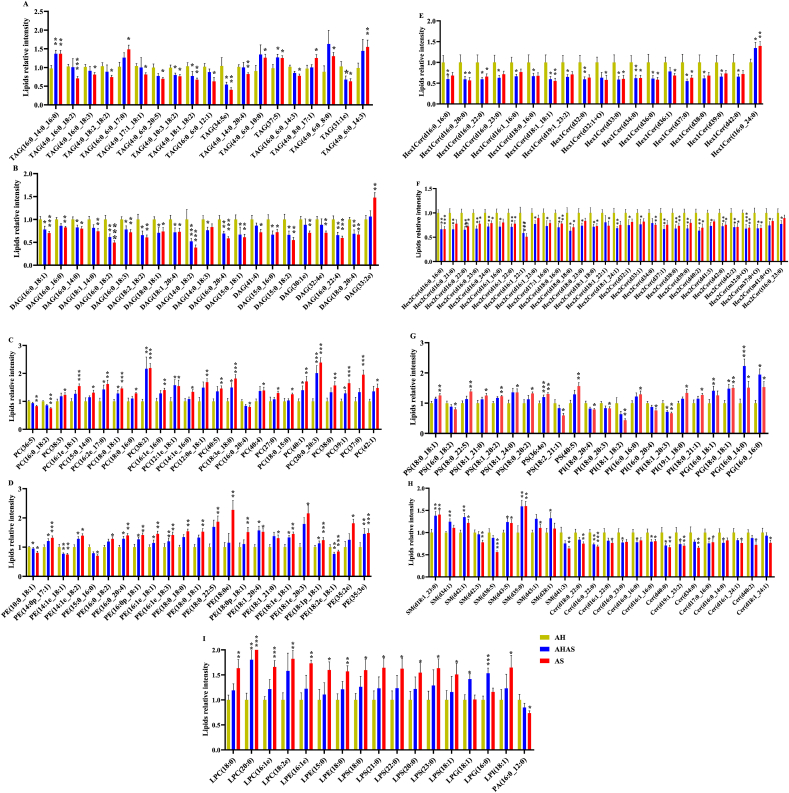
Alfalfa is primarily stored as silage or hay in livestock production. Previous research has shown that the storage method of grass significantly influences milk composition. This study aimed to investigate milk production performance and lipid composition in dairy cows fed diets consisting of alfalfa hay or alfalfa silage as roughage. Forty-two mid-lactation Holstein dairy cows were selected and randomly divided into three groups, each receiving a total mixed ration consisting of alfalfa hay (AH), 50% alfalfa silage + 50% alfalfa hay (AHAS), or alfalfa silage (AS). The results showed that milk fat content (P = 0.049) and milk fat yield (P < 0.001) were significantly higher in the AH and AHAS groups compared to the AH group. With increased supplementation of alfalfa silage in the diet, ω-3 polyunsaturated fatty acid content increased significantly (P < 0.001), while ω-6 polyunsaturated fatty acid content (P = 0.007) and the ratio of ω-6 to ω-3 polyunsaturated fatty acids decreased (P < 0.001). The contents of sphingomyelins, phosphatidylserines, phosphatidylethanolamines, and phosphatidylglycerols in the AHAS and AS samples were higher than in the AH samples, although the differences were not statistically significant. Additionally, the content of phosphatidylcholines was significantly higher in the AS group compared to the AH group (P = 0.032). In conclusion, feeding dairy cows a diet consisting of alfalfa silage can increase the major phospholipid content and polyunsaturated fatty acid composition in raw milk, which is more conducive to human health. These findings provide valuable insights into the benefits of alfalfa silage for dairy cows.
Keywords: Alfalfa hay; Alfalfa silage; Dairy cow; Fatty acid; Lipidomic profile; Milk fat.
© 2024 The Authors.
Conflict of interest statement
We declare that we have no financial and personal relationships with other people or organizations that can inappropriately influence our work, and there is no professional or other personal interest of any nature or kind in any product, service and/or company that could be construed as influencing the content of this paper.
Figures


Similar articles
-
Effect of substituting wet corn gluten feed and corn stover for alfalfa hay in total mixed ration silage on lactation performance in dairy cows.Animal. 2021 Mar;15(3):100013. doi: 10.1016/j.animal.2020.100013. Epub 2021 Feb 6. Animal. 2021. PMID: 33558089
-
Dried distillers grains plus solubles with corn silage or alfalfa hay as the primary forage source in dairy cow diets.J Dairy Sci. 2007 Dec;90(12):5587-99. doi: 10.3168/jds.2006-753. J Dairy Sci. 2007. PMID: 18024751
-
Feeding lower-protein diets based on red clover and grass or alfalfa and corn silage does not affect milk production but improves nitrogen use efficiency in dairy cows.J Dairy Sci. 2023 Mar;106(3):1773-1789. doi: 10.3168/jds.2022-22607. Epub 2023 Jan 27. J Dairy Sci. 2023. PMID: 36710192
-
Corn silage hybrid type and quality of alfalfa hay affect dietary nitrogen utilization by early lactating dairy cows.J Dairy Sci. 2013 Oct;96(10):6564-76. doi: 10.3168/jds.2013-6689. Epub 2013 Aug 16. J Dairy Sci. 2013. PMID: 23958019 Clinical Trial.
-
Interaction of molasses and monensin in alfalfa hay- or corn silage-based diets on rumen fermentation, total tract digestibility, and milk production by Holstein cows.J Dairy Sci. 2009 Jan;92(1):270-85. doi: 10.3168/jds.2008-1432. J Dairy Sci. 2009. PMID: 19109286
Cited by
-
The Effect of Silage Microbial Inoculants on the Silage Quality of WL358HQ Alfalfa.Microorganisms. 2025 Apr 29;13(5):1026. doi: 10.3390/microorganisms13051026. Microorganisms. 2025. PMID: 40431199 Free PMC article.
-
The Role of Dairy in Human Nutrition: Myths and Realities.Nutrients. 2025 Feb 11;17(4):646. doi: 10.3390/nu17040646. Nutrients. 2025. PMID: 40004974 Free PMC article. Review.
-
Lipidomics profile shows differences of polar lipids between donkey and bovine colostrum: a comparative study.Food Chem X. 2025 Jul 22;29:102798. doi: 10.1016/j.fochx.2025.102798. eCollection 2025 Jul. Food Chem X. 2025. PMID: 40747490 Free PMC article.
References
-
- AOAC International . 20th ed. AOAC International; 2016. Official methods of analysis.
-
- Argov-Argaman N., Cohen-Zinder M., Leibovich H., Yishay M., Eitam H., Agmon R., Hadaya O., Mesilati-Stahy R., Miron J., Shabtay A. Dietary pomegranate peel improves milk quality of lactating ewes: emphasis on milk fat globule membrane properties and antioxidative traits. Food Chem. 2020;313 doi: 10.1016/j.foodchem.2019.125822. - DOI - PubMed
LinkOut - more resources
Full Text Sources
Research Materials
