. 2024 Oct 11;10(20):e39206.
doi: 10.1016/j.heliyon.2024.e39206. eCollection 2024 Oct 30.

Plasma C24:0 ceramide impairs adipose tissue remodeling and promotes liver steatosis and glucose imbalance in offspring of rats

Affiliations

Plasma C24:0 ceramide impairs adipose tissue remodeling and promotes liver steatosis and glucose imbalance in offspring of rats

Alberto Camacho-Morales et al. Heliyon. .

Abstract

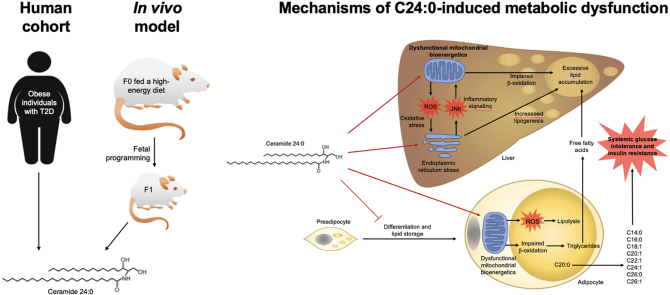
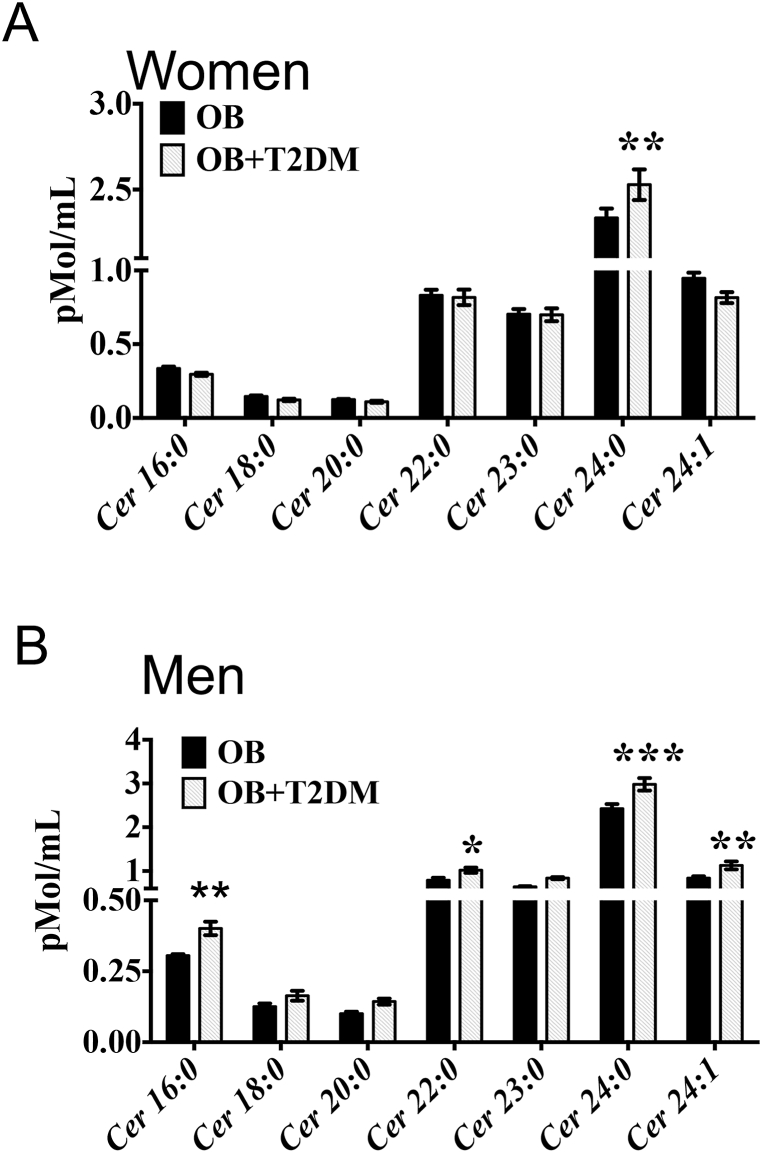
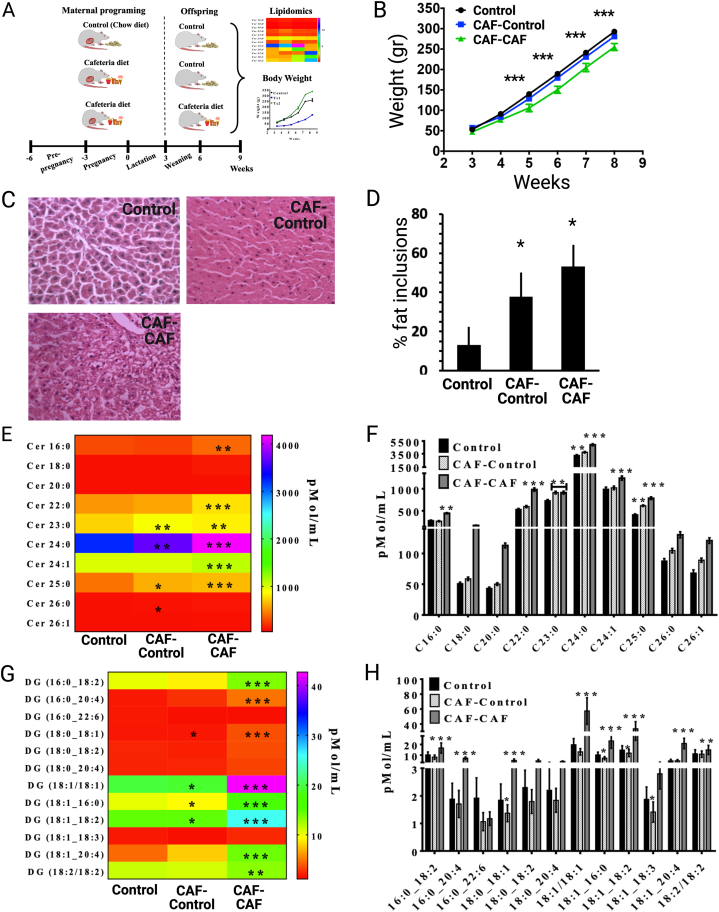
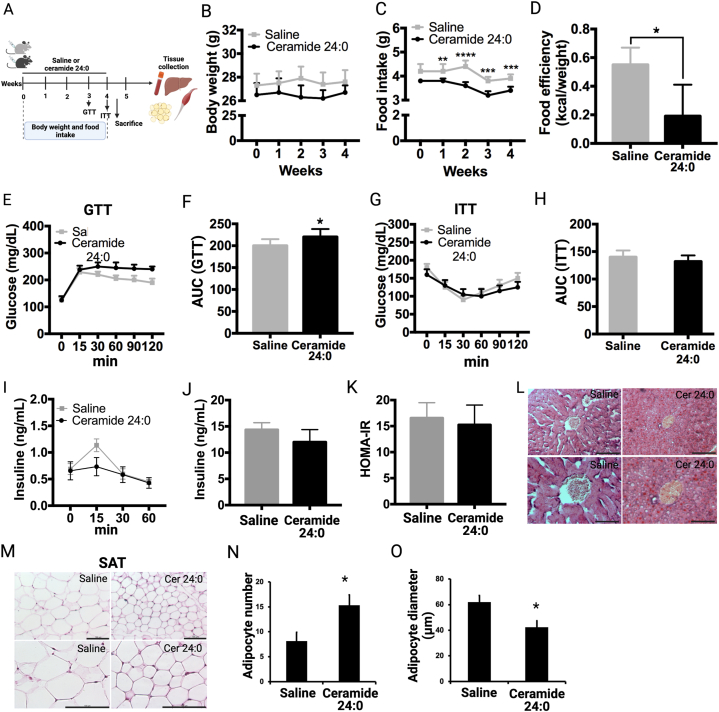
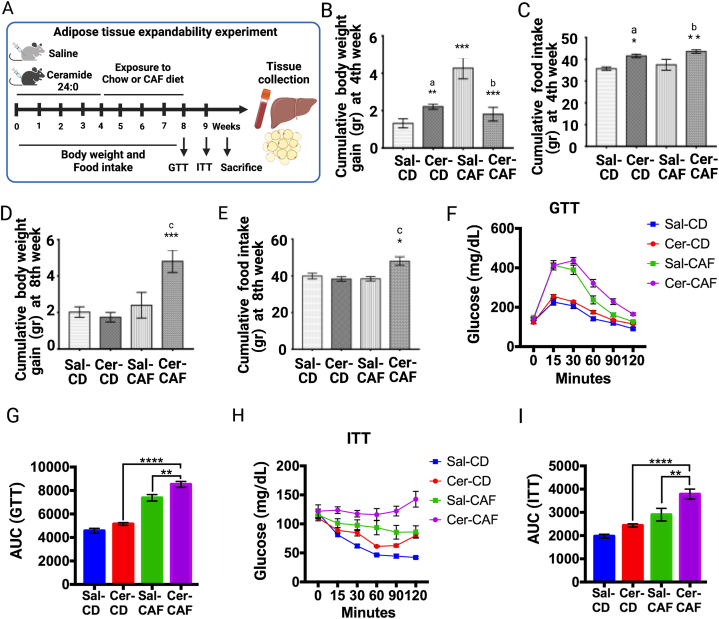
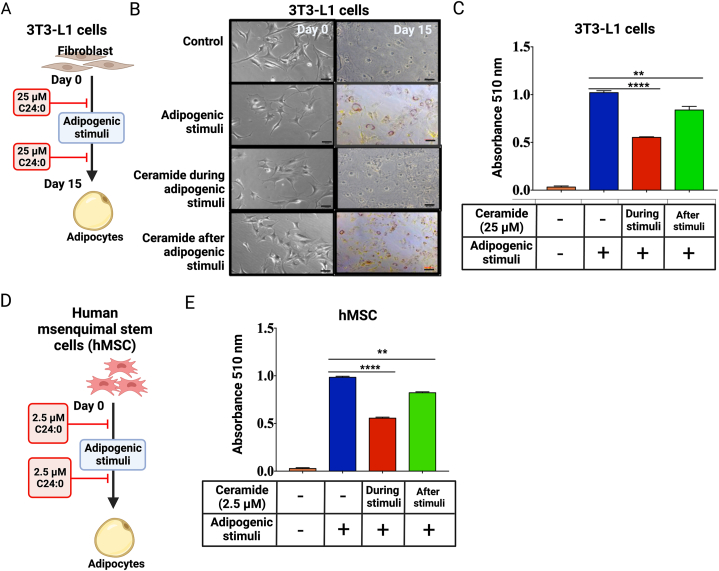
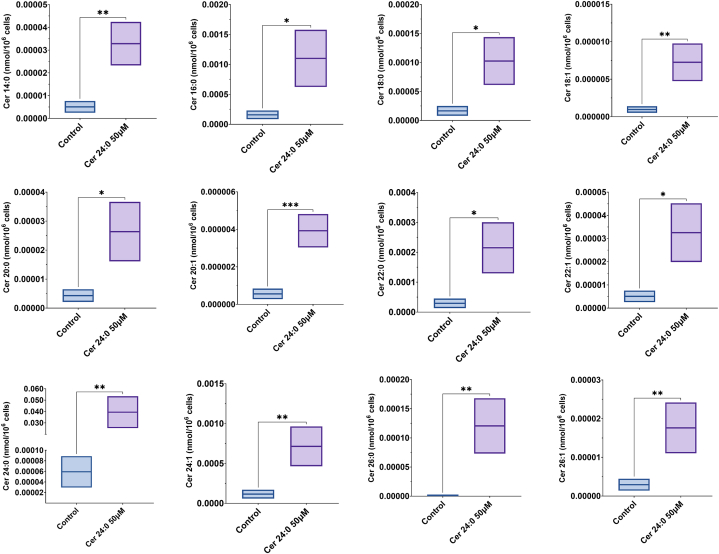
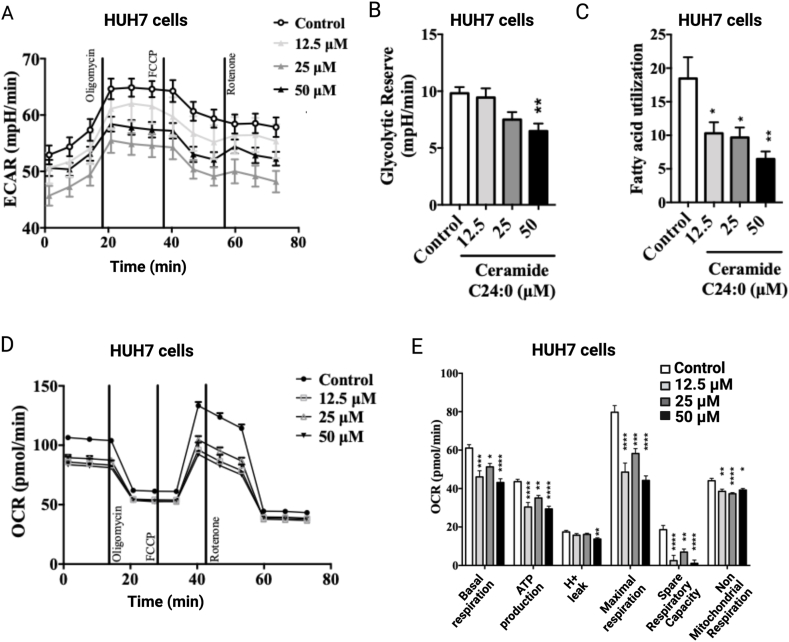
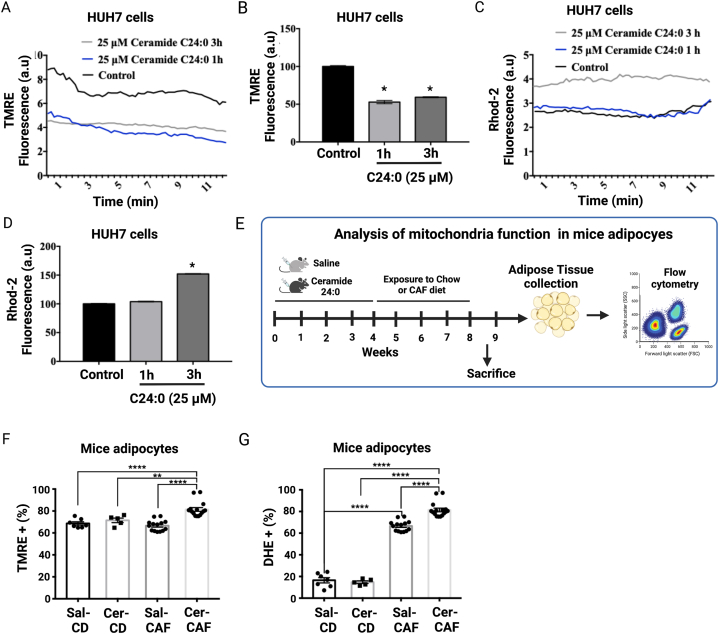
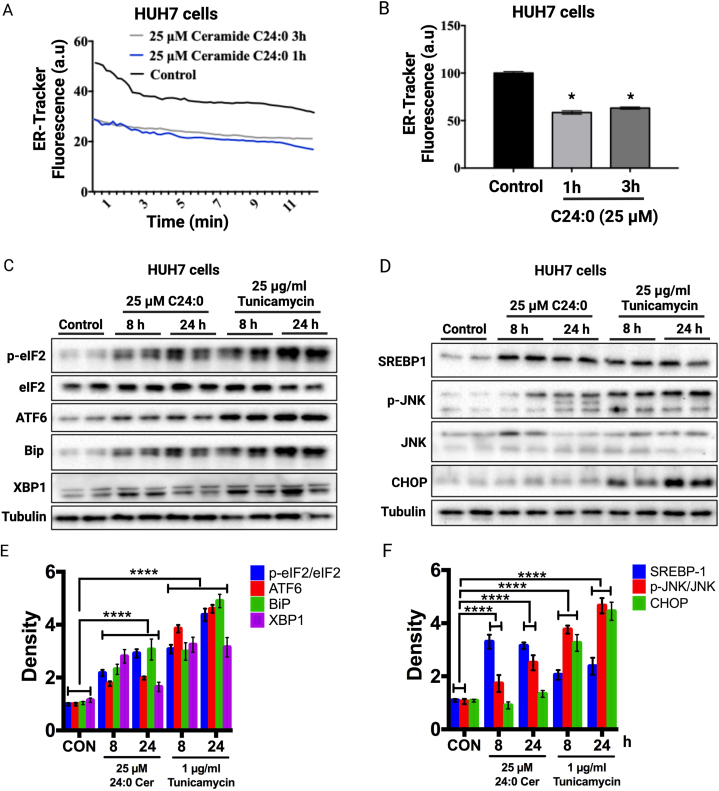
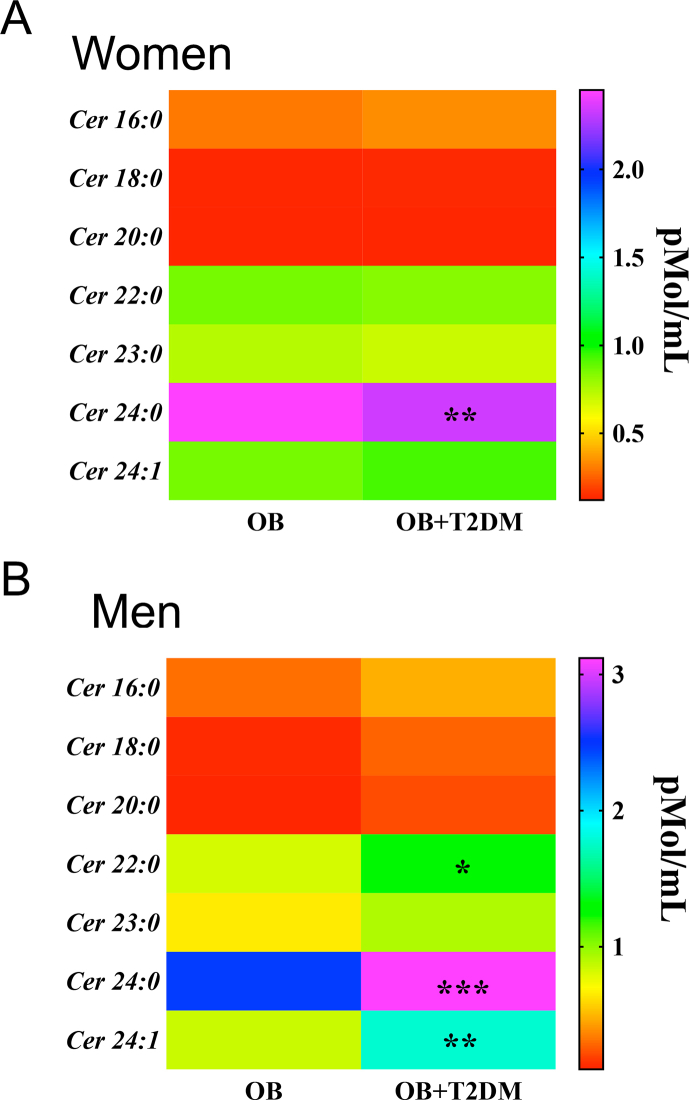
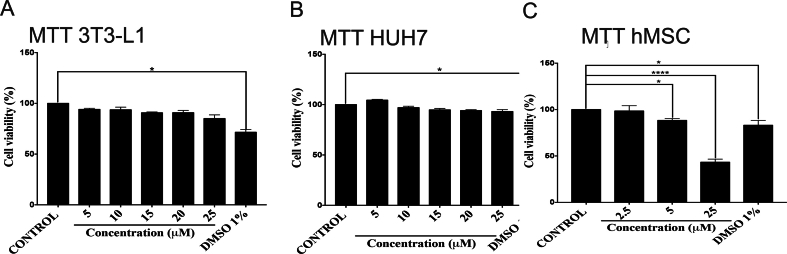
Fetal programming by exposure to high-energy diets increases the susceptibility to type 2 diabetes mellitus (T2DM2) in the offspring. Glucose imbalance during fetal programming might be associated to still unknown selective lipid species and their characterization might be beneficial for T2DM diagnosis and treatment. We aim to characterize the effect of the lipid specie, C24:0 ceramide, on glucose imbalance and metabolic impairment in cellular and murine models. A lipidomic analysis identified accumulation of C24:0 ceramide in plasma of offspring rats exposed to high-energy diets during fetal programing, as well as in obese-T2DM subjects. In vitro experiments in 3T3L-1, hMSC and HUH7 cells and in in vivo models of Wistar rats and C57BL/6 mice demonstrated that C24:0 ceramide disrupted glucose balance, and differentiation and lipid accumulation in adipocytes, whereas promoted liver steatosis. Mechanistically, C24:0 ceramide impaired mitochondrial fatty acid oxidation in adipocytes and hepatic cells, tentatively by favoring reactive oxygen species accumulation and calcium overload in the mitochondria; and also, activates endoplasmic reticulum (ER) stress in hepatocytes. We propose that C24:0 ceramide accumulation in the offspring followed a prenatal diet exposure, impair lipid allocation into adipocytes and enhances liver steatosis associated to mitochondrial dysfunction and ER stress, leading to glucose imbalance.

Keywords: Adipose tissue remodeling; C24:0 ceramide; Diabetes; ER stress; fetal programming; mitochondria.


Conflict of interest statement

The authors declare that they have no known competing financial interests or personal relationships that could have appeared to influence the work reported in this paper.

Figures

Image 1
Graphical abstract
Fig. 1
Fig. 1
C24:0 ceramide accumulates in blood samples of male and female obese and obese-T2DM subjects. A-B) Blood samples were collected from female obese (n = 40) or obese-diabetic (n = 34) and male obese (n = 20) or obese-diabetic subjects (n = 18) as described Materials and Methods. Plasma concentrations were determined by quantitative tandem mass spectrometry. Data are expressed as mean ± SEM. ∗p < 0.05, ∗∗p < 0.001, ∗∗∗p < 0.0001 of obese-T2DM vs. obese following ANOVA and post-hoc Tukey ′s test. Abbreviations, OB: Obese; T2DM: Type 2 diabetes Mellitus.
Fig. 2
Fig. 2
Fetal programming by CAF diet accumulates plasma C24:0 ceramide in offspring of rats. A) Maternal nutritional programing was performed by exposing mothers (n = 10) to ad libitum control chow diet (Control group, n = 4), or CAF diet (CAF group, n = 6) for 9 weeks (pre-pregnancy, pregnancy and lactation). After weaning (21st postnatal day) males offspring from mothers exposed to Chow or CAF diets were allocated into three experimental groups (n = 10–12 each): the control Chow group kept the Chow diet exposure (Control, group), and CAF group was exposed to Chow diet (CAF-Control group) or CAF diet (CAF-CAF group). B) Body weight changes after weaning for Control, CAF-Control and CAF-CAF groups (∗∗∗p < 0.0001 CAF-CAF vs Control). C, D) Histological assessment of liver of Control, CAF-Control and CAF-CAF groups and percentage of lipid inclusions (∗p < 0.05 CAF-CAF, CAF-Control vs Control). Heatmap and graph of plasma ceramides (E, F) or diacylglycerols (G, H) profile concentrations in offspring. Plasma concentrations were determined by quantitative tandem mass spectrometry as described in Materials and Methods (∗p < 0.05, ∗∗p < 0.001, ∗∗∗p < 0.0001 CAF-CAF or CAF-Control vs Control). All data are expressed as mean ± SEM following ANOVA and post-hoc Tukey ′s test. ∗p < 0.05, ∗∗p < 0.01, ∗∗∗p < 0.001.
Fig. 3
Fig. 3
Effect of chronic C24:0 ceramide administration on weight, food intake and glucose balance in mice. A) Experimental design of chronic C24:0 ceramide administration in mice on glucose homeostasis. Mice were i.p. administered with 3.5 nmol/ml C24:0 ceramide (n = 12) or saline (n = 10) in 100 μL for 4 weeks. GTT (B,C) and ITT (D,E) were performed at 15, 30, 45, 60, 90, and 120 min and AUC is shown. Insulin levels in mice exposed to during the GTT test were quantified 3.5 nmol/ml C24:0 ceramide or saline were quantified (F,G) and HOMA-IR index was determined (H). Hematoxilin and Eosin staining of the liver (I) and SAT (J) was performed. Adipocyte number (K) and adipocyte diameter (L) were quantified from SAT. Bar = 200 μm. Data show the normalized results of mean ± SEM and statistical significance after using ANOVA following by post-hoc Tukey test for body weight, food intake, GTT, ITT test and “t” student for food efficiency. ∗p < 0.05, ∗∗p < 0.001, ∗∗p < 0.0001. Abbreviations, AUC: Area Under Curve; SAT: Subcutaneous adipose tissue.
Fig. 4
Fig. 4
Effect of chronic C24:0 ceramide administration on glucose balance and adipose tissue expandability followed a CAF challenge. A) C57BL/6 mice were chronically treated with C24:0 ceramide (3.5 nmol/ml) C24:0 ceramide (n = 24) or saline (n = 20) in 100 μL for 4 weeks and exposed to Chow (n = 12 per group) or CAF (n = 10 per group) diet for 4 weeks. Food and body weight were recorded daily, and GTT and ITT assessments were evaluated at 7th and 8th weeks, respectively. Cumulative body weight (B) and Food intake (C) at 4th week and Cumulative body weight (D) and Food intake (E) at 8th week were recorded. GTT (F,G) and ITT (H,I) were performed at 15, 30, 45, 60, 90, and 120 min and AUC is shown. Data show the normalized results of mean ± SEM and statistical significance after using ANOVA following by post-hoc Tukey test for body weight, food intake, GTT, ITT test and “t” student for food efficiency. ∗p < 0.05, ∗∗p < 0.01, ∗∗∗p < 0.001. a vs Sal-CD, b vs Sal-CAF, c vs Sal-CD. Abbreviations, CD: Control diet; Sal: Saline; Cer: ceramide; CAF: Cafeteria.
Fig. 5
Fig. 5
Adipogenic differentiation of 3T3-L1 cell line and hMSC is impaired during C24:0 ceramide stimulation. A) 3T3-L1 or hMSC (D) cells were maintained in DMEM-high glucose + 10 % newborn calf serum, as described. Cells were 25 μM C24:0 ceramide-10 % FFA-BSA incubated before and after adipocyte differentiation by adipogenic stimuli for 11 days or 14 days, respectively. For control 1 % DMSO was added to a final concentration. Cellular lipid accumulation in 3T3-L1 (B, C) or hMSC (E) was conducted by adding oil red O solution following manufacturer's instructions and measured at 510 nm. Graphs show the normalized results of mean ± SEM for n = 3–4 independent experiments and statistical significance after using ANOVA following by post-hoc Tukey test. ∗∗p < 0.01, ∗∗∗p < 0.001.
Fig. 6
Fig. 6
Boxplots showing the distribution of twelve distinct ceramide species (Cer 14:0, Cer 16:0, Cer 18:0, Cer 18:1, Cer 20:0, Cer 22:0, Cer 22:1, Cer 24:0, Cer 24:1, Cer 25:0, Cer 26:0, and Cer 26:1) detected by DMS mass spectrometry in control and Cer 24:0 50 μM-treated groups. Significant differences in ceramide levels between the groups are indicated by asterisks (P < 0.05, ∗∗P < 0.01, ∗∗P < 0.001). The treatment with Cer 24:0 50 μM led to noticeable increases in various ceramides compared to the control group.
Fig. 7
Fig. 7
Cer 24:0 ceramide disrupts mitochondrial oxygen consumption and fatty acid utilization in HUH7 cells. Cells were treated with 12.5, 25, or 50 μM C24:0 ceramide-10 % FFA-BSA for 80 min and ECAR (A), Glycolytic Reverse (B), fatty acid utilization (C), OCR (D) or OCR H+ leak, maximal respiration, spare respiratory capacity and non-mitochondrial respiration (E) were determined using Seahorse technology. Data show the normalized results of mean ± SEM for n = 3–4 independent experiments and statistical significance after using ANOVA following by post-hoc Tukey test. ∗p < 0.05, ∗∗p < 0.01, ∗∗∗p < 0.001 vs Control. Abbreviations, OCR: Oxygen consumption rate; ECAR: extracellular acidification rate.
Fig. 8
Fig. 8
Cer 24:0 ceramide promotes mitochondrial calcium overload and mitochondria membrane potential depolarization in HUH7 cell and mice adipocytes. HUH7 cells were treated with 25 μM C24:0 ceramide-10 % FFA-BSA for 1 or 3h and mitochondrial and ER dysfunction and mitochondrial calcium were determined using TMRE (A, B) or Rhod-2 AM (C,D) trackers and confocal microscopy, respectively. Data show the normalized results of mean ± SEM for n = 3–4 independent experiments and statistical significance after using ANOVA following by post-hoc Tukey test. ∗p < 0.05, ∗∗p < 0.01, ∗∗∗p < 0.001. E) Mouse SAT was isolated as described [42], and cells were stained with BODIPY (2 μM) TMRE (100 nM) or DHE (1 μM) and incubated for 30 min at 37 °C. Mitochondrial membrane potential (F) and ROS production (G) were determined by flow cytometry (BD Accuri C6) using the FL1 for BODIPY+ and the FL3 channel for TMRE + or DHE+. All of the events that were positive for the FL1 channel were considered as adipocytes and that is where we measured the loss of mitochondrial potential or ROS production using the BD Accuri C6 software. Data show the normalized results of mean ± SEM for n = 6–8 mice per group and statistical significance after using ANOVA following by post-hoc Tukey test. ∗p < 0.05, ∗∗p < 0.01, ∗∗∗p < 0.001, ∗∗∗∗p < 0.0001.
Fig. 9
Fig. 9
Cer 24:0 ceramide promotes ER stress in HUH7. Cells were treated with 25 μM C24:0 ceramide-10 % FFA-BSA for 1 or 3h and ER dysfunction was determined using ER-Tracker Green (A, B) trackers and confocal microscopy, respectively. Data show the normalized results of mean ± SEM for n = 3 independent experiments and statistical significance after using ANOVA following by post-hoc Tukey test. ∗p < 0.05, ∗∗p < 0.001, ∗∗∗p < 0.0001. HUH7 cells were incubated with 25 μM C24:0 ceramide-10 % FFA-BSA or 25 μg/ml tunicamycin for 8 or 24 h and Western blot against p-eIF2/ATF6, ATF6, Bip or XBP1 (C, E) or SREBP1, p-JNK/JNK or CHOP (D, F) were performed. Data show the normalized results of mean ± SEM for n = 3 independent experiments and statistical significance after using ANOVA following post-hoc Tukey test. ∗p < 0.05, ∗∗∗∗p < 0.0001.
figs1
figs1
figs2
figs2

References

    1. Itoh H., Ueda M., Suzuki M., Kohmura-Kobayashi Y. Developmental Origins of metaflammation; A bridge to the future between the DOHaD theory and evolutionary biology. Front. Endocrinol. 2022;13 doi: 10.3389/fendo.2022.839436. - DOI - PMC - PubMed
    1. Santos S., Monnereau C., Felix J.F., Duijts L., Gaillard R., Jaddoe V.W.V. Maternal body mass index, gestational weight gain, and childhood abdominal, pericardial, and liver fat assessed by magnetic resonance imaging. Int. J. Obes. 2019 doi: 10.1038/s41366-018-0186-y. - DOI - PubMed
    1. Maldonado-Ruiz R., Cárdenas-Tueme M., Montalvo-Martínez L., Vidaltamayo R., Garza-Ocañas L., Reséndez-Perez D., Camacho A. Priming of hypothalamic ghrelin signaling and microglia activation exacerbate feeding in rats' offspring following maternal overnutrition. Nutrients. 2019;11 doi: 10.3390/nu11061241. - DOI - PMC - PubMed
    1. Camacho-Morales A., Caballero-Benitez A., Vázquez-Cruz E., Maldonado-Ruiz R., Cárdenas-Tueme M., Rojas-Martinez A., Caballero-Hernández D. Maternal programming by high-energy diets primes ghrelin sensitivity in the offspring of rats exposed to chronic immobilization stress. Nutr. Res. 2022;107 doi: 10.1016/j.nutres.2022.08.007. - DOI - PubMed
    1. Cardenas-Perez R.E., Fuentes-Mera L., De La Garza A.L., Torre-Villalvazo I., Reyes-Castro L.A., Rodriguez-Rocha H., Garcia-Garcia A., Corona-Castillo J.C., Tovar A.R., Zambrano E., Ortiz-Lopez R., Saville J., Fuller M., Camacho A. Maternal overnutrition by hypercaloric diets programs hypothalamic mitochondrial fusion and metabolic dysfunction in rat male offspring. Nutr. Metab. 2018;15 doi: 10.1186/s12986-018-0279-6. - DOI - PMC - PubMed

LinkOut - more resources