. 2024 Dec 6;9(23):e179963.
doi: 10.1172/jci.insight.179963.

The pivotal role of the Hes1/Piezo1 pathway in the pathophysiology of glucocorticoid-induced osteoporosis

Affiliations

The pivotal role of the Hes1/Piezo1 pathway in the pathophysiology of glucocorticoid-induced osteoporosis

Nagahiro Ochiai et al. JCI Insight. .

Abstract

Glucocorticoid-induced osteoporosis (GIOP) lacks fully effective treatments. This study investigated the role of Piezo1, a mechanosensitive ion channel component 1, in GIOP. We found reduced Piezo1 expression in cortical bone osteocytes from patients with GIOP and a GIOP mouse model. Yoda1, a Piezo1 agonist, enhanced the mechanical stress response and bone mass and strength, which were diminished by dexamethasone (DEX) administration in GIOP mice. RNA-seq revealed that Yoda1 elevated Piezo1 expression by activating the key transcription factor Hes1, followed by enhanced CaM kinase II and Akt phosphorylation in osteocytes. This improved the lacuno-canalicular network and reduced sclerostin production and the receptor activator of NF-κB/osteoprotegerin ratio, which were mitigated by DEX. Comparative analysis of mouse models and human GIOP cortical bone revealed downregulation of mechanostimulated osteogenic factors, such as osteocrin, and cartilage differentiation markers in osteoprogenitor cells. In human periosteum-derived cells, DEX suppressed differentiation into osteoblasts, but Yoda1 rescued this effect. Our findings suggest that reduced Piezo1 expression and activity in osteocytes and periosteal cells contribute to GIOP, and Yoda1 may offer a novel therapeutic approach by restoring mechanosensitivity.

Keywords: Bone biology; Bone disease; Osteoporosis; Therapeutics.


Conflict of interest statement

Conflict of interest: NO and SI are employees of Taisho Pharmaceutical Co. KE has received speaking fees from Asahi-Kasei, Daiichi-Sankyo, Eisai, and Eli Lilly.

Figures

Figure 1
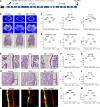
Figure 1. Patients with GIOP exhibit a reduced osteocyte LCN and Piezo1 protein expression.
The figure depicts cortical bone sections from the femurs of both patients with GIOP and non-GIOP controls (Supplemental Table 1). (A and B) Silver staining, highlighting the lacunae-osteocyte network. (A) Comparison between a non-GIOP control (52 years, female) and a patient with GIOP (51 years, female). Original magnification, ×4; scale bars: 200 μm. (B) Quantification of the dendrite length of osteocytes in the 2 groups. (C and D) Hematoxylin and eosin (H&E) staining. Images of sections from a non-GIOP control (52 years, female) and a patient with GIOP (51 years, female). Original magnification, ×4; scale bars: 200 μm. (D) The ratio of empty lacunae to total lacunae was calculated. (E and F) TUNEL assay results, with images (E) comparing a non-GIOP control (61 years, female) with a patient with GIOP (51 years, female). Original magnification, ×20; scale bars: 100 μm. (F) Quantification of TUNEL+ cells. (G and H) IHC analysis showcasing Piezo1 expression. (G) Comparison between a non-GIOP control (65 years, female) and a patient with GIOP (63 years, female). Original magnification,× 40; scale bars: 60 μm. (H) Quantification of Piezo1+ cells per bone surface area. (I) WB results for Piezo1 and β-actin. Data are expressed as mean ± SD, n = 3 per group. For WB analysis of Piezo1 and β-actin protein expression, results are expressed as mean ± SD. (J) Quantification of WB analysis using ImageJ. Band intensities were normalized to β-actin. A 2-tailed Student’s t test with a 95% confidence interval was used for statistical analysis. **P < 0.01, ***P < 0.001.
Figure 2
Figure 2. Yoda1 prevents bone structure changes and reduces the fragility of the femur in a mouse model of GIOP.
(A) Injection schedule for DEX and Yoda1: DEX was administered 1 mg/kg (s.c.), while Yoda1 was injected 5 μmol/kg (i.p.), and vehicle treatments consisting of distilled water was injected s.c. like DEX and 5% ethanol was injected i.p. like Yoda1. Each group received 5 injections over 1 week, repeated for 4 weeks. Experimental groups were defined as Vehicle (vehicle-treated), DEX (DEX-treated), and DEX+Yoda1 (concomitant administration of DEX and Yoda1). (B) Microcomputed tomography images (top 2 rows) of cortical and trabecular bone (scale bars: 250 μm) and femur metaphysis area (bottom row) stained using Villanueva’s bone staining (scale bars: 100 μm). (C) Microcomputed tomography analysis, including bone volume fraction (BV/TV), cortical thickness (Ct. Th.), and trabecular number (Tb. N.) (n = 9 for each group). (D) Three-point bending tests on femurs, with sample sizes as follows: Vehicle (n = 6), DEX (n = 10), and DEX+Yoda1 (n = 8). (E) Images highlighting the osteoid surface (indicated by white lines) at ×80 magnification during bone morphometry analysis (scale bars: 10 μm). (F) Osteoblast surface (Ob. S/OS). (G) Osteoid volume (OV/OS). (H) Cortical bone images (depicted with black bands) at ×80 magnification (scale bars: 10 μm). (I) Cortical width (Ct. Wi.). (J) Cortical area (Ct. Ar.). (K) Images of alizarin and calcein labeling at ×100 magnification (scale bars: 5 μm). The labeling periods were 4 days for alizarin and 1 day for calcein. (L) MAR. (M) BFR. For panels EM, n = 4 for each group. The results are presented as box-and-whisker plots. Statistical significance was determined using a 1-way ANOVA followed by a Tukey-Kramer post hoc test. *P < 0.05, **P < 0.01, ***P < 0.001.
Figure 3
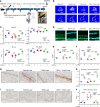
Figure 3. Bone histological analysis following combination treatment with DEX and Yoda1.
Experimental groups consisted of Vehicle (treated with distilled water s.c. and 5% ethanol i.p.), DEX (treated with DEX, 1 mg/kg, s.c.), and DEX+Yoda1 (received concurrent treatment of DEX, 1 mg/kg, s.c. and Yoda1, 5 μmol/kg, i.p.). (A and B) IHC for Piezo1. (A) Piezo1+ cells are identified by arrowheads at ×20 magnification (scale bars: 200 μm). (B) Quantitative analysis of Piezo1+ cells per bone surface area. (C and D) IHC analysis of Sost. (C) Sost+ cells are denoted by arrowheads at ×20 magnification (scale bars: 200 μm). (D) Quantification of Sost+ cells per bone surface area. (E and F) Silver staining for LCN visualization. (E) LCN imaged at ×40 magnification (scale bars: 60 μm). (F) Quantification of the dendritic length of osteocytes across groups. (G and H) F-actin visualization with Alexa Fluor 488–labeled phalloidin staining, with nuclei counterstaining with DAPI. (G) Staining displayed at ×100 magnification (scale bars: 20 μm). (H) Quantification of osteocyte dendrite length among the groups. (I and J) IHC for osteocalcin. (I) Osteocalcin+ cells indicated by arrowheads, visualized at ×20 magnification (scale bars: 200 μm). (J) Quantification of osteocalcin+ cells per bone surface area. (K and L) TRAP staining. (K) TRAP+ cells are marked with arrowheads at ×20 magnification (scale bars: 20 μm). (L) Quantification of TRAP+ cells per bone surface area. (M) Representation of eroded surface (ES/BS) in the plot. In H and M, n = 4 for each group. Sample sizes were n = 5 for other measurements. The results are presented as box-and-whisker plots. Statistical significance was assessed via 1-way ANOVA and Tukey-Kramer post hoc test. **P < 0.01, ***P < 0.001.
Figure 4
Figure 4. Yoda1 reverses the glucocorticoid-induced attenuation of mechanically driven bone responses.
(A) Protocol for tibial mechanical loading and DEX and Yoda1 administration schedule: mice received DEX (1 mg/kg s.c.), Yoda1 (5 μmol/kg i.p.), or vehicle (distilled water s.c. and 5% ethanol i.p.) in 5 injections over 1 week. The left tibiae were subjected to axial mechanical loading 2–3 times weekly using an ElectroForce 5500 system. Each loading session consisted of 40 cycles of a trapezoidal waveform applying −13 N for 0.1 seconds, with 10-second intervals. Experimental groups consisted of Vehicle, DEX, and DEX+Yoda1. (B) Microcomputed tomography scans of both cortical and trabecular bone sections (scale bar: 250 μm). (C) Microcomputed tomography evaluations, including BV/TV, Ct. Th., Tb. N., and Po. Tot (n = 6 for Vehicle, n = 9 for DEX, and n = 9 for DEX+Yoda1). (D) Images of tetracycline and calcein labeling at ×100 magnification (scale bars: 5 μm). Labeling durations were 2 days for tetracycline and 1 day for calcein. (E) MAR. (F) BFR. For panels E and F, n = 3 for each group. (G and H) IHC for osteocalcin expression. (G) Periosteal bone surfaces, demarcated by a dashed line (original magnification, ×20; scale bars: 200 μm). (H) The ratio of osteocalcin+ cells on the periosteal surface. (I and J) TRAP staining. (I) TRAP+ cells were identified with arrowheads at ×20 magnification (scale bars: 20 μm). (J) Quantification of TRAP+ cells per bone surface area. For panels H and J, n = 3–4 for each group. All data are expressed as the mean ± SD. Statistical significance was determined using a 1-way ANOVA followed by a Tukey-Kramer post hoc test. *P < 0.05; **P < 0.01; ***P < 0.001. NS, not significant.
Figure 5
Figure 5. Effects of DEX and Yoda1 on human cortical bone and MLO-Y4 cells.
(AD) Human femoral neck cortical bone samples obtained from hip arthroplasty procedures were cleared of soft tissues. Subsequently, they were incubated overnight, followed by DEX and Yoda1 treatment for 6 hours (n = 3). Four experimental groups were established: Control (untreated), Yoda1 alone (10 μM), DEX alone (1 μM), and DEX+Yoda1 (combination of 1 μM DEX and 10 μM Yoda1). (E) WB analysis of Piezo1 and β-actin protein levels in MLO-Y4 cells following overnight treatment with DEX and subsequent 24-hour exposure to Yoda1. (F and G) WB analysis of Akt and ERK phosphorylation in response to DEX treatment and subsequent 2 hours of Yoda1 administration. (H) MLO-Y4 cells were incubated with DEX (0.1 and 1 μM) for 24 hours. Subsequently, all groups were treated with Yoda1 (1 μM) to monitor changes in Ca2+ influx (n = 3). (I) Yoda1 (10 μM) to monitor changes in Ca2+ influx (n = 3). (J) Impact of KN-93, a CaMKII selective inhibitor, on Akt phosphorylation in MLO-Y4 cells treated with DEX, preincubated with KN-93 for 2 hours, and then exposed to Yoda1 for 1 hour. (K and L) Morphological changes in F-actin structure in MLO-Y4 cells subjected to DEX and Yoda1 for 72 hours were visualized using rhodamine-phalloidin (see Supplemental Methods) and Hoechst 33342 staining. Images were acquired using an In Cell Analyzer 6000 at ×40 magnification (scale bars: 50 μm). (L) Actin cross-linking points were quantified (n = 8). Results are presented as the mean ± SD. Statistical significance was evaluated using a 1-way ANOVA followed by a Tukey-Kramer post hoc test. *P < 0.05, **P < 0.01, ***P < 0.001 for Control vs. DEX (0.1 μM) + Yoda1; †P < 0.05, ††P < 0.01, †††P < 0.001 for Control vs. DEX (1 μM) + Yoda1.
Figure 6
Figure 6. Differential gene expression analysis in response to mechanical stress under DEX treatment and investigation of the Piezo1 transcription factor.
(A) Mouse tibial gene expression profiling was performed following mechanical loading using RNA-seq. Subcutaneous injections of 1 mg/kg DEX (DEX group) or distilled water (Vehicle group) were administered 5 times over 7 days. The left tibia underwent mechanical stress (40 cycles of −13 N force for 0.1 seconds at 10-second intervals, 3 times weekly) using an ElectroForce 5500 system. The right tibia remained unloaded as a control. Tibiae were flash-frozen for RNA extraction and sequencing 4 hours after final loading on day 5. (B and C) Differentially expressed genes (DEGs) are presented for the vehicle (B) and DEX (C) groups upon loading. Statistical significance was determined using the DESeq2 Wald test, highlighted with red dots for adjusted P values of less than 0.05. (D) Comparisons between vehicle- and DEX-treated groups under loading conditions revealed changes in genes such as Piezo1 (log2 fold change [log2FC] = −0.38, adjusted P value [Padj] = 3.0 × 10⁻³), Tnfsf11b (log2FC = −0.48, Padj = 7.0 × 10⁻⁴), and Tnfrsf11a (log2FC = 0.67, Padj = 1.8 × 10⁻²). (E) Gene Ontology (GO) overrepresentation analysis revealed impaired response to mechanical stress under DEX, with terms ranked by gene ratio and the bone-related terms highlighted (adjusted for multiple comparisons using an FDR). (F) A Venn diagram integrates data on Piezo1 transcription factor candidates from the ChIP atlas and RNA-seq. (G) Gene expression changes upon mechanical stress (low-intensity pulsed ultrasound, LIPUS) in MLO-Y4 cells are depicted. Piezo1 transcription factor candidates (mapped from previous research by Shimizu et al., ref. ; GEO GSE162674) are highlighted in red. Hes1, hairy and enhancer of split 1; Vdr, vitamin D receptor; Bhlhe41, basic helix-loop-helix family, member 41.
Figure 7
Figure 7. Hes1 is a regulatory transcription factor of Piezo1 modulated by DEX and Yoda1.
(A) The impact of Hes1 knockdown on Piezo1 expression, as assessed by qPCR following Hes1 siRNA or control RNA electroporation in MLO-Y4 cells, 2 days after electroporation. Results are presented as mean ± SD (n = 3) and were analyzed using a 2-tailed Student’s t test with a 95% confidence interval. *P < 0.05, **P < 0.01. (B) WB analysis for Hes1 and Piezo1 was conducted after siRNA transfection and overnight incubation with DEX (1 μM). (C) A schematic of the Piezo1 promoter (1200 bp) with the Hes1 binding site (657 bp) and highlighted CUT&RUN assay primers. (D) CUT&RUN assay results after siRNA transfection and overnight incubation, followed by treatment with DEX (1 μM) or Yoda1 (10 μM) for 1 day. The Ctrl group utilized rabbit IgG for immunoprecipitation, while other groups used an anti-Hes1 antibody (n = 3). (E) Luciferase assay after vector electroporation and overnight incubation, followed by DEX (1 μM) overnight and subsequently Yoda1 (10 μM) treatment for 4 hours. Constructs included Empty (empty pNL3.1 vector) and Ctrl (pNL3.1 with Hes1 binding region), n = 6. (F) The DEX dose-response effect on Hes1 expression in MLO-Y4 cells was analyzed using qPCR 4 hours after treatment (n = 4). (G) The effects of DEX (1 μM) and Yoda1 (10 μM) on HES1 mRNA levels in human cortical bone organ cultures were measured by qPCR 6 hours after treatment (n = 3). (H) Analysis of Hes1 phosphorylation upon treatment with DEX (1 μM), followed by Yoda1 (10 μM) for 4 hours. Data are presented as mean ± SD. Results were analyzed with a 1-way ANOVA and the Tukey-Kramer post hoc test. *P < 0.05; **P < 0.01; ***P < 0.001. NS, not significant.
Figure 8
Figure 8. An integrated analysis of the attenuated mechanical stress response in GIOP, based on cortical bone data from both patients with GIOP and mouse tibial loading RNA-seq.
(A and B) Relative gene expression analysis between patients with and without GIOP was conducted using Wald’s test implemented in DESeq2. (A) Markedly altered gene expression in GIOP is depicted by blue (decrease) and red (increase) spots (P < 0.05). For instance, OSTN (osteocrin) log2 fold change is −4.13 (Padj = 2.3 × 10⁻¹⁶). (B) Gene set enrichment analysis based on the log2 fold change of genes between patients with and without GIOP, with bone-related terms highlighted. (C and D) Gene expression changes in the mouse tibia (featuring ACAN, SOX9, and SFRP2) and the human femoral neck. Data are expressed as mean ± SD (n = 4–5 per group). Statistical analysis was performed using Wald’s test according to the DESeq2 workflow and the appropriate statistical model. *P < 0.05; **P < 0.01; ***P < 0.001, with FDR correction applied to account for multiple error risks. NS, not significant.
Figure 9
Figure 9. Impact of DEX and Yoda1 on Piezo1 expression and osteoblast differentiation in PDCs.
(A) Piezo1 expression evaluation during PDC osteogenesis. PDCs isolated from the femur during knee arthroplasties were treated with collagenase type II overnight and differentiated using the STEM PRO Osteogenesis Kit (see Supplemental Methods). After 3 days, the media were replaced, and cells were treated with DEX (1 μM) overnight, followed by a 4-hour exposure to Yoda1 (10 μM) before protein extraction for WB. Five experimental groups were established: Undiff. (undifferentiated PDCs), Diff. (differentiated PDCs), Yoda1 (Yoda1-treated after differentiation), DEX (DEX-treated after differentiation), and DEX+Yoda1 (DEX and subsequent Yoda1 after differentiation). (B) PDC gene expression was assessed through qPCR following overnight DEX (1 μM) and subsequent 4-hour exposure to Yoda1 (10 μM) (n = 3). (C and D) Osteoblast differentiation was initiated in PDCs with DEX (1 μM) and Yoda1 (1 μM) addition 1 day after induction. (C) Alkaline phosphatase (ALP) staining and (D) ALP assay were conducted on day 14 (n = 4). (E and F) Alizarin red S staining was performed on day 21 after differentiation to evaluate mineralization at low (×1.2) and high (×4) magnifications. Scale bars: 2 mm (low) and 500 μm (high). (F) Quantification of mineralization through solubilization in 5% formic acid and measuring absorbance at 415 nm (n = 3). Data are presented as mean ± SD. A 1-way ANOVA coupled with a Tukey-Kramer post hoc test was employed for statistical analysis. *P < 0.05; **P < 0.01; ***P < 0.001. NS, not significant.
Figure 10
Figure 10. Yoda1-induced enhancement of osteocyte function via Hes1/Piezo1 signaling.
Yoda1 enhances Piezo1 expression through Hes1 activation, increasing CaMKII and Akt phosphorylation in osteocytes. This results in an improved lacuno-canaliculi network (LCN), reduced sclerostin production, and a balanced RANKL/OPG ratio, effects that are diminished by DEX.

References

    1. Humphrey MB, et al. 2022 American College of Rheumatology guideline for the prevention and treatment of glucocorticoid-induced osteoporosis. Arthritis Rheumatol. 2023;75(12):2088–2102. doi: 10.1002/art.42646. - DOI - PubMed
    1. Adami G, Saag KG. Glucocorticoid-induced osteoporosis: 2019 concise clinical review. Osteoporos Int. 2019;30(6):1145–1156. doi: 10.1007/s00198-019-04906-x. - DOI - PubMed
    1. Lespessailles E, Chapurlat R. High fracture risk patients with glucocorticoid-induced osteoporosis should get an anabolic treatment first. Osteoporos Int. 2020;31(10):1829–1834. doi: 10.1007/s00198-020-05568-w. - DOI - PubMed
    1. Ciani A, et al. Ptychographic X-ray CT characterization of the osteocyte lacuno-canalicular network in a male rat’s glucocorticoid induced osteoporosis model. Bone Rep. 2018;9:122–131. doi: 10.1016/j.bonr.2018.07.005. - DOI - PMC - PubMed
    1. Franciscus van Tol A, et al. The mechanoresponse of bone is closely related to the osteocyte lacunocanalicular network architecture. Proc Natl Acad Sci U S A. 2020;117(51):32251–32259. doi: 10.1073/pnas.2011504117. - DOI - PMC - PubMed

MeSH terms