. 2025 Mar;27(2):265-278.
doi: 10.1111/plb.13743. Epub 2024 Dec 6.

Soil health improvements under cover crops are associated with enhanced soil content of cytokinins

Affiliations

Soil health improvements under cover crops are associated with enhanced soil content of cytokinins

I Perera et al. Plant Biol (Stuttg). 2025 Mar.

Abstract

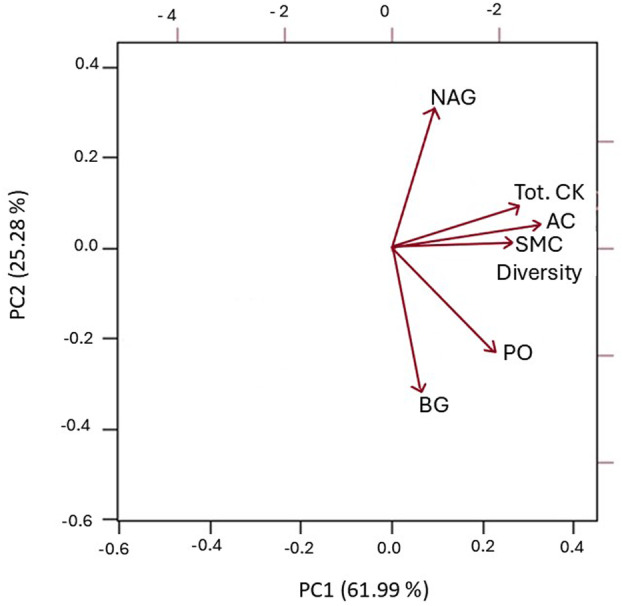
Cytokinins (CKs) are phytohormones produced by plants and other soil life. including bacteria, fungi, insects, and earthworms. These organisms can release CKs to the soil, which may have positive implications for soil health and plant growth. However, no studies have examined phytohormones as soil health indicators. In custom-designed rhizo-pots that separated rhizosphere and bulk soils, the cover crops tillage radish and cereal rye were used to manipulate soil health parameters: soil pH, soil organic matter, soil active carbon, soil microbial community diversity, and extracellular enzyme activities involved in C, N and P cycling. Data were compared to impacts of cover crops on CKs that were purified from the complex soil and measured with HPLC-HRMS/MS. From soil we detected free base-CKs (trans-zeatin (tZ), isopentenyladenine (iP)), riboside-CKs (RB-CKs), cis-zeatin riboside (cZR), isopentenyladenosine (iPR) and four methylthiolated CKs: 2-methylthio-zeatin (2MeSZ), 2-methylthio-zeatin ribosides (2MeSZR), 2-methylthio-isopentenyladenine (2MeSiP), and 2-methylthio-isopentenyladenine riboside (2MeSiPR). These CK levels were significantly enhanced in cover cropped soil compared to uncultivated soil, and reflect a positive relationship between soil CK profiles and other soil health parameters - notably, between total CK and active C levels and soil microbial community diversity. This is the first detailed soil CK analysis and assessment of its potential use as a novel, reliable, short-term soil health parameter. The increased CK concentrations in cover cropped soils likely reflects the activity levels of soil life (plants, microbes, animals) and provides a rationale to use CKs as tools to evaluate soil health as influenced by agricultural management strategies.

Keywords: Cereal rye; cover crops; cytokinins; soil health indicators; soil microbial communities; tillage radish.


Figures

Fig. 1
Fig. 1
Schematic diagram of pots used in the greenhouse experiment. A single pot was fitted with a small pot inside and called a ‘rhizo‐pot’. The rhizo‐pots were custom‐designed using geotextile fabric with a 2‐μm pore size to allow water, nutrients, and microbes to pass between the rhizosphere and bulk soil zones while restricting root growth from the rhizosphere to bulk zone.
Fig. 2
Fig. 2
The effect of cover crops on (A) soil organic matter (SOM), (B) active carbon (AC) levels compared to control, uncultivated soils. ANOVA was used to compare metrics between crops and soil zones within loam soil and sandy loam soils CS (control soil); tillage radish, rhizosphere soil (TR); tillage radish, bulk soil (TB); cereal rye, rhizosphere soil (CR); cereal rye, bulk soil (CB). Values are mean ± SE (n = 3), different letters above columns indicate significant differences among treatments (Fisher's least significant difference test, P ≤ 0.05).
Fig. 3
Fig. 3
Effects of cover crops on soil microbial community (SMC) diversity, compared to control, uncultivated soils. CS (control soil); tillage radish, rhizosphere soil (TR); tillage radish, bulk soil (TB); cereal rye, rhizosphere soil (CR); cereal rye, bulk soil (CB). The wells in the BIOLOG plates contain a C‐source and tetrazolium violet, a redox dye indicator. When inoculated soil microbial communities utilize these C sources for respiration, the tetrazolium dye reduces to formazan, resulting in a colour change (colourless to pink/violet). The ability of soil microbial communities to utilize different C sources was measured based on colour development. ANOVA was used to compare treatments separately in loam and sandy loam soils. Values are mean ± SE (n = 3), different letters above columns indicate significant differences among treatments (Fisher's least significant difference test, P ≤ 0.05).
Fig. 4
Fig. 4
A 2D representation of PC1 and PC2 derived from sparse PCA analysis of normalized absorbance readings (590 nm) of BiologEcoPlates obtained as a result of substrate (30 carbon sources) utilization by soil microbial communities present in sandy loam rhizosphere and bulk soil under tillage radish. Blue squares are scores for rhizosphere soil samples, while green triangles are scores for bulk soil samples. Vector loadings indicate the 31 different carbon sources: carbohydrates (C1‐C10), carboxylic acids (CA1‐CA9), amines and amides (A1 and A2), amino acids (AA1‐AA6), and polymers (P1‐P3). The two ellipses represent the two clusters: green circle illustrates cluster of bulk soil samples, blue circle illustrates cluster of rhizosphere soil samples. A1‐ Phenylethylamine; A2‐ Putrescine; AA1‐ L‐Arginine; AA2‐ L‐Asparagine; AA3‐L‐Phenylalanine; AA4‐ L‐Serine; AA5‐ L‐Threonine; AA6‐ Glycyl‐L‐glutamic acid; C1‐ Pyruvic acid methy ester; C2‐ D‐Cellobiose; C3‐ Alpha‐D‐lactose; C4‐ Beta‐methyl‐D‐glucoside; C5‐ D‐Xylose; C6‐ i‐Erythritol; C7‐ D‐Mannitol; C8‐ N‐Acetyl‐D‐glucosamine; C9‐ Glusose‐1‐phosphate; C10‐ D,L‐a‐Glycerol phosphate; CA1‐ D‐Glucosaminic acid; CA2‐ D‐Galactonic acid y‐ Lactone; CA3‐ D‐Galacturonic acid; CA4–2‐Hydroxy benzoic acid; CA5–4‐Hydroxy benzoic acid; CA6‐ Gamma‐amino butyric acid; CA7‐ Itaconic acid; CA8‐ alpha‐keto‐butyric acid; CA9‐ alpha‐keto‐butyric acid; P1‐ Tween 40; P2‐ Tween 80; P3‐ Alpha‐cyclodextrin.
Fig. 5
Fig. 5
Effect of cover crops on total CK concentrations (pmol g−1 dry weight) compared to control, uncultivated soil (CS). Values are mean ± SE (n = 3), different letters above columns indicate significant difference among treatments within one soil type (Fisher's least significant difference test, P ≤ 0.05). control soil (CS); tillage radish, rhizosphere soil (TR); tillage radish, bulk soil (TB); cereal rye, rhizosphere soil (CR); cereal rye, bulk soil (CB).
Fig. 6
Fig. 6
Effect of cover crops on CKs concentrations (pmol g−1 dry weight) (A) trans‐zeatin (tZ), (B) Isopentenyladenine (iP), (C) cis‐Zeatin riboside (cZR), (D) Isopentenyladenosine (iPR); (E) 2‐methylthio‐zeatin (2MeSZ), (F) 2‐Methylthio‐N6‐isopentenyladenine (2MeSiP), (G) 2‐Methylthio‐zeatin riboside (2MeSZR), (H) 2‐Methylthio‐N6‐isopentenyladenosine (2MeSiPR), compared to control, uncultivated soils. ANOVA was used to compare metrics between treatments separately in loam soil and sandy loam soil. Values are mean ± SE (n = 3), different letters above columns indicate significant difference among treatments (Fisher's least significant difference test, P ≤ 0.05). control soil (CS); tillage radish, rhizosphere soil (TR); tillage radish, bulk soil (TB); cereal rye, rhizosphere soil (CR); cereal rye, bulk soil (CB).
Fig. 7
Fig. 7
2D representation of PC1 and PC2 derived from the principal components analysis (PCA) of the dataset total cytokinins (Tot. CK), active carbon (AC), soil microbial community (SMC) diversity, and enzyme activity of ꞵ‐glucosidase (BG), phosphatase (PO), N‐acetylglucosaminidase (NAG) in loam rhizosphere and in bulk soil samples under the cover crops tillage radish and cereal rye.

Similar articles

Cited by

References

    1. Andreas P., Kisiala A., Neil Emery R.J., De Clerck‐Floate R., Tooker J.F., Price P.W., Miller D.G., Chen M.S., Connor E.F. (2020) Cytokinins are abundant and widespread among insect species. Plants, 9, 208–231. 10.3390/plants9020208 - DOI - PMC - PubMed
    1. Aoki M.M., Seegobin M., Kisiala A., Noble A., Brunetti C., Emery R.J.N. (2019) Phytohormone metabolism in human cells: Cytokinins are taken up and interconverted in HeLa cell culture. FASEB Bioadvances, 1, 320–331. 10.1096/fba.2018-00032 - DOI - PMC - PubMed
    1. Arthur G.D., Jäger A.K., Van Staden J. (2001) Uptake of [3H]DHZ by tomato seedlings. South African Journal of Botany, 67, 661–666. 10.1016/S0254-6299(15)31197-2 - DOI
    1. Ashihar H., Stasolla C., Fujimura T., Crozier A. (2018) Purine salvage in plants. Phytochemistry, 147, 89–124. 10.1016/j.phytochem.2017.12.008 - DOI - PubMed
    1. Badri D.V., Vivanco J.M. (2009) Regulation and function of root exudates. Plant, Cell and Environment, 32, 666–681. 10.1111/j.1365-3040.2009.01926.x - DOI - PubMed

LinkOut - more resources