. 2025 Mar 4;13(3):430-446.
doi: 10.1158/2326-6066.CIR-24-0189.

Natural Killer Cell-Mediated Cytotoxicity Shapes the Clonal Evolution of B-cell Leukemia

Affiliations

Natural Killer Cell-Mediated Cytotoxicity Shapes the Clonal Evolution of B-cell Leukemia

Michelle C Buri et al. Cancer Immunol Res. .

Abstract

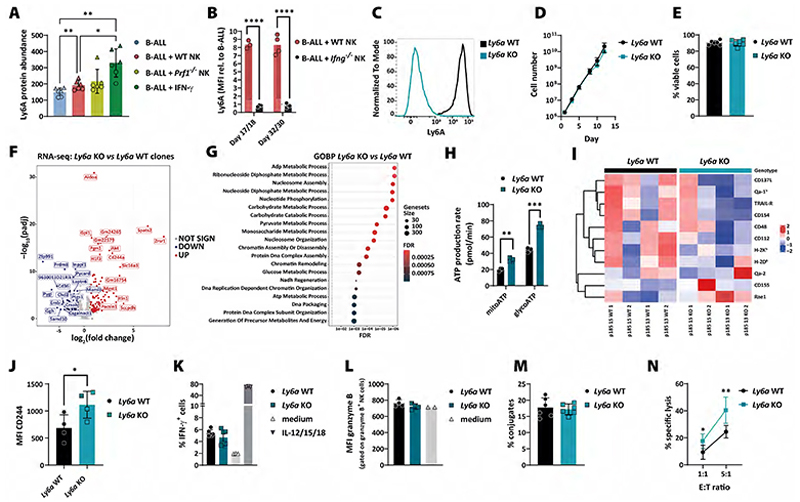
The term cancer immunoediting describes the dual role by which the immune system can suppress and promote tumor growth and is divided into three phases: elimination, equilibrium, and escape. The role of NK cells has mainly been attributed to the elimination phase. Here, we show that NK cells play a role in all three phases of cancer immunoediting. Extended co-culturing of DNA-barcoded mouse BCR/ABLp185+ B-cell acute lymphoblastic leukemia (B-ALL) cells with NK cells allowed for a quantitative measure of NK cell-mediated immunoediting. Although most tumor cell clones were efficiently eliminated by NK cells, a certain fraction of tumor cells harbored an intrinsic primary resistance. Furthermore, DNA barcoding revealed tumor cell clones with secondary resistance, which stochastically acquired resistance to NK cells. NK cell-mediated cytotoxicity put a selective pressure on B-ALL cells, which led to an outgrowth of primary and secondary resistant tumor cell clones, which were characterized by an IFNγ signature. Besides well-known regulators of immune evasion, our analysis of NK cell-resistant tumor cells revealed the upregulation of genes, including lymphocyte antigen 6 complex, locus A (Ly6a), which we found to promote leukemic cell resistance to NK cells. Translation of our findings to the human system showed that high expression of LY6E on tumor cells impaired their physical interaction with NK cells and led to worse prognosis in patients with leukemia. Our results demonstrate that tumor cells are actively edited by NK cells during the equilibrium phase and use different avenues to escape NK cell-mediated eradication.


Conflict of interest statement

Competing interest declaration: The authors declare no competing interests.

Figures

Figure 1
Figure 1. Co-culture system to study cancer immunoediting in vitro.
(A) Scheme illustrates the experimental setup: BCR/ABLp185+ B-ALL leukaemic cells (LCs) are transduced with a DNA barcode library. Barcoded LCs are co-cultured with NK cells for 4-20 days in vitro. (B) Ten B-ALL cell lines were generated from C57BL/6 WT mice and characterised regarding the surface expression of NK cell receptor ligands (black) and their susceptibility towards NK cell killing (red, depicted here is the cytotoxicity at E:T=10:1) measured by flow cytometry. Shown is the summary of 2 independent experiments. Cell lines #13 and #15, in blue, showed the highest NK cell susceptibility and were used for the following experiments. Rows were centred; unit variance scaling was applied to rows. Both rows and columns were clustered using correlation distance and average linkage. (C) B-ALL cell lines were DNA barcoded by lentiviral transduction. Using different amounts of viral supernatant, the optimum transduction efficiency of <5% GFP+ cells (17) was chosen to allow a single barcode integration per cell. Shown are means±SD (n=2) of one cell line. (D) Two B-ALL cell lines (#13 and #15) were barcoded and the barcode diversity of the FACS purified GFP+ cell lines was determined by targeted DNA sequencing. Cell lines A and B were derived from #13 and cell lines C and D from #15. Bars show barcode diversity of barcoded tumour cell lines (A&D n=3 and B&C n=2 independent experiments, each determined by sequencing of 3 biological and 2 technical replicates). Shown is the median with interquartile range. (E) Barcoded WT B-ALL cell lines A-D were cultivated in 3 individual wells either in the absence or presence of purified and IL-2-activated NK cells. One B2m-/- B-ALL cell line was included as positive control for NK cell killing. Absolute numbers of B-ALL cells were determined by flow cytometry. On day 0, 4 and 14, B-ALL cells were FACS sorted, re-plated and fresh NK cells were replenished. Shown are means±SD of n=4 B-ALL cell lines of one representative experiment (n=3 independent experiments); the significance was calculated by an unpaired t-test on day 4, 14 and 20. (F) On day 29, a 4-hour NK cytotoxicity assay was performed using B-ALL cells that had been cultured for 20 days in the presence or absence of NK cells. Shown are means±SD of n=4 cell lines (in technical triplicates) of one representative experiment (n=3 experiments); the significance was calculated by a paired t-test.
Figure 2
Figure 2. Quantification of NK cell-mediated cancer immunoediting in vitro.
(A) Schematic representation of the proposed model. Scheme was created in BioRender. Kovar, H. (2023) BioRender.com/j11m245. (B) Upon long-term co-culture of B-ALL and NK cells, we hypothesised that each tumour cell clone would fall into one of the following categories: The abundance of a clone can be significantly higher (primary resistant) or lower (eliminated), unchanged (static) or show a high variability (secondary resistant) upon NK cell co-culture. Variability is defined as v = log2(max(x + 1)/min(x + 1)), where x is a vector of normalised counts across samples. A rule-based decision tree was designed to discriminate the four categories depicted in (A). (C) The percentage of the cell clones in each group on day 14 is depicted for cell lines A, B, C and D. Shown are the mean values of n=2-3 independent experiments, where each individual data point represents the mean value (n=3 wells, sequenced in duplicates) of one experiment. (D) The heatmap shows the normalised abundance of barcodes (norm. BC abundance) of cell line A from one representative experiment (n=2-4 cell lines, 4 independent experiments). Each subcolumn (n=3) in the figure represents a sample (well), and each row represents a barcode. The barcodes were divided into the four pre-defined groups according to the criteria defined in (B). The Shannon diversity index (shown above the heatmap) serves as measure of barcode diversity and drops significantly after 14 days of NK cell co-culture. The histogram on the left shows the average abundance of the barcoded cell clone in the B-ALL only samples on day 4. (E) The bubble plot depicts the normalised abundance of secondary resistant clones in B-ALL samples (day 4) compared to B-ALL + NK samples (day 14). The x-axis shows the 3 individual wells of each condition, while each row on the y-axis shows an individual tumour cell clone. The size and colour of the bubbles indicate the normalised barcode abundance. Shown is the same cell line and experiment as in (D). (F) Comparing 2 independent experiments in cell line A as shown in (D&E), the Euler diagrams highlight a high overlap of eliminated, primary resistant, and static cell clones. In contrast, only 2 secondary resistant clones were shared between both independent experiments.
Figure 3
Figure 3. Integrative analysis of RNA and ATAC sequencing shows well-known and novel genes deregulated in NK cell resistant B-ALL cells.
The (A-D and G) transcriptome and (E-I) chromatin accessibility analysis of B-ALL cells co-cultured with NK cells for 4 (time point 1 (TP1)) or 14 (TP2) days were analysed and compared to the B-ALL alone cells on TP1 (n=3-4 independent experiments). (A) The volcano plot shows the significantly up- or downregulated genes in B-ALL cell lines A and B after co-culture with NK cells for 14 days (n=3 experiments). Statistics were calculated with the Wald test. (B) The dot plot illustrates the enrichment analysis using the hyperR tool (28) for the Gene Ontology Biological Process (GOBP) terms associated with NK cell co-cultured B-ALL cells shown in panel (A). X-axis and dot colour depicts the false discovery rate (FDR) and y-axis the corresponding biological processes. Dot size illustrates the number of genes associated with the biological processes. (C) The Euler diagrams display up- or downregulated genes in cell lines A/B and/or C/D after 14 days of NK cell co-culture. (D) The heatmap shows the expression of selected overlapping genes (top-20 upregulated, top-10 downregulated; ranked by p-value) identified in (C) (n=3-4 experiments, 4 B-ALL cell lines). The row-scaled normalised counts represent the log2(fold change). (E) The volcano plot shows DARs in B-ALL cells A/B after co-culture with NK cells for 14 days (n=3 experiments). Statistics were calculated with the Wald test. (F) The Euler diagrams highlight genes whose promoters (TSS ± 3kb) had higher or lower chromatin accessibility in cell lines A/B and/or C/D after 14 days of NK cell co-culture in n=3-4 experiments. Gene promoters with the highest log2(fold change) are highlighted. (G) Integration of RNA and ATAC sequencing data shows that 37 genes are up- and 16 downregulated in cell lines A/B; the top 10 up- or downregulated genes are highlighted on the right. (H) Analysis of differential transcription factors activity using (diffTF) (38) highlighted activator (green) and repressor (red) TFs that were differentially expressed in B-ALL cell lines A/B after NK cell co-culture. (I) Integrative Genomics Viewer (IGV) genome browser tracks display representative ATAC sequencing signal densities (n=3 experiments) at the Ly6a and Plaat3 loci in B-ALL cells with or without NK cell co-culture. Shown are the gene bodies including a 3 kb upstream promoter region, as well as binding sites of TFs identified in (H). Database HOCOMOCO (v10) (39) was used and depicted are counts per million (CPM) with a range of [0-1.37].
Figure 4
Figure 4. The combination of NK cell cytotoxicity and IFN-γ production drives tumour immunoediting.
(A&C) Barcoded B-ALL cell lines (n=2 cell lines A/D) were cultivated in 3 individual wells either in the absence or presence of purified and IL-2-activated WT, (A) Prf1-/- or (C) Ifng-/- NK cells. Absolute numbers of B-ALL cells were determined by flow cytometry. On day 0, 4 and 14/17 B-ALL cells were FACS sorted, re-plated and fresh NK cells were replenished. (A) Shown are means±SD of n=2 cell lines. The significance was calculated with the Kruskal-Wallis test and Dunn´s multiple comparisons testing. (C) Shown is one cell line (n=2) of 2 independent experiments. (B&D) On the last day of the NK cell co-culture experiment, a 4-hour NK cytotoxicity assay with WT NK cells was performed using B-ALL cells that had been cultured for 4 weeks in the presence or absence of NK cells. Statistics were calculated for the highest E:T ratio with one-way ANOVA with Tukey´s multiple comparisons test. (B) Shown are means±SD of technical triplicates. (D) Shown are means±SD of technical duplicates. (E&G) The Shannon diversity of leukaemic clones dropped significantly (p=0.02) upon co-culture with WT NK cells, and to a lesser degree with (E) Prf1-/- or (G) Ifng-/- NK cells. Shown is the mean and dots depict each replicate. Statistics were calculated with the Kruskal-Wallis and Dunn´s multiple comparisons testing. (F&H) The barcodes within each sample were classified according to the decision tree in Figure 2B. The barcodes that were attributed to the four pre-defined groups were compared between the treatment groups with Euler diagrams for each group [eliminated, resistant (1st), resistant (2nd) and static]. (I&J) The Euler diagrams display the number of up- and downregulated genes in cell lines A/D after 14 days of co-culture with WT or Prf1-/- NK cells. Top 10 up- or downregulated genes in the intersection or specific for WT or Prf1-/- NK cell co-culture are depicted in the corresponding lists. (K) The volcano plot depicts DEGs in B-ALL + WT NK versus B-ALL + Ifng-/- NK conditions on day 17 of cell line A. (L) The Euler diagram depicts DEGs when comparing B-ALL + WT or B-ALL + Ifng-/- NK conditions with B-ALL alone. Top 10 WT NK cell specific genes and the 3 overlapping genes are depicted in the corresponding lists. Shown is (A, B, I, J) one experiment including n=2 cell lines A/D or (C-H, K, L) one experiment from cell line A. Data in (A-D) is representative for 2 independent experiments and n=2 cell lines.
Figure 5
Figure 5. The role of mouse Ly6A in the evasion of leukaemic cells from NK cell-mediated surveillance.
(A) The bar graph shows the protein abundance of Ly6A on day 14 of the same co-culture experiments as described in Figure 4A with continuous IFN-γ treatment as additional condition. Two B-ALL cell lines (A in circles/D in triangles) were analysed by mass spectrometry in triplicates. Bars and error bars represent means of arbitrary units (AU) relative to the whole protein abundance ±SD; the significance was calculated by one-way ANOVA with Tukey´s multiple comparisons test. (B) Ly6A surface expression was measured on B-ALL cells co-cultured with WT or Ifng-/- NK cells for 17/18 or 32/30 days. Bars represent means (n=3-4 for cell line D from 2 independent experiments); statistics were calculated using an unpaired t-test. (C) Ly6a KO clones were generated by CRISPR/Cas9 genome editing in parental B-ALL cell lines. The gene modification was verified by measuring Ly6A surface expression by flow cytometry. Histogram shows the Ly6A expression in one representative Ly6a WT and KO clone (n=4). (D) Growth curve of Ly6a WT and KO B-ALL clones in absolute cell numbers over 13 days. Shown are means±SD of n=2 clones per genotype, measured in technical duplicates. (E) Cell viability of Ly6a WT and KO B-ALL clones. Shown are means±SD of n=2 clones per genotype of n=3 independent experiments. (F) The volcano plot shows DEGs (n=342) of Ly6a WT and KO clones (n=2 clones per genotype, sequenced in technical triplicates) under normal culturing conditions. Differentially up- or downregulated genes are depicted in red and blue, respectively. Statistics were calculated with the Wald test. (G) The dot plot illustrates the GOBP terms associated with Ly6a-deficiency in B-ALL cells shown in panel (F). X-axis and dot colour depicts the false discovery rate (FDR) and y-axis the corresponding biological processes. Dot size illustrates the number of genes associated with the biological processes. (H) An ATP rate assay was performed in Ly6a WT and KO cells. Bar graph depicts means±SD of mitochondrial and glycolytic ATP production; the significance was calculated using an unpaired t-test. (I) Ly6a WT and KO B-ALL cell lines (n=4 per genotype) were characterised by their surface expression of NK cell receptor ligands by flow cytometry. Columns represent different tumour cell clones ordered according to genotype and cell line. Data has been scaled and clustered by row to highlight variations in marker expression across different samples. Red indicates higher and blue lower expression levels of surface ligands. (J) The expression of CD244 on the surface of Ly6a WT and KO clones was determined by flow cytometry. The bars and error bars represent the mean±SD of the MFIs of n=2 clones per genotype and 2 independent experiments. Statistics were calculated using an unpaired t-test. (K) IFN-γ-producing mNK cells upon co-culture with Ly6a WT and KO B-ALL cell lines for 4 hours (n=2 clones per genotype and technical triplicates) were measured by flow cytometry. As positive control mNK cells were activated with IL-12/15/18. (L) Granzyme B production in freshly isolated NK cells was determined after co-culture with Ly6a WT and KO clones for 4 hours. Shown are means±SD of n=2 clones per genotype and 2 independent experiments. (M) Ly6a WT and KO B-ALL cell lines were co-incubated with WT NK cells for 10 min before the flow cytometric-based assessment of tumour-NK cell conjugate formation (n=6 clones per genotype). Shown is one representative experiment (n=3 experiments with n=2-6 clones per genotype). (N) A 4-hour NK cytotoxicity assay was performed using Ly6a WT and KO B-ALL clones. Shown are means±SD of n=2 clones per genotype and 3 independent experiments; statistics were calculated using an unpaired t-test.
Figure 6
Figure 6. The role of human LY6E in the evasion of leukaemic cells from NK cell-mediated surveillance.
(A) The Kaplan-Meier plot depicts survival probabilities of the TARGET-ALL-P2 patient cohort divided into LY6E high and low expressing groups (cut-off percentile = 60%). The graph was generated by the online web tool: cSurvival (ubc.ca). (B) LY6E WT and KO K562 clones were analysed for their expression of LY6E in the absence or presence of IFN-β (upper panel) or IFN-γ (lower panel) by Western blotting. β-actin served as loading control. (C) The volcano plot shows DEGs (n=829) of LY6E WT and KO K562 clones under normal culturing conditions (n=2 clones per genotype, sequenced in technical triplicates). Differentially up- or downregulated genes are depicted in red and blue, respectively. Statistics were calculated with the Wald test. (D) The dot plot illustrates the GOBP terms associated with LY6E-deficiency in K562 cells shown in panel (C). X-axis and dot colour depicts the false discovery rate (FDR) and y-axis the corresponding biological processes. Dot size illustrates the number of genes associated with the biological processes. (E) Growth curve of LY6E WT and KO K562 clones in absolute cell numbers over 14 days. Shown is one clone per genotype, representative of 2 clones. (F) Cell viability of LY6E WT and KO K562 clones. Shown are means±SD of n=2 cell lines per genotype and 3 independent experiments. (G) A 1-hour NK cytotoxicity assay was performed using LY6E WT and KO K562 clones. Shown are means±SD of technical duplicates of n=2 clones per genotype and 2 independent experiments using NK cells isolated from 2 different donors. Statistics were calculated using an unpaired t-test. (H) LY6E WT and KO clones were co-incubated with NK cells and the tumour-NK cell conjugate formation was assessed by flow cytometry. Bars and error bars represent means±SD of n=2 clones per genotype and 4 independent experiments using NK cells isolated from 4 different donors. Statistics were calculated using an unpaired t-test.

References

    1. Gubin MM, Vesely MD. Cancer Immunoediting in the Era of Immuno-oncology. Clin Cancer Res. 2022;28:3917–28. doi: 10.1158/1078-0432.CCR-21-1804. - DOI - PMC - PubMed
    1. Dunn GP, Bruce AT, Ikeda H, Old LJ, Schreiber RD. Nat Immunol. Vol. 3. Nature Publishing Group; 2002. Cancer immunoediting: from immunosurveillance to tumor escape; pp. 991–8. - PubMed
    1. Wolf NK, Kissiov DU, Raulet DH. Nat Rev Immunol. Vol. 23. Nature Publishing Group; 2023. Roles of natural killer cells in immunity to cancer, and applications to immunotherapy; pp. 90–105. - PubMed
    1. Metkar SS, Wang B, Aguilar-Santelises M, Raja SM, Uhlin-Hansen L, Podack E, et al. Immunity. Vol. 16. Elsevier; 2002. Cytotoxic Cell Granule-Mediated Apoptosis: Perforin Delivers Granzyme B-Serglycin Complexes into Target Cells without Plasma Membrane Pore Formation; pp. 417–28. - PubMed
    1. Prager I, Watzl C. Mechanisms of natural killer cell-mediated cellular cytotoxicity. J Leukoc Biol. 2019;105:1319–29. - PubMed