. 2024 Dec 5;31(12):1831-1846.e9.
doi: 10.1016/j.stem.2024.10.016.

Generating human neural diversity with a multiplexed morphogen screen in organoids

Affiliations

Generating human neural diversity with a multiplexed morphogen screen in organoids

Neal D Amin et al. Cell Stem Cell. .

Abstract

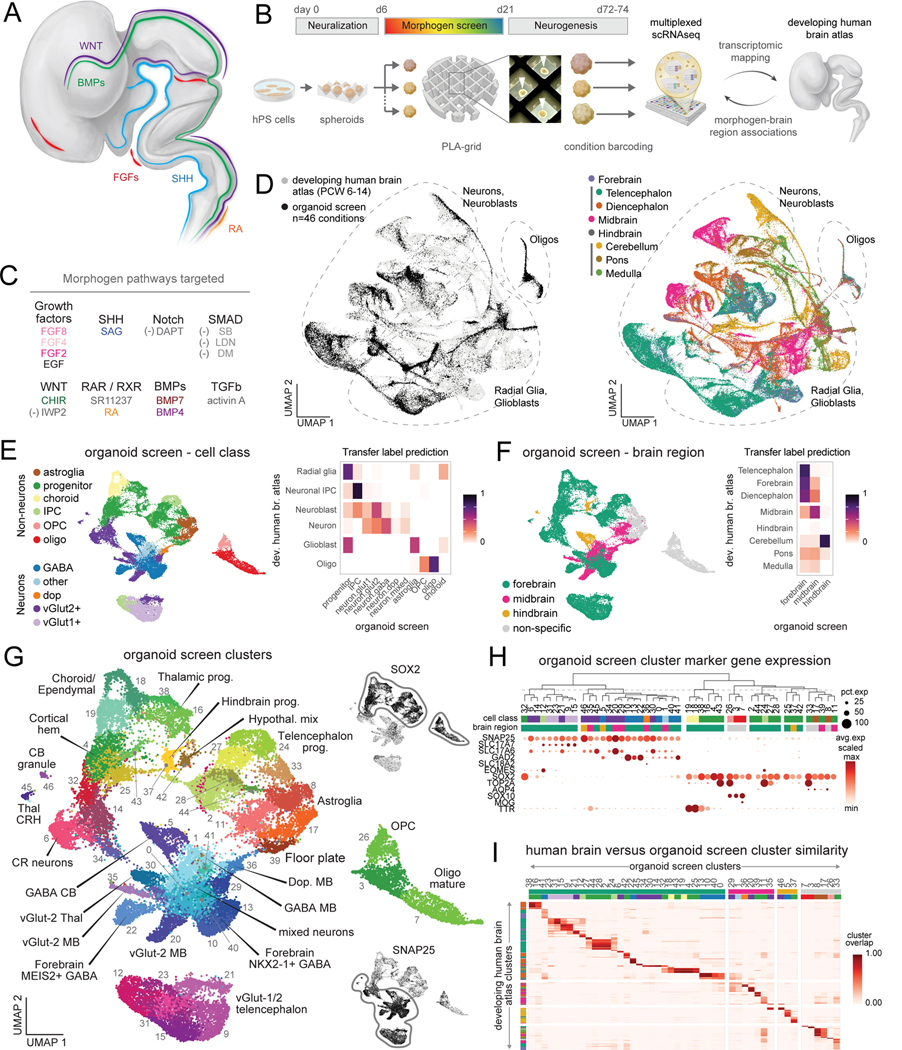
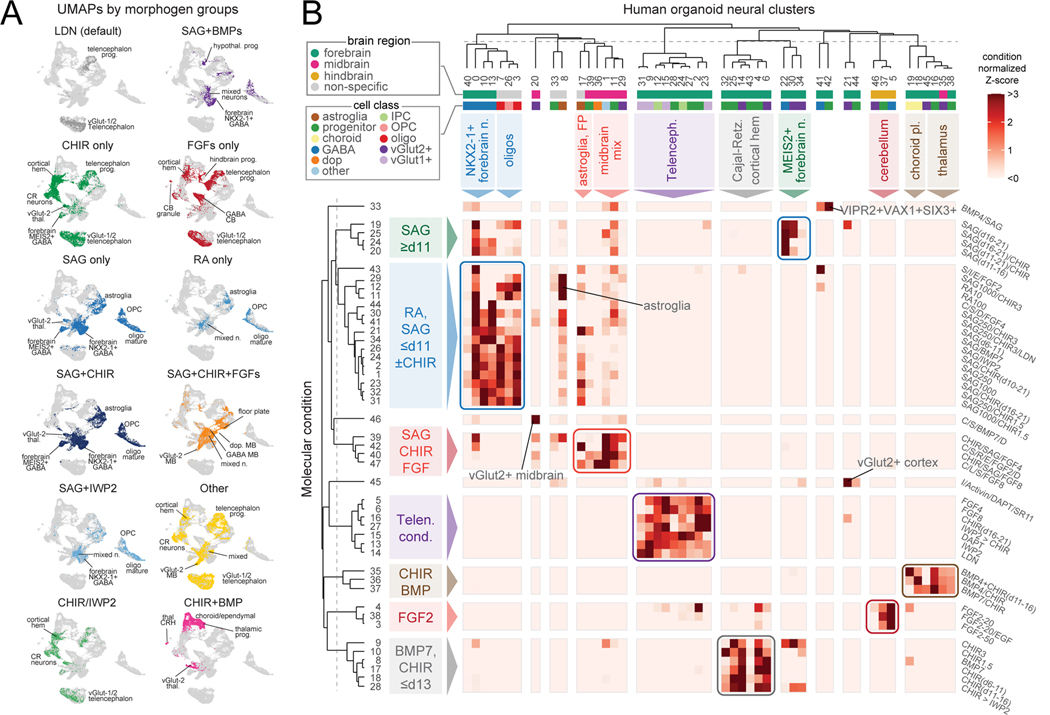
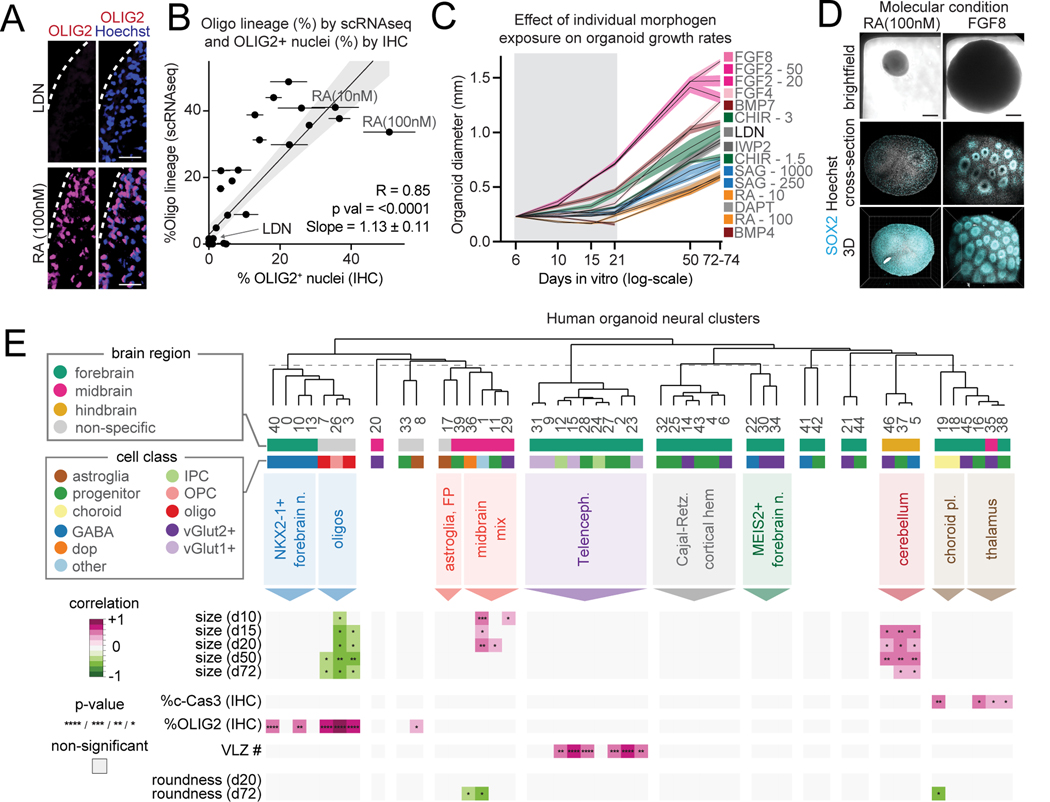
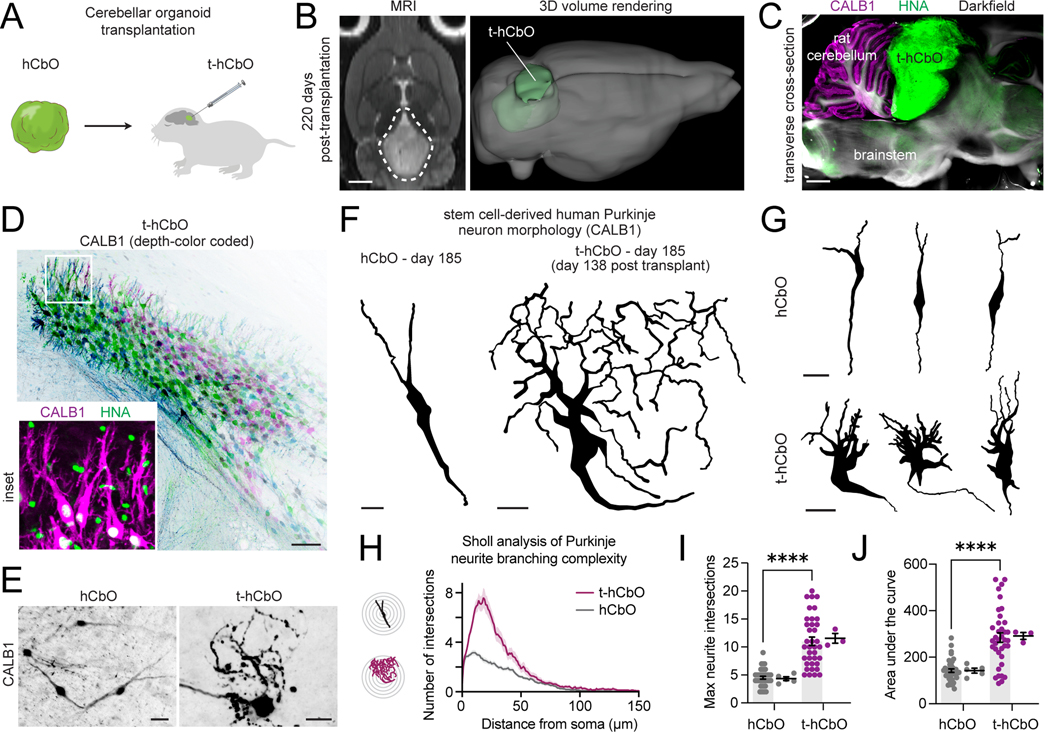
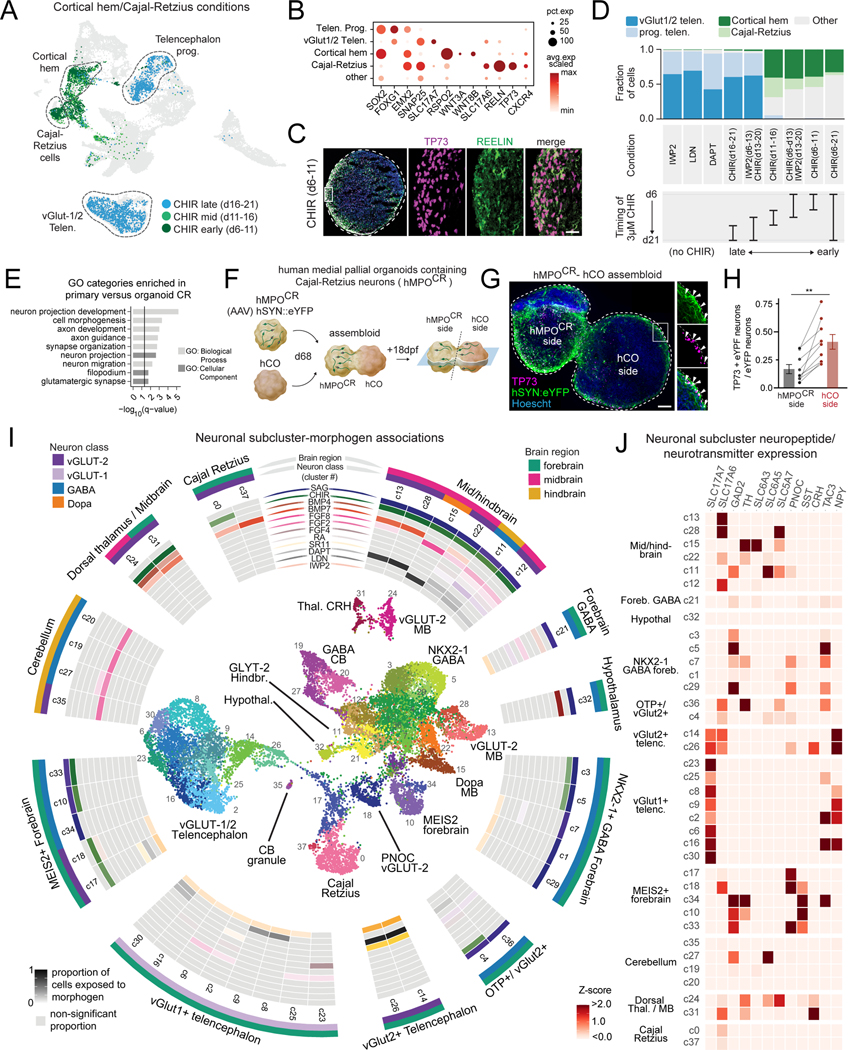
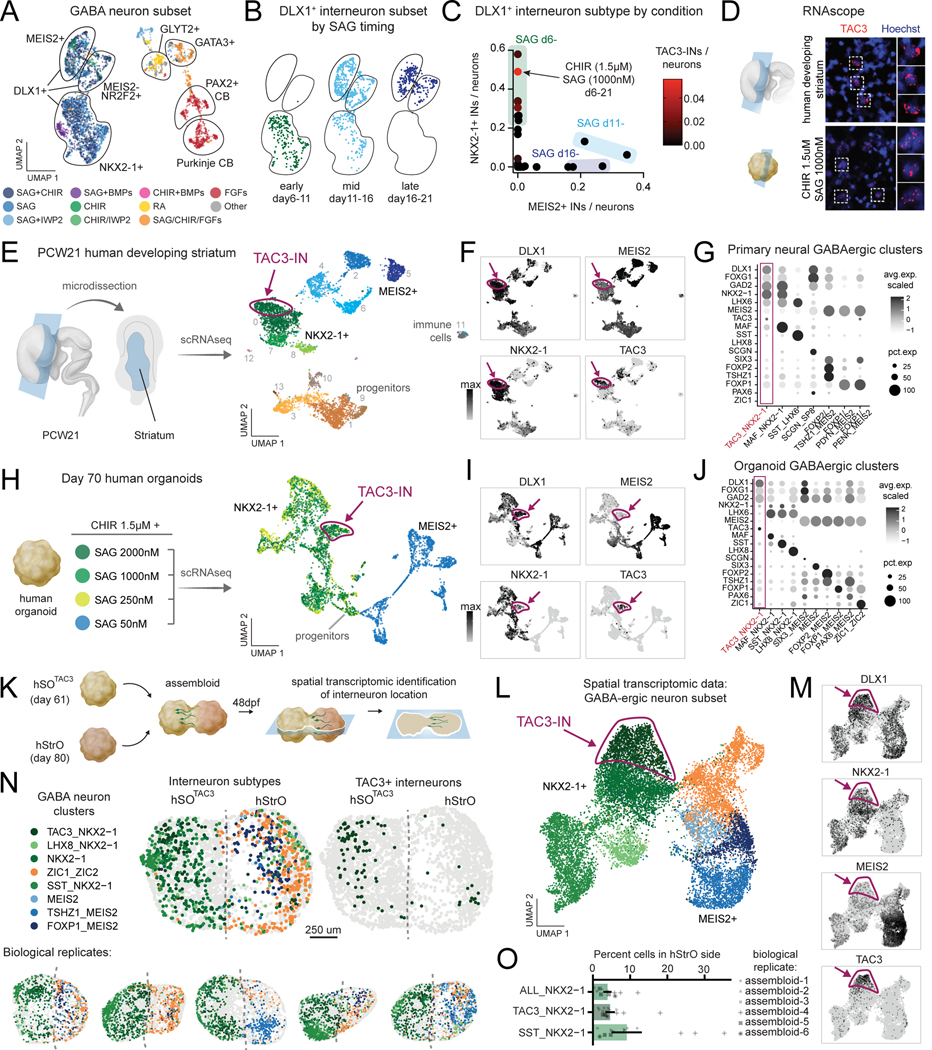
Morphogens choreograph the generation of remarkable cellular diversity in the developing nervous system. Differentiation of stem cells in vitro often relies upon the combinatorial modulation of these signaling pathways. However, the lack of a systematic approach to understand morphogen-directed differentiation has precluded the generation of many neural cell populations, and the general principles of regional specification and maturation remain incomplete. Here, we developed an arrayed screen of 14 morphogen modulators in human neural organoids cultured for over 70 days. Deconvolution of single-cell-multiplexed RNA sequencing data revealed design principles of brain region specification. We tuned neural subtype diversity to generate a tachykinin 3 (TAC3)-expressing striatal interneuron type within assembloids. To circumvent limitations of in vitro neuronal maturation, we used a neonatal rat transplantation strategy that enabled human Purkinje neurons to develop their hallmark complex dendritic branching. This comprehensive platform yields insights into the factors influencing stem cell-derived neural diversification and maturation.

Keywords: Purkinje neuron; morphogens; multiplexed screen; organoids; single-cell RNA-seq; transplantation.


Conflict of interest statement

Declaration of interests G.N. was an employee of Daiichi-Sankyo Co., Ltd, when performing the experiments for this study; however, the company did not have any input and interpretation on the design of experiments and the data. Stanford University holds patents that cover the generation of regionalized neural organoids.

Figures

Figure 1.
Figure 1.. Generation of human neural diversity with a multiplexed morphogen screen in organoids.
(A) Schematic of morphogen expression in the developing human fetal nervous system (adapted from ). (B) Diagram of the arrayed screening platform. White arrowheads indicate human brain organoids within the polylactic acid (PLA) grid. (C) Molecules used to modulate morphogen pathways. “(−)” denotes pathway inhibitor. SAG, Smoothened agonist; RA, retinoic acid; DM, dorsomorphin; SB, SB-431542; LDN, LDN-193189; SR11, SR11237; FGF, fibroblast growth factor; EGF, epidermal growth factor; SHH, sonic hedgehog; TGF, transforming growth factor; BMP, bone morphogenic protein; CHIR, CHIR99021. (D) UMAP of integrated cellular profiles from organoid morphogen screen and human fetal brain atlas colored by dataset (left) and fetal brain region (right). (E) Left: UMAP visualization of major cell class annotations. Right: overlap of label transfer predictions from primary human fetal reference scRNA-seq data .Overlap values are normalized across rows. (F) Left: UMAP visualization of brain regions annotations. Right: overlap of label transfer prediction from primary human fetal reference scRNA-seq data .Overlap values are normalized across rows. (G) Annotated clusters of neural cells from all organoid screen conditions. Insets show gene expression of indicated markers. (H) Dot plot of cell class gene expression in single cell clusters from all organoid conditions. Top: hierarchical clustering based on top 20 cluster marker genes. (I) Heatmap of cluster overlap between integrated primary and organoid cell clusters. Cluster overlap score of 1 indicates perfect cluster overlap in the integrated dataset. Primary fetal clusters with cluster overlap < 0.25 to organoid clusters are not shown.
Figure 2.
Figure 2.. Deconvoluting morphogen modulators driving cellular composition.
(A) UMAP visualization of cells from aggregated molecular conditions sharing the indicated molecule(s). (B) Heatmap of cell composition (normalized by total number of cells in each condition) by molecular condition and scRNA-seq cluster. Groups of conditions that similarly contribute to sets of single cell clusters are color-coded and annotated. Dendrograms based on hierarchical clustering.
Figure 3.
Figure 3.. Cytoarchitectural features associated with morphogen application and cell composition.
(A) Immunohistochemistry of OLIG2 expression in d72 organoids treated with LDN or 100nM retinoic acid (RA). (25 nm, scale bar) (B) Scatter plot of the percentage of OLIG2+ nuclei by IHC versus percentage of oligodendrocytes by scRNA-seq in organoids from each condition. (mean, standard error, linear regression, 95% confidence interval) (C) Mean organoid diameter from conditions exposed to a single molecule (standard error) over time. One condition treated with BMP4 alone decreased in size and disintegrated. (D) Brightfield and CUBIC-cleared organoids from FGF8 and 100nM RA-treated d72 organoids. (scale bar, 0.2mm) (E) Multiple correlation of quantitative organoid cytoarchitectural and immunohistochemical features with the relative contribution to organoid neural clusters across conditions. Only associations that pass BH-corrected P-value cut-offs are shown *<0.05, **<0.01, ***<0.001, ****<0.0001 Pearson correlation.
Figure 4.
Figure 4.. Generation of human cerebellar organoids.
(A) Label transfer prediction scores of primary cerebellar populations to scRNA-seq data identifies Purkinje neurons, PAX2+ interneurons, and granule cells. (B) UMAP highlighting cells originating from three conditions exposed to FGF2 generating high numbers of cerebellar cells. (C) Quantification of cell proportions by scRNA-seq in the indicated conditions. (D) Quantification of Purkinje neuron proportions by immunohistochemistry in the indicated conditions. (mean ± SEM, unpaired ANOVA, ***p < 0.0001). (E) Immunohistochemistry for Purkinje neuron transcription factor markers SKOR2 and TFAP2A at day 72. Scale bar, 25 nm. (F) UMAP visualization of clustered and integrated hCbO cells from new differentiations (n= 13,040 cells; n=3 hiPS cell lines, day 80). Insets show cells from each hiPS cell line. (G) Dot plot of cluster marker gene expression in indicated clusters. Cyc_prog: cycling progenitors; Prog.: progenitors; RL: rhombic lip; GCP: granule cell progenitors; GC: granule cells; PAX2-IN: PAX2+ interneurons; CN: cerebellar nuclei; UBC: unipolar brush cells; Exc_hindb.: excitatory hindbrain neurons; BG: Bergmann glia. (H) Cell type proportions across hCbO hiPS cell lines colored by clusters. (I) Gene Ontology (GO) term enrichment analysis of genes significantly upregulated in primary developing human Purkinje neurons compared with hCbO Purkinje neurons (adjusted P < 0.05, fold change > 2, expressed in at least 10% of cells). (J) Immunohistochemical identification of Purkinje neuron morphology at 8 months of differentiation. Scale bar, 9 nm.
Figure 5.
Figure 5.. Complex dendritic morphology of stem cell-derived human Purkinje neurons after rat transplantation.
(A) Schematic of the experimental design. hCbO generated from hiPS cells are transplanted at days 41–48 of differentiation into the cerebellar cortex of newborn athymic rats. (B) Left: horizontal view T2-weighted MRI images showing t-hCbO in the cerebellum at 220 days post-transplantation. Scale bar, 2 mm. Right: 3D MRI volume reconstruction. (C) Vibratome-sectioned rat brain after tissue clearing and immunostaining for HNA and CALB1. Scale bar, 2 mm. (D) Cluster of HNA+ human Purkinje neurons within t-hCbO immunostained for CALB1 (depth-color coded). Scale bar, 50nm. (E) Representative z-projection of stem cell-derived human Purkinje neurons. Scale bar, 30nm. (F) Representative reconstructions of CALB1 neurite tracing of human Purkinje neurons at day 185 of differentiation (day 138 post-transplantation for t-hCbO) Scale bar, 15nm. (G) Additional representative reconstructions shown. (H) Sholl analysis of human Purkinje neurite branching complexity. Data are presented as mean ± s.e.m. (n = 39, 38 neurons traced from hCbO and t-hCbO; n = 5 hCbO organoids, 3 t-hCbO (transplanted rats)). (I) Maximum neurite intersections by neuron replicates (left) and by organoid replicates (right) (****P < 0.0001). (J) Area under the curve of Sholl analysis by neuron replicates (left) and by organoid replicates (right) (****P < 0.0001).
Figure 6.
Figure 6.. Deconvolution of morphogen features generating migratory Cajal-Retzius cells and human neural diversity.
(A) UMAP highlighting cells from three conditions exposed to the WNT activator CHIR for 5 days at sequential time windows. (B) Dot plot of marker gene expression in select clusters. (C) Immunohistochemistry of CR cell transcription factor marker TP73 and cytoplasmic marker REELIN in organoid cryosection. Scale bar, 30 nm. (D) Quantification of cell composition from scRNAseq data, arranged by timing of CHIR application. (E) Gene Ontology (GO) term enrichment analysis of genes significantly upregulated in primary human versus organoid Cajal-Retzius cells. (adjusted P < 0.05, fold change > 2, expressed in at least 10% of cells). (F) Schematic of the experimental design. Virally labeled hMPOCR cells and unlabeled hCO to make assembloids (day 86, 18 days post fusion (dpf)). (G) Immunohistochemistry of representative hMPOCR-hCO assembloid. Insets show TP73+eYFP+ CR cells originated from hMPOCR that migrated into hCO. Scale bar, 50 nm. (H) Fraction of TP73+eYFP+ neurons of all eYFP+ neurons per each side of assembloid (n = 9 assembloids, s.e.m. shown, Wilcoxon matched-pairs signed rank test, ** P = 0.0039). (I) Inside: UMAP visualization of neuron-subset clusters. Outside: Neuronal scRNA-seq subclusters visualized in a circular heatmap of statistically significant associations of proportion of cells exposed to each morphogen, based on permutation testing (see Methods). (J) Z-score normalized expression of neurotransmitter-associated genes and neuropeptides in each single neuronal subcluster.
Figure 7.
Figure 7.. Conditions generating hiPS cell-derived TAC3+ striatal interneurons.
(A) UMAP of GABAergic neurons, color coded by aggregate molecular conditions and annotated by gene markers. (B) UMAP of DLX1+ forebrain interneuron clusters annotated by the timing of 250 nM SAG. (C) Scatter plot of percentage of MEIS2+ and NKX2–1+ interneurons generated in each condition. Conditions exposed to SAG early generate high percentages of NKX2–1+ interneurons and low percentage of MEIS2+ interneurons. Conditions are color coded by the percentage of TAC3-INs generated. (D) RNAscope of TAC3 in human primary striatal and organoid cells. (E) Left: diagram of PCW21 micro-dissected human striatum. Right: UMAP of scRNA-seq clusters highlights progenitors, GABAergic interneurons including TAC3-INs, and a small population of immune cells. Cells are color coded by cluster. (F) Interneuron marker gene expression (UMAP) in primary human cells with TAC3-INs highlighted. (G) Dot plot gene expression of previously identified TAC3 and striatal cell type marker genes in subpopulations of primary human fetal cells. (H) Left: diagram of organoid conditions exposed to 1.5 μM CHIR and 4 different concentrations of SAG. Right: UMAP visualization of day 70 scRNA-seq organoid conditions. Cells are color coded by condition. (I) Interneuron marker gene expression (UMAP) in human organoids with TAC3-INs highlighted. (J) Dot plot gene expression of previously identified TAC3 and striatal cell type marker genes in subpopulations of organoid cells. (K) Schematic of the experimental design. hSOTAC3 (day 61) and hStrO (day 80) were integrated to make assembloids. Sections were collected at day 48 post fusion for spatial transcriptomics (MERFISH). (L) UMAP visualization of GABAergic cell clusters from MERFISH of hSOTAC3-hStrO assembloids (n = 14 cryosections, 6 assembloids, n=47,022 cells). (M) GABAergic marker gene expression (UMAP) in assembloids with TAC3-INs highlighted. (N) Representative MERFISH sections annotated by GABAergic cell clusters. (O) Quantification of percent cells of indicated GABAergic cell clusters located in hStrO-side (n=14 cryosections from 6 assembloids). Data are presented as mean ± s.e.m.

Update of

References

    1. Kelley KW, and Pasca SP (2022). Human brain organogenesis: Toward a cellular understanding of development and disease. Cell 185, 42–61. 10.1016/j.cell.2021.10.003. - DOI - PubMed
    1. Lodato S, and Arlotta P. (2015). Generating neuronal diversity in the mammalian cerebral cortex. Annu Rev Cell Dev Biol 31, 699–720. 10.1146/annurev-cellbio-100814-125353. - DOI - PMC - PubMed
    1. Mansour AA, Schafer ST, and Gage FH (2021). Cellular complexity in brain organoids: Current progress and unsolved issues. Semin Cell Dev Biol 111, 32–39. 10.1016/j.semcdb.2020.05.013. - DOI - PubMed
    1. Amin ND, and Pasca SP (2018). Building Models of Brain Disorders with Three-Dimensional Organoids. Neuron 100, 389–405. 10.1016/j.neuron.2018.10.007. - DOI - PubMed
    1. Di Lullo E, and Kriegstein AR (2017). The use of brain organoids to investigate neural development and disease. Nat Rev Neurosci 18, 573–584. 10.1038/nrn.2017.107. - DOI - PMC - PubMed

LinkOut - more resources