

Associations of long-term nitrogen dioxide exposure with a wide spectrum of diseases: a prospective cohort study of 0·5 million Chinese adults
- PMID: 39643329
- PMCID: PMC11626078
- DOI: 10.1016/S2468-2667(24)00264-0
Associations of long-term nitrogen dioxide exposure with a wide spectrum of diseases: a prospective cohort study of 0·5 million Chinese adults
Abstract
Background: Little evidence is available on the long-term health effects of nitrogen dioxide (NO2) in low-income and middle-income populations. We investigated the associations of long-term NO2 exposure with the incidence of a wide spectrum of disease outcomes, based on data from the China Kadoorie Biobank.
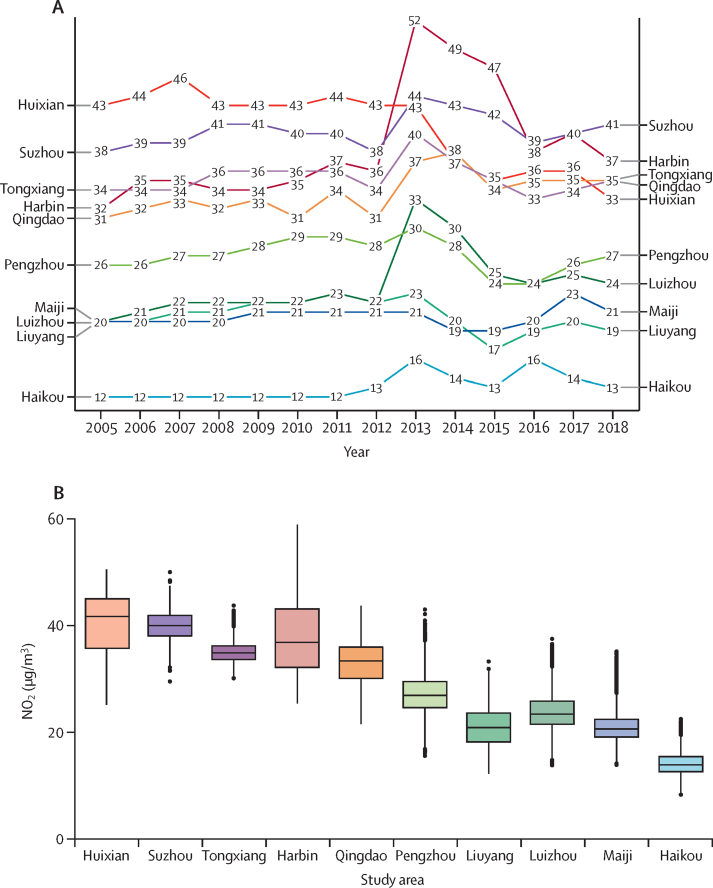
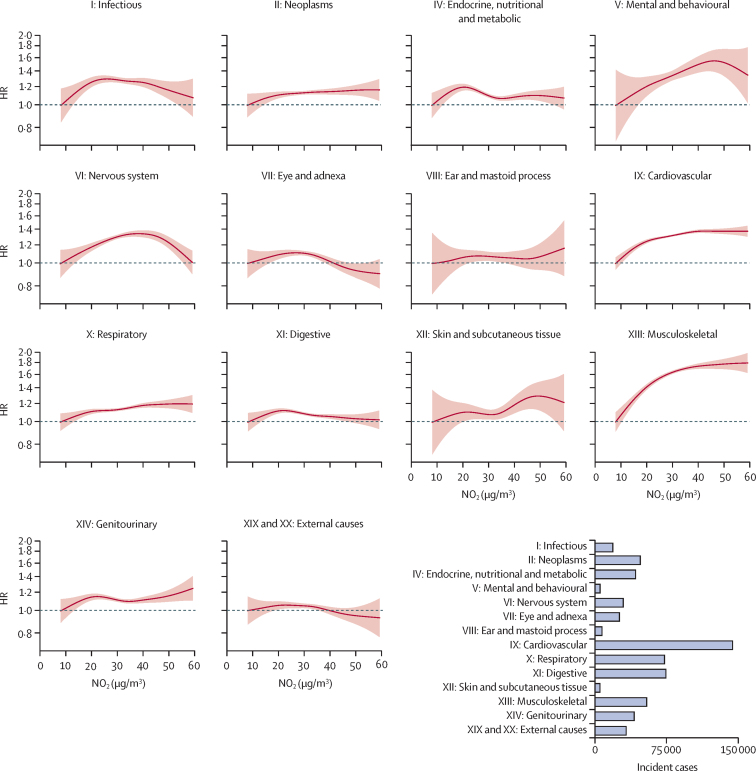
Methods: This prospective cohort study involved 512 724 Chinese adults aged 30-79 years recruited from ten areas of China during 2004-08. Time-varying Cox regression models yielded adjusted hazard ratios (HRs) for the associations of long-term NO2 exposure with aggregated disease incidence endpoints classified by 14 ICD-10 chapters, and incidences of 12 specific diseases selected from three key ICD-10 chapters (cardiovascular, respiratory, and musculoskeletal diseases) found to be robustly associated with NO2 in the analyses of aggregated endpoints. All models were stratified by age-at-risk (in 1-year scale), study area, and sex, and were adjusted for education, household income, smoking status, alcohol intake, cooking fuel type, heating fuel type, self-reported health status, BMI, physical activity level, temperature, and relative humidity.
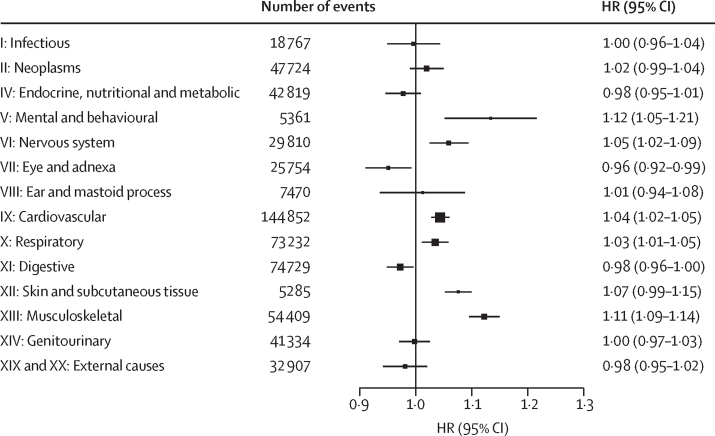
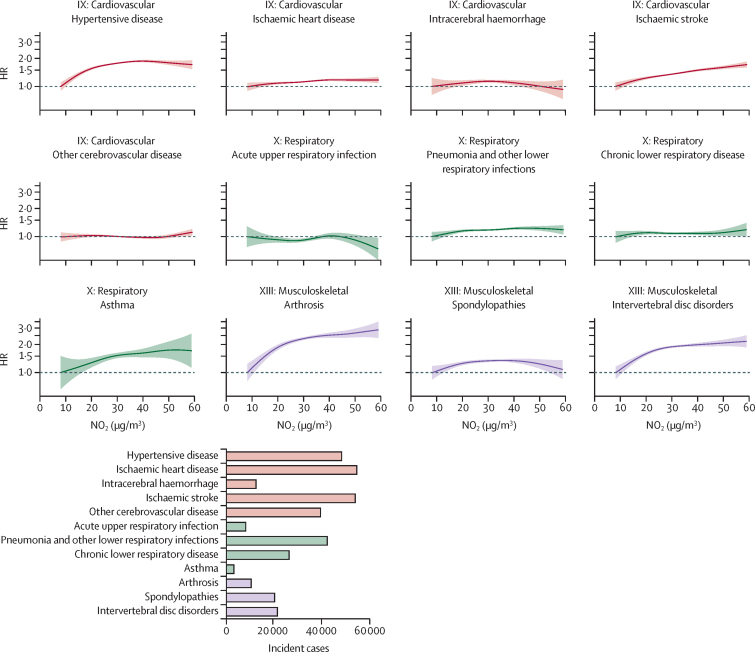
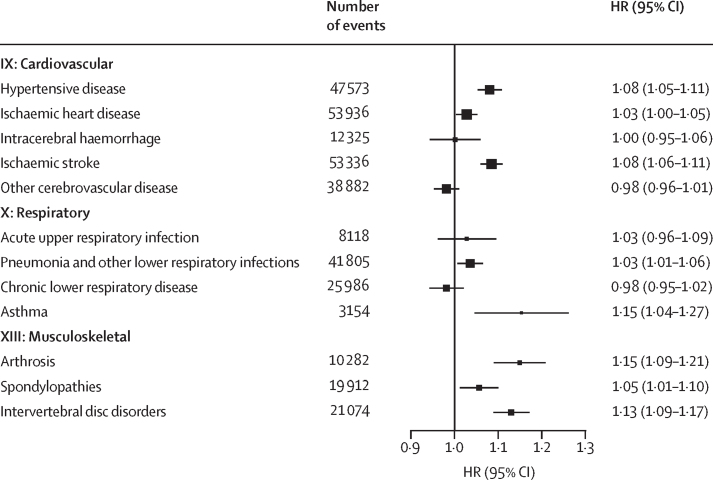
Findings: The analysis of 512 709 participants (mean baseline age 52·0 years [SD 10·7]; 59·0% female and 41·0% male) included approximately 6·5 million person-years of follow-up. Between 5285 and 144 852 incident events were recorded for each of the 14 aggregated endpoints. Each 10 μg/m3 higher annual average NO2 exposure was associated with higher risks of chapter-specific endpoints, especially cardiovascular (n=144 852; HR 1·04 [95% CI 1·02-1·05]), respiratory (n=73 232; 1·03 [1·01-1·05]), musculoskeletal (n=54 409; 1·11 [1·09-1·14]), and mental and behavioural (n=5361; 1·12 [1·05-1·21]) disorders. Further in-depth analyses on specific diseases found significant positive supra-linear associations with hypertensive disease (1·08 [1·05-1·11]), lower respiratory tract infection (1·03 [1·01-1·06]), arthrosis (1·15 [1·09-1·21]), intervertebral disc disorders (1·13 [1·09-1·17]), and spondylopathies (1·05 [1·01-1·10]), and linear associations with ischaemic heart disease (1·03 [1·00-1·05]), ischaemic stroke (1·08 [1·06-1·11]), and asthma (1·15 [1·04-1·27]), whereas intracerebral haemorrhage (1·00 [0·95-1·06]), other cerebrovascular disease (0·98 [0·96-1·01]), acute upper respiratory infection (1·03 [0·96-1·09]), and chronic lower respiratory disease (0·98 [0·95-1·02]) showed no significant association. NO2 exposure showed robust null association with external causes (n=32 907; 0·98 [0·95-1·02]) as a negative control.
Interpretation: In China, long-term NO2 exposure was associated with a range of diseases, particularly cardiovascular, respiratory, and musculoskeletal diseases. These associations underscore the pressing need to implement the recently tightened WHO air quality guidelines.
Funding: Wellcome Trust, UK Medical Research Council, Cancer Research UK, British Heart Foundation, National Natural Science Foundation of China, National Key Research and Development Program of China, Sino-British Fellowship Trust, and Kadoorie Charitable Foundation.
Copyright © 2024 The Author(s). Published by Elsevier Ltd. This is an Open Access article under the CC BY 4.0 license. Published by Elsevier Ltd.. All rights reserved.
Conflict of interest statement
Declaration of interests We declare no competing interests.
Figures
References
-
- HEI Panel on the Health Effects of Long-Term Exposure to Traffic-Related Air Pollution . Health Effects Institute; Boston, MA: 2022. Systematic review and meta-analysis of selected health effects of long-term exposure to traffic-related air pollution.
-
- Chen X, Qi L, Li S, Duan X. Long-term NO2 exposure and mortality: a comprehensive meta-analysis. Environ Pollut. 2024;341 - PubMed
-
- Wei F, Yu Z, Zhang X, et al. Long-term exposure to ambient air pollution and incidence of depression: a population-based cohort study in China. Sci Total Environ. 2022;804 - PubMed
-
- Wang K, Yuan Y, Wang Q, et al. Incident risk and burden of cardiovascular diseases attributable to long-term NO2 exposure in Chinese adults. Environ Int. 2023;178 - PubMed
MeSH terms
Substances
Grants and funding
LinkOut - more resources
Full Text Sources
