. 2024 Dec 6;15(12):884.
doi: 10.1038/s41419-024-07237-w.

Conjugated fatty acids drive ferroptosis through chaperone-mediated autophagic degradation of GPX4 by targeting mitochondria

Affiliations

Conjugated fatty acids drive ferroptosis through chaperone-mediated autophagic degradation of GPX4 by targeting mitochondria

Yusuke Hirata et al. Cell Death Dis. .

Abstract

Conjugated fatty acids (CFAs) have been known for their anti-tumor activity. However, the mechanism of action remains unclear. Here, we identify CFAs as inducers of glutathione peroxidase 4 (GPX4) degradation through chaperone-mediated autophagy (CMA). CFAs, such as (10E,12Z)-octadecadienoic acid and α-eleostearic acid (ESA), induced GPX4 degradation, generation of mitochondrial reactive oxygen species (ROS) and lipid peroxides, and ultimately ferroptosis in cancer cell lines, including HT1080 and A549 cells, which were suppressed by either pharmacological blockade of CMA or genetic deletion of LAMP2A, a crucial molecule for CMA. Mitochondrial ROS were sufficient and necessary for CMA-dependent GPX4 degradation. Oral administration of an ESA-rich oil attenuated xenograft tumor growth of wild-type, but not that of LAMP2A-deficient HT1080 cells, accompanied by increased lipid peroxidation, GPX4 degradation and cell death. Our study establishes mitochondria as the key target of CFAs to trigger lipid peroxidation and GPX4 degradation, providing insight into ferroptosis-based cancer therapy.


Conflict of interest statement

Competing interests: The authors declare no competing interests. Ethics approval and consent to participate: All animal experiments were approved by the ethics committee of Tohoku University (approval number: 2022PhA-008). All procedures were performed in accordance with the Guidelines for Animal Experiments of Tohoku University and the Japanese Government Animal Protection and Management Law. All authors checked the study and agreed to participate in the manuscript. Consent for publication: All authors checked the study and agreed.

Figures

Fig. 1
Fig. 1. CLA/CLNAs with trans double bonds are inducers of ferroptosis.
A HT1080 cells were treated with RA (C18:2 cis-9, trans-11), EA (C18:1 trans-9), LEA (C18:2 trans-9, trans-12), PEA (C16:1 trans-11), TVA (C18:1 trans-11), OA (C18:1 cis-9), or LA (C18:2 trans-9, trans-12) at 200 μM for 24 h, and assayed for cell viability. Data shown are the mean ± SD (n = 3). B, C HT1080 cells were treated with CLAs (10E,12Z (10-CLA), 9Z,11E (RA), 9Z,11Z (ZZ)) (B) and CLNAs (9Z,11E,13Z (PA), 9Z,11E,13E (ESA), 9Z,11Z,13Z (ZZZ)) (C) at the indicated concentrations for 24 h, and assayed for cell viability. Data shown are the mean ± SD (n = 3). D, E HT1080 cells were treated with either 10-CLA, RA (200 μM) (D) PA, or ESA (20 μM) (E) for indicated time and assayed for cell viability (lines) and LDH release (bars). Data shown are the mean ± SD (n = 3). F, G HT1080 cells were pretreated with either a pan-caspase inhibitor z-VAD-fmk (20 µM), Nec-1 (30 µM), Rucaparib (1 µM), Fer-1 (5 µM), DFO (100 µM), or Triacsin C (5 µM), for 0.5 h, treated with either 10-CLA, RA (200 µM), ESA, PA (20 µM) for 24 h, and assayed for cell viability. Data shown are the mean ± SD (n = 3). H, I HT1080 cells treated with either 10-CLA, RA (200 µM), ESA, PA (20 µM), or RSL3 (4 µM) for indicated time and lipid ROS levels were measured with Liperfluo (H) and LipiRADICAL Green (I). Data shown are the mean ± SD (n = 3).
Fig. 2
Fig. 2. CLA/CLNAs trigger ferroptosis independently of DGAT1/2 in HT1080 and A549 cells.
A Relative mRNA levels of ACSL1, ACSL4 in control- or ACSL1/4-knockdown HT1080 cells are shown as mean ± SD (n = 3). B Cell viability of control- or ACSL1/4-knockdown HT1080 cells treated with either 10-CLA (200 μM), ESA (10 μM) or Erastin (20 μM) for 24 h. Data shown are the mean ± SD (n = 3). C, D HT1080 (C) and A549 (D) cells were pretreated with either iDGAT1/2 (10 µM), Triacsin C (5 µM), or Fer-1 (5 µM) for 0.5 h, treated with 10-CLA (100 μM: HT1080, 200 µM: A549) or ESA (10 μM: HT1080, 20 µM: A549) for 24 h, assayed for cell viability. Data shown are the mean ± SD (n = 3).
Fig. 3
Fig. 3. CLA/CLNAs promote lysosomal degradation of GPX4.
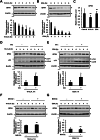
A, B Immunoblot of lysates from HT1080 cells treated with 10-CLA (200 µM) (A) or ESA (20 µM) (B) for indicated time using antibodies against GPX4 and β-actin. Images are cropped for clarity; full-length blots are presented in Supplementary Fig. 13A, B. C HT1080 cells were treated with 10-CLA (200 µM) or ESA (20 µM) for 4 h, and relative mRNA level of GPX4 was measured by qRT-PCR analysis and shown as mean ± SD (n = 3). DG Immunoblot of lysates from HT1080 cells pretreated with chloroquine (CQ: 20 µM) (D, E) or MG132 (5 µM) (F, G) for 0.5 h, and treated with 10-CLA (200 µM) (D, F) or ESA (20 µM) (E, G) for indicated time, using antibodies against the indicated proteins. Images are cropped for clarity; full-length blots are presented in Supplementary Fig. 13C–F.
Fig. 4
Fig. 4. CMA-dependent GPX4 degradation drives ferroptosis in response to CLA/CLNAs.
A, B Immunoblot of lysates from HT1080 cells pretreated with CDDO (5 µM) for 0.5 h and treated with 10-CLA (200 µM) or ESA (20 µM) for indicated time, using antibodies against GPX4 and β-actin. Images are cropped for clarity; full-length blots are presented in Supplementary Fig. 13G, H. C HT1080 cells were pretreated with CDDO (5 µM) or CQ (20 µM) for 0.5 h, treated with 10-CLA (100 µM) or ESA (10 µM) for 24 h, and assayed for cell viability. Data shown are the mean ± SD (n = 3). D HEK293A cells stably expressing Flag-HSC70 and 6Myc-GPX4 were treated with 10-CLA (200 µM) or ESA (200 µM) for 5 h, in the presence or absence of CQ (20 µM) and CDDO (5 µM). Lysates were immunoprecipitated with anti-Flag antibody and subjected to immunoblot analysis using antibodies against the indicated proteins. Images are cropped for clarity; full-length blots are presented in Supplementary Fig. 13I.
Fig. 5
Fig. 5. CLA/CLNAs promote GPX4 degradation in a LAMP2A-dependent manner.
A, B Immunoblot of lysates from WT and LAMP2A KO HT1080 cells pretreated with CDDO (5 µM) for 0.5 h and treated with 10-CLA (200 µM) or ESA (20 µM) for indicated time, using antibodies against the indicated proteins. Images are cropped for clarity; full-length blots are presented in Supplementary Fig. 13J, K. C WT and LAMP2A KO HT1080 cells were treated with 10-CLA (100 µM) or ESA (10 µM) or Erastin (20 µM) for 24 h, and assayed for cell viability assay. Data shown are the mean ± SD (n = 3).
Fig. 6
Fig. 6. CLA/CLNAs potentiate CMA-dependent GPX4 degradation through mitochondrial ROS production.
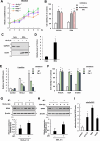
A Mitochondrial ROS level of HT1080 cells treated with either 10-CLA (200 µM) or ESA (20 µM) or CCCP (10 µM) for indicated time, detected with MitoSOX. Data shown are the mean ± SD (n = 3). B HT1080 cells were pretreated with Perhexiline (7.5 µM) or CQ (20 µM) for 0.5 h, treated with 10-CLA (100 μM) or ESA (10 μM) for 24 h, and assayed for cell viability. Data shown are the mean ± SD (n = 3). C, D HT1080 cells were treated with 10-CLA (200 µM) for 5 h. Lysates were fractionated into cytoplasm and mitochondria, and subjected to immunoblot analysis using antibodies against the indicated proteins (C), or to GC-MS analysis (D). Relative level of 10-CLA was calculated by dividing the molar amount of 10-CLA by the weight of protein in each fraction and shown as mean ± SEM (n = 5). Cyto: cytoplasm, Mito: mitochondria. Images are cropped for clarity; full-length blots are presented in Supplementary Fig. 13L. E, F HT1080 cells were pretreated with MT (20 µM), Fer-1 (5 µM) for 0.5 h, treated with either 10-CLA (E: 200 µM; F: 100 µM) or ESA (E: 20 µM; F: 10 µM) or Erastin (20 µM) for 4 h (E) or 24 h (F), and assessed their lipid ROS levels using Liperfluo (E) and cell viability (F). Data shown are the mean ± SD (n = 3). G, H Immunoblot of lysates from HT1080 cells pretreated with MT (20 µM) for 0.5 h and treated with 10-CLA (200 µM) or ESA (20 µM) for indicated time, using antibodies against GPX4 and β-actin. Images are cropped for clarity; full-length blots are presented in Supplementary Fig. 13M, N. I Mitochondrial lipid ROS levels of HT1080 cells treated with either 10-CLA (200 µM), ESA (20 µM) or CCCP (10 µM) for 4 h detected with mitoPeDPP. Data shown are the mean ± SD (n = 3).
Fig. 7
Fig. 7. Tung oil rich in ESA attenuates tumor growth by promoting ferroptosis via CMA.
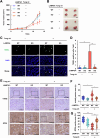
A, B Nude mice were subcutaneously inoculated with WT and LAMP2A KO HT1080 cells and administrated orally with either tung oil or safflower oil as control. Tumor volumes were measured three times a week and shown as the mean ± SEM (n = 4) (A). Representative images of tumors xenografts harvested on day 14 (B). p < 0.05 (vs WT, safflower oil). Bar, 10 mm. C, D TUNEL staining of paraffin sections of the harvested tumor xenografts counterstained with DAPI (C). The arrowheads indicate TUNEL-positive nuclei. White bar, 10 μm. The number of TUNEL-positive nuclei was counted in 4–6 fields for each section from 3 independent tumor xenografts and are shown as an average number of TUNEL-positive cells per field (mean ± SEM, n = 3) (D). ∗∗∗p < 0.001 (vs WT, safflower oil). EG 4-HNE and GPX4 staining of paraffin sections of the harvested tumor xenografts. The representative images (upper; bar, 100 µm). Inset, magnified images (bottom; bar, 40 µm) (E). 4-HNE (F) and GPX4 (G) positive areas were quantified and shown as percentage of the total areas (violin plot with data points).
Fig. 8
Fig. 8. Schematic illustration of the mechanism of pro-ferroptotic actions of CFAs.
A proposed model for the molecular mechanism of CFA-induced ferroptosis. CFAs, including 10-CLA and ESA, incorporated into cells accumulate preferentially at the mitochondria via ACSL1 and CPT1/2, primarily responsible for mitochondrial fatty acid transport. Mitochondrial accumulation of CFAs, susceptible to peroxidation due to their conjugated double bonds, initiates the generation of ROS/lipid ROS at mitochondria [1], which in turn triggers both propagation of lipid ROS throughout the cells [2-1], and GPX4 degradation through CMA [2-2], and ultimately, induces ferroptosis [3].

References

    1. Dixon SJ, Lemberg KM, Lamprecht MR, Skouta R, Zaitsev EM, Gleason CE, et al. Ferroptosis: an iron-dependent form of nonapoptotic cell death. Cell. 2012;149:1060–72. - PMC - PubMed
    1. Yang WS, SriRamaratnam R, Welsch ME, Shimada K, Skouta R, Viswanathan VS, et al. Regulation of ferroptotic cancer cell death by GPX4. Cell. 2014;156:317–31. - PMC - PubMed
    1. Hirata Y, Mishima E. Membrane dynamics and cation handling in ferroptosis. Physiology. 2024;39:73–87. - PMC - PubMed
    1. Lei G, Zhuang L, Gan B. Targeting ferroptosis as a vulnerability in cancer. Nat Rev Cancer. 2022;22:381–96. - PMC - PubMed
    1. Jiang L, Kon N, Li T, Wang SJ, Su T, Hibshoosh H, et al. Ferroptosis as a p53-mediated activity during tumour suppression. Nature. 2015;520:57–62. - PMC - PubMed

MeSH terms

Substances

LinkOut - more resources