. 2024 Dec 6;7(1):1468.
doi: 10.1038/s42003-024-07109-1.

A deep learning approach to predict differentiation outcomes in hypothalamic-pituitary organoids

Affiliations

A deep learning approach to predict differentiation outcomes in hypothalamic-pituitary organoids

Tomoyoshi Asano et al. Commun Biol. .

Abstract

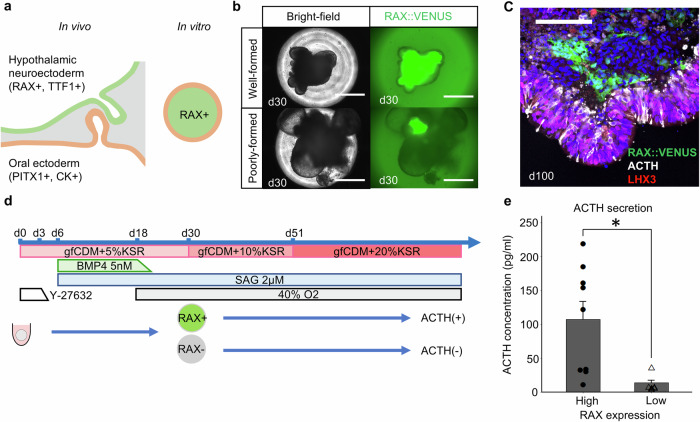
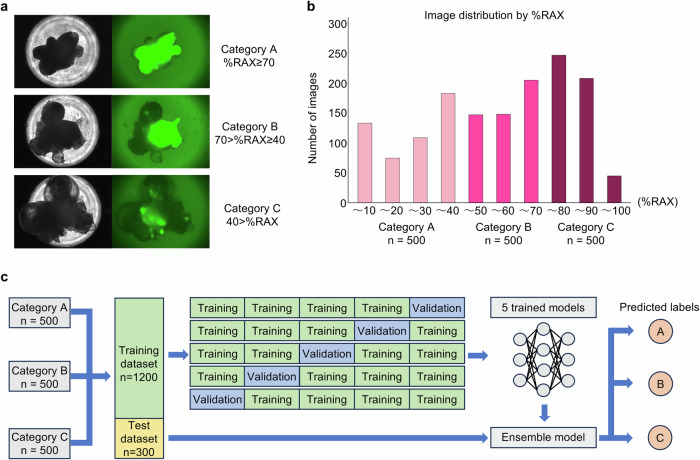
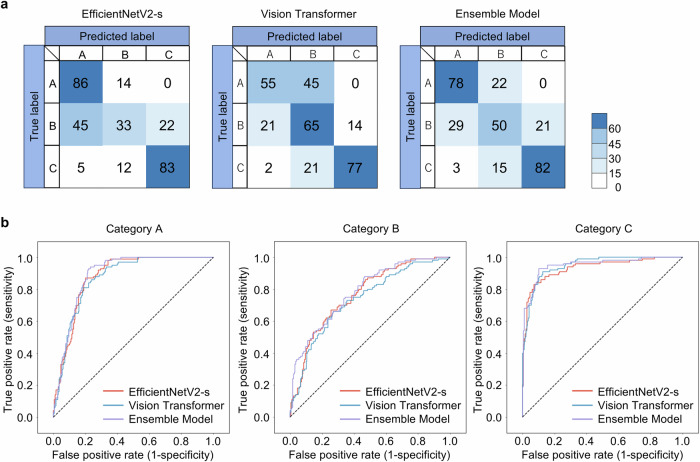
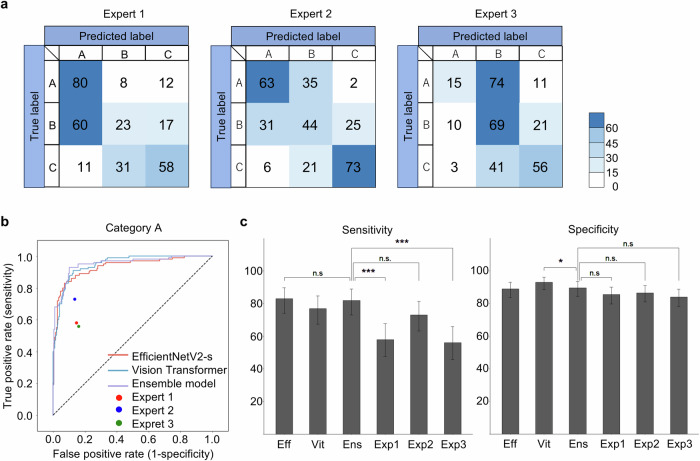
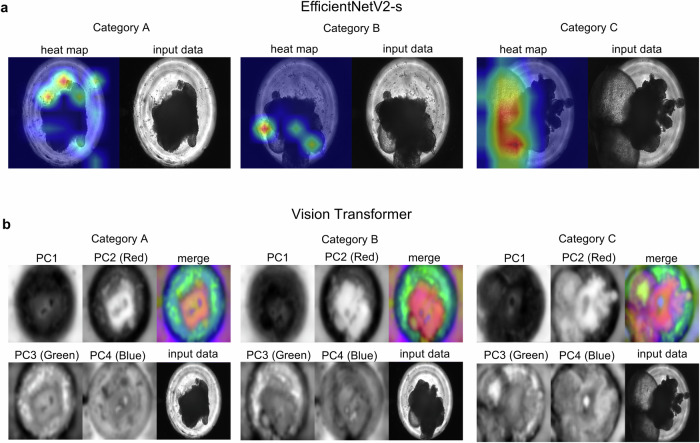
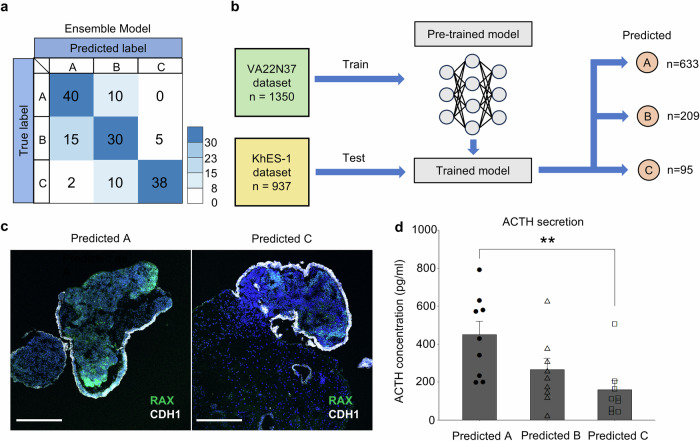
We use three-dimensional culture systems of human pluripotent stem cells for differentiation into pituitary organoids. Three-dimensional culture is inherently characterized by its ability to induce heterogeneous cell populations, making it difficult to maintain constant differentiation efficiency. That is why the culture process involves empirical aspects. In this study, we use deep-learning technology to create a model that can predict from images of organoids whether differentiation is progressing appropriately. Our models using EfficientNetV2-S or Vision Transformer, employing VENUS-coupled RAX expression, predictively class bright-field images of organoids into three categories with 70% accuracy, superior to expert-observer predictions. Furthermore, the model obtained by ensemble learning with the two algorithms can predict RAX expression in cells without RAX::VENUS, suggesting that our model can be deployed in clinical applications such as transplantation.


Conflict of interest statement

Competing interests: The authors declare the following competing interests: Sumitomo Pharma employs S.T. The authors are co-inventors on patent applications.

Figures

Fig. 1
Fig. 1. Relationship between RAX expression in hypothalamic-pituitary organoids and ACTH secretion.
a Schema of hypothalamic-pituitary interactions in vivo and in vitro. CK, cytokeratin. b Well-formed aggregates and poorly-formed aggregates. The RAX::VENUS cell line was used to confirm the quality of the aggregates. Scale bar = 500 μm. c Immunostaining of hESC aggregates at day 100 for ACTH (white) and LHX3 (red), markers of pituitary differentiation. For RAX::VENUS, spontaneous luminescence of the VENUS protein was imaged without staining. Scale bar = 100 μm. d Culture protocol for hypothalamic-pituitary organoid induction. Aggregates not expressing RAX at day 30 will not secrete ACTH after prolonged cultivation. e Aggregates with large and small RAX expression area groups show differences in ACTH secretion at day 100. Values shown on the graphs represent the means ± SEM, n = 9 independent experiments. *p < 0.05.
Fig. 2
Fig. 2. Category classification based on RAX expression area by Deep Learning.
a Categories grouped by RAX area percentage. b Distribution of images according to RAX area percentage. c Schema of the model.
Fig. 3
Fig. 3. Performance of EfficientNetV2-S, Vision Transformer, and the ensemble model on test data.
a Confusion matrix of EfficientNetV2-S, Vision Transformer, and the ensemble model. Cells filled with darker colors have many images distributed in them. b Receiver operating characteristic (ROC) curve for each category.
Fig. 4
Fig. 4. Comparison of the model with human-expert performance.
a Confusion matrix of human experts. Cells filled with darker colors have many images distributed in them. b Receiver operating characteristic (ROC) curve for category C with human expert performance. All the models outperformed the experts. c Sensitivity and specificity of the models and of human experts. There were no significant differences among the models. All models were superior to experts in sensitivity. There were no significant differences between the human experts and the models in specificity. Values shown on the graphs represent the means ± 95%Cis, *p < 0.05, **p < 0.01, ***p < 0.001. Eff, EfficientNetV2-S; Vit, Vision Transformer; Ens, Ensemble Model; Exp1, Expert 1; Exp2, Expert 2; Exp3, Expert 3.
Fig. 5
Fig. 5. Visual explanations of the models.
a Representative examples of the heatmaps of EfficientNetV2-S generated by Grad-CAM and a tabulation of where attention was focused. EfficientNetV2-S focuses on specific areas such as the periphery and cysts, just as did the experts. b Representative examples of the results of principal component analysis of Vision Transformer using Deep ViT Features. Merge images were generated with PC2, PC3, and PC4, which are thought to be involved in the classification of aggregates. PC1 principal component 1, PC2 principal component 2, PC3 principal component 3, PC4 principal component 4.
Fig. 6
Fig. 6. Diversion of the model to a culture system of cells without fluorescent protein.
a Confusion matrix of the ensemble model trained using 1350 images. b Schematic of model diversion. Prediction of categories by applying the trained model to aggregates derived from KhES-1. c Immunostaining of aggregates derived from KhES-1 on day30. Left: Predicted by the model as A. Right: Predicted to be C. Scale bar, 500 μm. d Comparison of ACTH secretory capacity at day 100 among three categories. Those predicted to be A had significantly higher ACTH secretory capacity. Values shown on the graphs represent the means ± SEM, n = 9 independent experiments. **p < 0.01.
Fig. 7
Fig. 7. Comparison of gene expression in aggregates predicted to be category A and category C on immunostaining.
Rate of immunostaining positive cells in each aggregate. Values shown on the graphs represent the means ± SEM, n = 3 independent experiments. *p < 0.05, ∗∗p < 0.01.

References

    1. Kelberman, D., Rizzoti, K., Lovell-Badge, R., Robinson, I. & Dattani, M. T. Genetic regulation of pituitary gland development in human and mouse. Endocr. Rev.30, 790–829 (2009). - PMC - PubMed
    1. Romero, C. J., Nesi-Franca, S. & Radovick, S. The molecular basis of hypopituitarism. Trends Endocrinol. Metab.20, 506–516 (2009). - PMC - PubMed
    1. Oelkers, W. Adrenal insufficiency. N. Engl. J. Med.335, 1206–1212 (1996). - PubMed
    1. Hahner, S. et al. High incidence of adrenal crisis in educated patients with chronic adrenal insufficiency: A prospective study. J. Clin. Endocrinol. Metab.100, 407–416 (2015). - PubMed
    1. Burman, P. et al. Deaths among adult patients with hypopituitarism: hypocortisolism during acute stress, and de novo malignant brain tumors contribute to an increased mortality. J. Clin. Endocrinol. Metab.98, 1466–1475 (2013). - PubMed

Publication types

LinkOut - more resources