. 2025 Apr;32(4):632-645.
doi: 10.1038/s41418-024-01427-x. Epub 2024 Dec 7.

Lactate dehydrogenase B noncanonically promotes ferroptosis defense in KRAS-driven lung cancer

Affiliations

Lactate dehydrogenase B noncanonically promotes ferroptosis defense in KRAS-driven lung cancer

Liang Zhao et al. Cell Death Differ. 2025 Apr.

Abstract

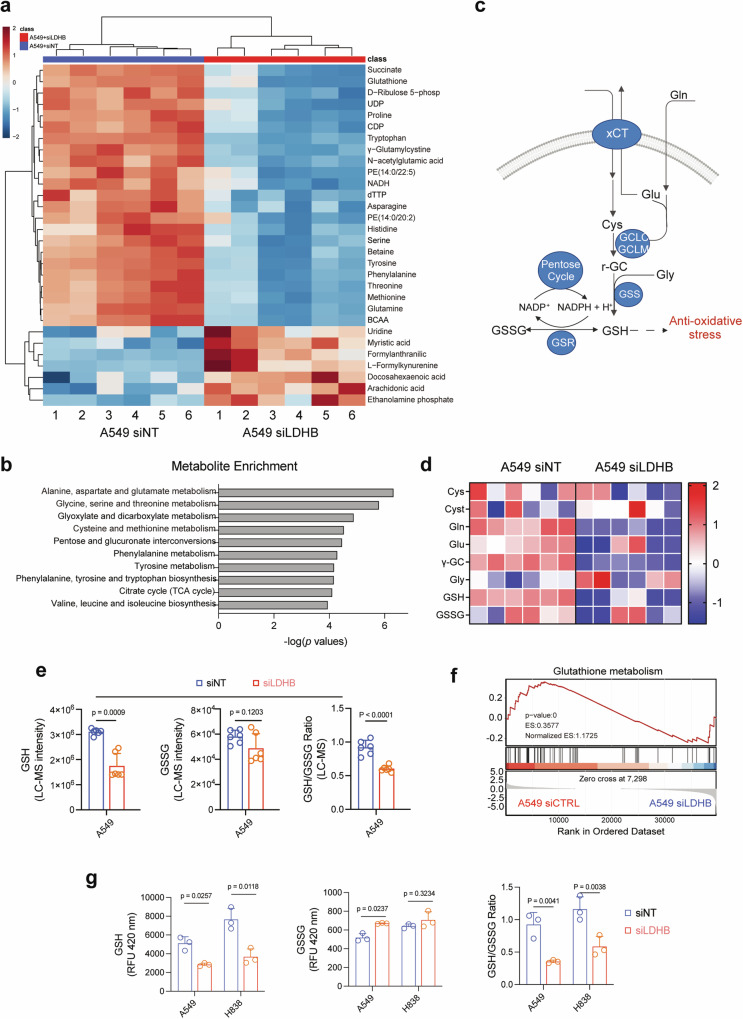
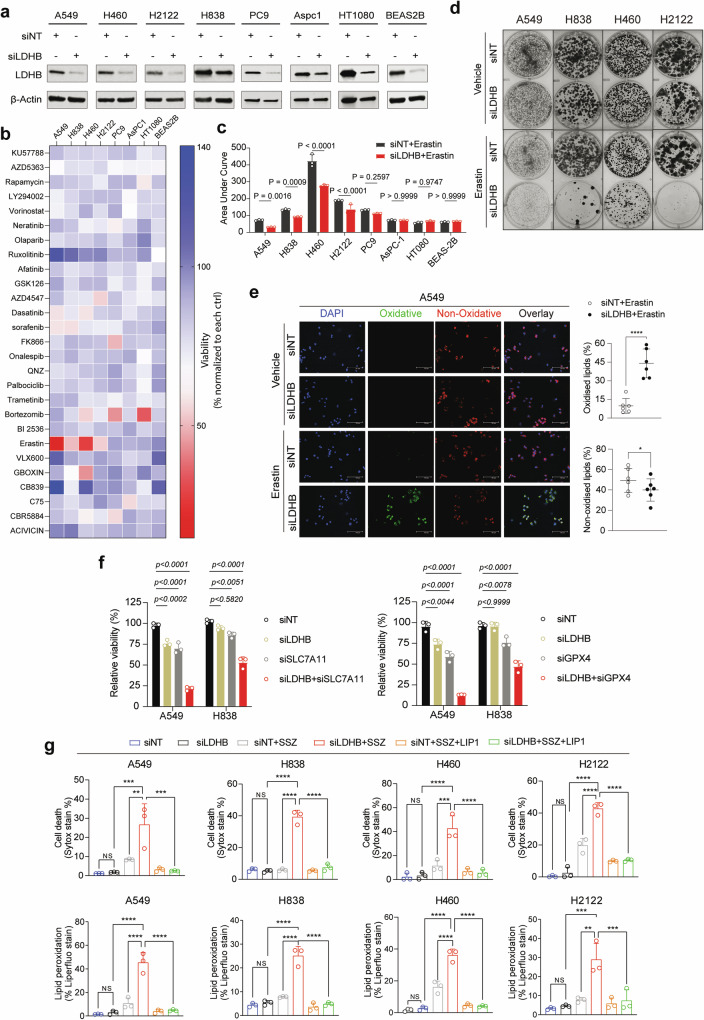
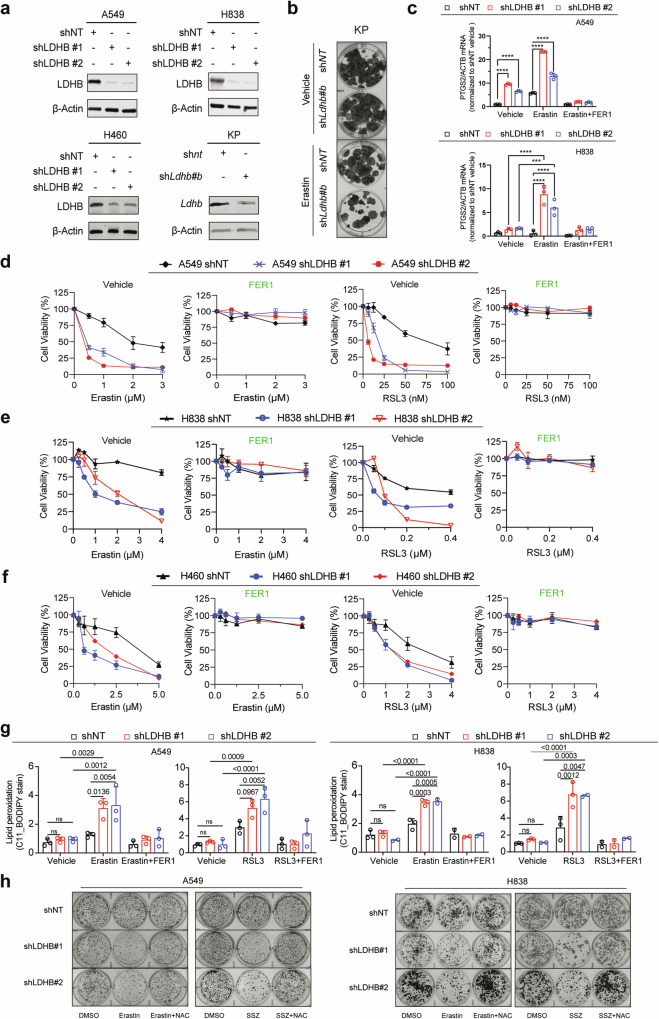
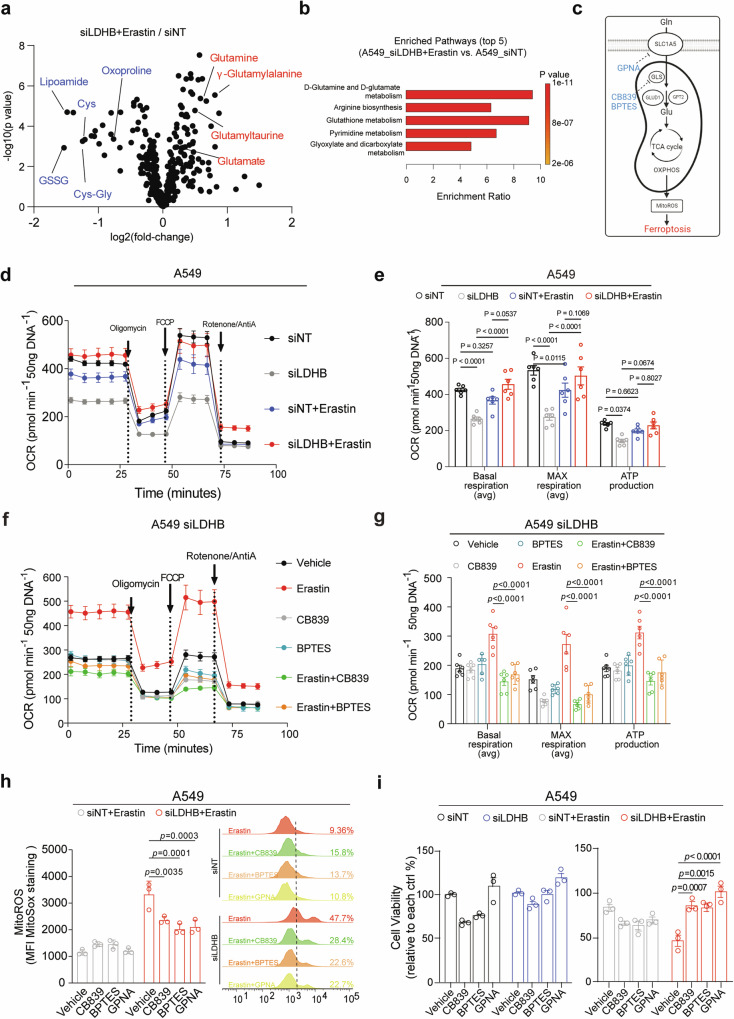
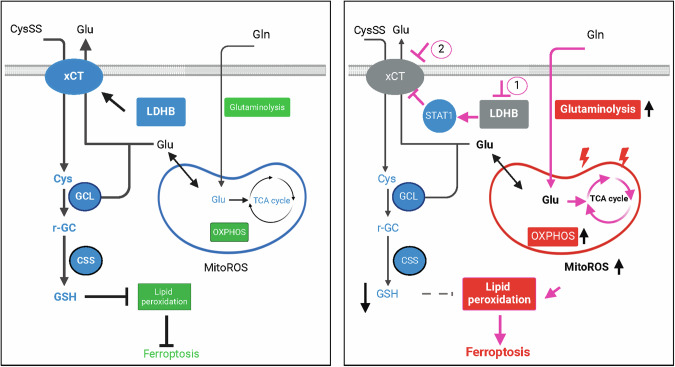
Ferroptosis is an oxidative, non-apoptotic cell death frequently inactivated in cancer, but the underlying mechanisms in oncogene-specific tumors remain poorly understood. Here, we discover that lactate dehydrogenase (LDH) B, but not the closely related LDHA, subunits of active LDH with a known function in glycolysis, noncanonically promotes ferroptosis defense in KRAS-driven lung cancer. Using murine models and human-derived tumor cell lines, we show that LDHB silencing impairs glutathione (GSH) levels and sensitizes cancer cells to blockade of either GSH biosynthesis or utilization by unleashing KRAS-specific, ferroptosis-catalyzed metabolic synthetic lethality, culminating in increased glutamine metabolism, oxidative phosphorylation (OXPHOS) and mitochondrial reactive oxygen species (mitoROS). We further show that LDHB suppression upregulates STAT1, a negative regulator of SLC7A11, thereby reducing SLC7A11-dependent GSH metabolism. Our study uncovers a previously undefined mechanism of ferroptosis resistance involving LDH isoenzymes and provides a novel rationale for exploiting oncogene-specific ferroptosis susceptibility to treat KRAS-driven lung cancer.


Conflict of interest statement

Competing interests: The authors declare no competing interests. Ethical approval: Mouse studies were approved by the Veterinary Office of the Canton Bern, Switzerland, and conducted in accordance with Institutional Animal Care.

Figures

Fig. 1
Fig. 1. LDHB silencing impairs GSH metabolism in KRAS-dependent NSCLC cells.
a Metabolomic analysis (LC-MS) of LDHB KD (siLDHB) and control (siNT) A549 cells (48 h post-transfection). Heat map showing the top 30 metabolites significantly different between LDHB KD and control A549 cells (n = 12). Relative abundance is scaled between 2 to -2. b Pathway enrichment analysis shows significantly downregulated metabolic processes in LDHB KD compared to control A549 cells. c Schematic of de novo GSH synthesis and the effect of LDHB KD on the pathway. Highlighted in blue are the genes and metabolites significantly altered by LDHB KD in A549 cells. Cys, cysteine; Cysta, cystathionine; γ-GC, γ-glutamylcysteine; Gly, glycine; Gln, glutamine; Glu, glutamate; GSH, glutathione; GSSG, glutathione disulfide; GCLC/GCLM, glutamate-cysteine ligase (GCL) catalytic and modifier subunits; GSS, glutamine synthetase; GSR, glutathione reductase; xCT, SLC7A11. d Heat map illustrating the abundance of key GSH metabolites in LDHB KD and control A549 cells. e The abundance of GSH, GSSG, and GSH/GSSG ratio in LDHB KD and control A549 cells. The analysis was based on the LC-MS data of A549 cells, p values by Student’s t-test. f LDHB KD downregulates GSH metabolism gene signature. GSEA was based on the transcriptome of LDHB KD (siLDHB) and control (siNT) A549 cells. g Ratios of GSH/GSSG in LDHB KD and control cells transfected with siRNAs for 48 h. Data are shown as mean ± s.d. (n = 3), with p values by Student’s t-test.
Fig. 2
Fig. 2. LDHB deficiency sensitizes KRAS-mutant NSCLC cells to ferroptosis inducers.
a Immunoblots of the indicated cells transfected with siNT or siLDHB for 48 h. b Heat map showing relative viability of LDHB KD cells treated for 72 h with the indicated compounds dosed at IC80/IC90 in control cells. Data are expressed as percentages of viable LDHB KD cells normalized to the corresponding control cells. c Sensitivity of LDHB KD cells and control cells to erastin dosed at IC80/90 in control cells. Drug sensitivity is determined by the area under curve (AUC) calculated by Graphpad 9.1. Data are presented as mean ± s.d. (n = 3), with p < 0.05 by Student’s t-test. d Clonogenic assay of the indicated human KRAS-mutant NSCLC cells transfected with siLDHB and siNT and treated for 72 h with erastin (A549, 1 μM; H838, 0.25 μM; H460, 10 μM; H2122, 5 μM) or DMSO. e A549 cells transfected with siNT or siLDHB for 36 h were treated with DMSO or erastin (5 μM) for another 14 h before stained with C11 BODIPY 581/591. Scale bars, 100 μm. f Viability assay of A549 and H838 cells transfected with siNT or siLDHB for 24 h and subsequently transfected with siNT, siSLC7A11 or siGPX4 for additional 48 h. Data are shown as mean ± s.d. (n = 3), with the statistical analyses by one-way ANOVA. ns, no significant difference. g Cell death and lipid peroxidation assay of the indicated cells transfected with siNT and siLDHB for 48 h followed by further treatment for 16 h with sulfasalazine (SSZ; A549, 1 mM; H838, 0.5 mM; H460, 2.5 mM; H2122, 2 mM), alone or with Liproxstatin-1 (LIP1; 3 µM). Data are shown as mean ± s.d. (n = 3). ** p < 0.01; ***p < 0.001; ****p < 0.0001 by one-way ANOVA.
Fig. 3
Fig. 3. Inhibiting LDHB and the SLC7A11/GSH/GPX4 axis confers ferroptosis-mediated metabolic synthetic lethality.
a Immunoblot of the indicated cells stably transduced with shNT or shRNAs against LDHB. b Clonogenic assay of murine KP cells transduced with shLdhb#b and shNT and further treated for 72 h with erastin (15 μM) or DMSO. c Quantitative analysis (qPCR) of PTGS2 mRNA in the indicated cells treated for 14 h with DMSO or erastin (A549, 5 µM; H838, 2.5 µM) with or without FER1 (3 µM). d–f Viability assay of shNT- or shLDHB-transduced cells after treated with RSL3 or erastin, alone or in combination with 2 μM Ferrostatin-1(FER1). g Flow cytometry of C11 BODIPY mean fluorescence intensity ratio of oxidative channel (FITC 488 nm) versus non-oxidative channel (PE-TEXAS RED 610 nm) in shNT- or shLDHB-transduced cells. A549 cells were treated with 0.5 μM RSL3 or 5 μM erastin, alone or in combination with 2 μM FER1 for 6 h and 14 h, respectively. H838 cells were treated with 0.25 μM RSL3 or 2.5 μM erastin, alone or in combination with 2 μM FER1 for 6 h and 14 h, respectively. Data are shown as mean ± s.d (n = 3), with statistical analyses by two-way ANOVA. h Colony assay of A549 and H838 shNT- or shLDHB-transduced cells treated with erastin (A549, 5 µM; H838, 2.5 µM) or sulfasalazine (SSZ; A549, 0.25 mM; H838, 1 mM) for 24 h in the presence or absence of NAC (10 mM).
Fig. 4
Fig. 4. LDHB regulates GSH-dependent ferroptosis defense through SLC7A11.
a Heat maps showing the mRNA fold change of ferroptosis-related genes (n = 25) in siLDHB cells (KD) compared to siNT cells (WT) (based on RNA-seq data). b, c Immunoblots of the indicated cells transfected for 48 h with siNT (-) or siLDHB (+) or stably expressing shRNAs. d Immunoblot of A549 stably expressing shNT or shLDHB were further transduced with either an empty vector or a SLC7A11-expressing plasmid (pCMV-SLC7A11). e, f Viability and lipid ROS assay of the indicated cells treated with erastin (A549, 5 µM; H838, 2.5 µM) or sulfasalazine (SSZ; A549, 0.25 mM; H838, 1 mM) for 24 h. g Immunoblots of A549 transfected (48 h) with siLDHB or siNT and further treated (16 h) with erastin (5 uM) or Sulfasalazine (1 mM). Murine KP cells expressing Ldhb shRNA or control shRNA were treated with erastin (10 uM) or Sulfasalazine (1 mM) for 24 h. h, i Immunoblots h and viability assay i of A549 cells transfected with siLDHB, siSTAT1 or siNTs for 24 h, followed by further treatment with erastin (10 µM) for another 24 h. j SLC7A11 mRNA fold change in A549 cells transfected (72 h) with siSTAT1 compared to A549 cells transfected with siNT. **p < 0.01 by Student’s t-test. k ChIP of STAT1 in A549 cells transfected with siLDHB or siNT, or treated with IFNγ. STAT1 binding to the SLC7A11 promoter (GAS2 domain) was quantified by qPCR. Results are expressed as fold change in site occupancy over IgG control and shown as mean ± SD from three independent experiments (n = 3). **p < 0.01 by two-way ANOVA.
Fig. 5
Fig. 5. Metabolic synthetic lethality induced by LDHB/SLC7A11 inhibition converges on glutamine metabolism.
a Volcano plot showing the metabolomics profile of A549 cells transfected for 48 h with siLDHB or siNT and further treated with erastin (5 µM) or vehicle for 20 h. b The metabolic pathways most significantly upregulated in erastin-treated LDHB KD cells compared to those in vehicle-treated control cells. c Schematic of glutamine metabolism and glutamine-fueled glutaminolysis. Inhibitors that mitigate LDHB/SLC7A11 inhibition-induced ferroptosis are highlighted in green. d, e Oxygen consumption rate (OCR) measurement d and quantification e of A549 cells transfected with siLDHB or siNT for 48 h and further treated for 20 h with DMSO or erastin (5 μM). Cell numbers normalized to 50 ng/DNA. Data represent the average of basal respiration, maximal respiration, and ATP production taken at multiple time points during the respective phases of the Seahorse assay, and are shown as mean ± s.e.m (n = 6). f, g, OCR measure f and quantification g of A549 KD cells transfected with siLDHB or siNT for 48 h and further treated for 20 h with DMSO, erastin (5 μM), CB839 (0.5 μM), BPTES (2 μM), and GPNA (50 μM), alone or in combination. Normalization was based on vehicle-treated siNT and siLDHB groups (set as 100%), respectively. Data represent the average of basal respiration, maximal respiration, and ATP production taken at multiple time points during the respective phases of the Seahorse assay, and are shown as mean ± s.e.m (n = 6). h MitoSox (mitochondrial ROS marker) quantification (left) and flow cytometry (right) analysis of A549 cells transfected and treated as above d–g; MitoROS is shown as mean fluorescence intensity (MFI) ± s.d. (n = 3), with the siNT group used for normalization. i Viability assay of A549 cells transfected with siLDHB or siNT for 48 h and further treated for 20 h with DMSO, erastin (5 μM), CB839 (0.5 μM), BPTES (2 μM), and GPNA (50 μM), alone or in combination. Normalization was based on vehicle-treated siNT and siLDHB groups (set as 100%), respectively.
Fig. 6
Fig. 6. SLC7A11 inhibitors suppress in vivo growth of LDHB-deficient KRAS-driven lung tumors.
a, b Tumor development of A549 a and H460 b xenografts treated with erastin (30 mg/kg/day) and SSZ (150 mg/kg/day). c Micro-CT images of LSL-KrasG12D/WT; p53fl/fl mice and LSL-KrasG12D/WT; p53fl/fl; LDHBfl/fl mice at the indicated time points. H&E staining of lung tissue sections after 9-week treatment. Scale bar, 20 μm. d–h Lung volume d, tumor burden e, tumor number f, average tumor size g, and survival fraction h after SSZ treatment. Data are shown as the mean ± s.d. *p < 0.05; **p < 0.01; ***p < 0.001 by one-way ANOVA. NS not significant.
Fig. 7
Fig. 7. Working model for the function of LDHB in ferroptosis surveillance.
LDHB noncanonically protects KRAS-driven lung cancer from ferroptosis by promoting the SLC7A11/GSH axis. LDHB blockade is synthetic lethal with SLC7A11 inhibitors due to hyperactivation of glutamine metabolism and mitoROS-dependent ferroptosis.

References

    1. Prior IA, Hood FE, Hartley JL. The frequency of ras mutations in cancer. Cancer Res. 2020;80:2969–74. - PMC - PubMed
    1. Punekar SR, Velcheti V, Neel BG, Wong KK. The current state of the art and future trends in RAS-targeted cancer therapies. Nat Rev Clin Oncol. 2022;19:637–55. - PMC - PubMed
    1. Kerr EM, Gaude E, Turrell FK, Frezza C, Martins CP. Mutant Kras copy number defines metabolic reprogramming and therapeutic susceptibilities. Nature. 2016;531:110–3. - PMC - PubMed
    1. Yun J, Rago C, Cheong I, Pagliarini R, Angenendt P, Rajagopalan H, et al. Glucose deprivation contributes to the development of KRAS pathway mutations in tumor cells. Science. 2009;325:1555–9. - PMC - PubMed
    1. Weinberg F, Hamanaka R, Wheaton WW, Weinberg S, Joseph J, Lopez M, et al. Mitochondrial metabolism and ROS generation are essential for Kras-mediated tumorigenicity. Proc Natl Acad Sci USA. 2010;107:8788–93. - PMC - PubMed