. 2025 Jun;9(6):935-951.
doi: 10.1038/s41551-024-01299-z. Epub 2024 Dec 6.

Evoking stable and precise tactile sensations via multi-electrode intracortical microstimulation of the somatosensory cortex

Affiliations

Evoking stable and precise tactile sensations via multi-electrode intracortical microstimulation of the somatosensory cortex

Charles M Greenspon et al. Nat Biomed Eng. 2025 Jun.

Abstract

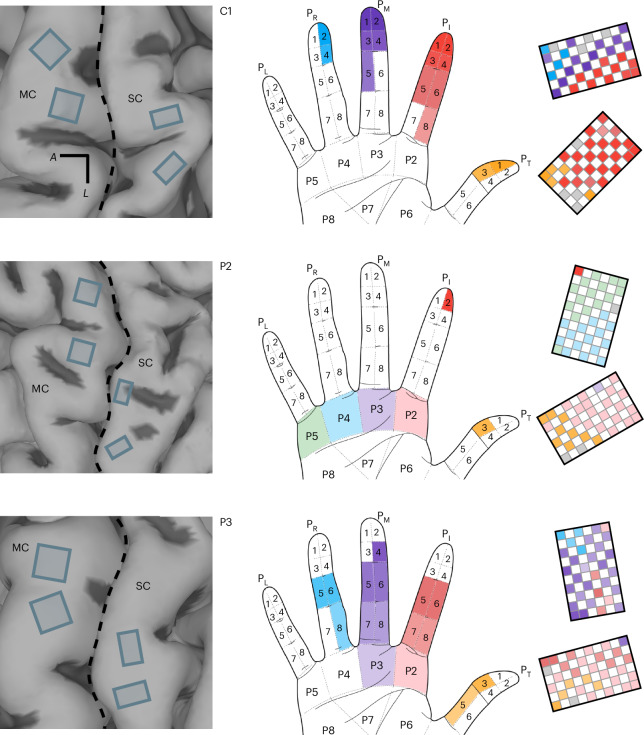
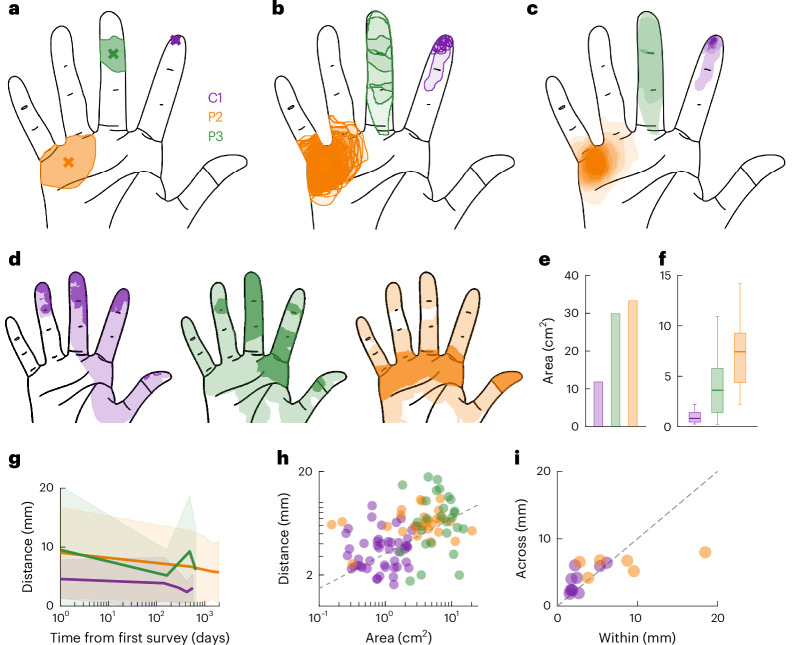
Tactile feedback from brain-controlled bionic hands can be partially restored via intracortical microstimulation (ICMS) of the primary somatosensory cortex. In ICMS, the location of percepts depends on the electrode's location and the percept intensity depends on the stimulation frequency and amplitude. Sensors on a bionic hand can thus be linked to somatotopically appropriate electrodes, and the contact force of each sensor can be used to determine the amplitude of a stimulus. Here we report a systematic investigation of the localization and intensity of ICMS-evoked percepts in three participants with cervical spinal cord injury. A retrospective analysis of projected fields showed that they were typically composed of a focal hotspot with diffuse borders, arrayed somatotopically in keeping with their underlying receptive fields and stable throughout the duration of the study. When testing the participants' ability to rapidly localize a single ICMS presentation, individual electrodes typically evoked only weak sensations, making object localization and discrimination difficult. However, overlapping projected fields from multiple electrodes produced more localizable and intense sensations and allowed for a more precise use of a bionic hand.


Conflict of interest statement

Competing interests: N.G.H. and R.A.G. served as consultants for Blackrock Neurotech, Inc. at the time of the study. R.A.G. is also on the scientific advisory board of Neurowired LLC. M.L.B., J.L.C. and R.A.G. received research funding from Blackrock Neurotech, Inc. though that funding did not support the work presented here. A.R.S. serves as a consultant for Google DeepMind. The other authors declare no competing interests.

Figures

Fig. 1
Fig. 1. Array implant locations and percept maps for all participants.
Left: anatomical MRI with (subsequently implanted) arrays superimposed based on intra-operative photos. MC, motor cortex; SC, somatosensory cortex (Brodmann’s area 1). Axes indicate anterior (A) and lateral (L) directions and the central sulcus is indicated by the dashed line. Middle and right: the hand region on which ICMS sensations were experienced along with the electrodes that evoked those sensations. The segment is assigned based on median reported sensation over time. Each row shows data from one participant. Note that S1 arrays were wired in a chequerboard pattern. White sections indicate unwired electrodes. Labels indicate palmar (P) surface of the thumb (PT), index (PI), middle (PM), ring (PR) and little (PL) fingers. Coloured electrodes were used for both recording and stimulation.
Fig. 2
Fig. 2. PF locations systematically vary in size and location across electrodes and participants but are stable over time.
a, Example PFs from one electrode during one session from each participant. The crosses denote the respective centroids. b, The PFs from the same electrode as in a but across all sessions (n = 8, 43 and 5 for C1, P2 and P3, respectively). c, The pixel frequency computed for the same electrodes as in a and b across all sessions. d, Hand regions over which each participant reported a sensation across all electrodes. The shading indicates whether each pixel’s frequency was above (dark) or below (light) the 33% threshold. e, The area of the hand over which a sensation was evoked (union of PFs across electrodes, after thresholding) for each participant. f, The distribution of individual PF sizes (after thresholding) for each participant (n = 62, 63 and 63, respectively). The box and whiskers show the 5th, 25th, 50th, 75th and 95th percentiles. g, The distance between the centroid of the single-day PF and the aggregate centroid for each electrode, averaged across electrodes. The line denotes the mean, and the shaded area denotes the s.d. h, The area of each percept after thresholding predicts mean distance between single-day PF centroid and aggregate PF centroid for each electrode. The dashed line denotes the best fit. i, The mean centroid distance when reports were collected within a single day compared with that computed across years for a subset of electrodes. The dashed line denotes unity.
Fig. 3
Fig. 3. Percept location varies along somatotopic axes and is determined by underlying RFs.
a, Example projections of percept centroids in their original position (on array) when projected along either column-wise or row-wise axes. b, Classification performance versus the angle of the projection axis, expressed relative to the local curvature of S1. Each line represents an array for the indicated participant. c, Optimal digit/palmar segment discrimination axis (perpendicular to the projection axis), superimposed on each S1 array (dotted line). The dashed line denotes the local curvature of S1, which, for C1, deviates from the curvature of the central sulcus. d, Digit classification when using either both axes of the array (row and column (2D, two dimensions)) or the best single projected axis (1D, one dimension). e, Within digit, the distance between two PF centroids is significantly correlated with the distance between the electrodes across arrays (Pearson’s correlation, n = 5,892 pairs, r = 0.69, P < 0.0001) and within each array (Pearson’s correlation, r > 0.4, P < 0.0001, Holm–Bonferroni corrected). The dashed lines represent arrays coloured by participant, with the mean and s.d. indicated by the grey line and shaded area, respectively. f, Aggregate PF (red) and RF (blue) for an example electrode from participant P3. g, The size of the RF versus size of the PF for electrodes from participants C1 and P3. The RFs were larger for both participants (two-sided paired t-test, P < 0.0001 and P = 0.0078, respectively). The dashed line indicates unity. h, The proportion of the PF within the RF for all tested electrodes (n = 62 and 25). The median proportion was 1 for both with 25th percentiles of 0.83 and 0.72 for C1 and P3, respectively, suggesting that PFs tended to be completely subsumed by the RF. The box and whiskers show 5th, 25th, 50th, 75th and 95th percentiles. i, The number of regions (digits and palm) encapsulated by each electrode’s RF minus the number of regions encapsulated by its PF for three participants (N = 62, 25 and 21 for participants C1, P3 and R1, respectively). RFs spanned more hand regions than PFs in all three participants (two-sided Wilcoxon rank sum test, P = 0.0035). The bar and whiskers show mean and s.d. *P < 0.0001, **P = 0.0026 and ***P = 0.0035.
Fig. 4
Fig. 4. PFs sum to produce focal and well localizable sensations.
a, Example PFs from two individual electrodes where the PFs broadly overlapped (left and middle) and the PF when both electrodes were stimulated simultaneously (right). b, Another example in which the PFs of the individual electrodes did not overlap (left and middle) along with the combined PF (right). c, The correlation between the additive model and observed PF (observed) versus a null model where two random electrodes were chosen. The additive model significantly outperformed the null model (two-sided, two-sample Kolmogorov–Smirnov test, D = 0.86, P < 0.0001). Data from participant C1. d, The task set-up for the robotic digit localization task. The participant was blindfolded while an experimenter randomly squeezed individual prosthetic digits or pairs of digits. e, Consolidated performance of robotic and open loop localization tasks for single-electrode (n = 128) and multi-electrode (n = 110) localization tasks. Multi-electrode stimulation evokes more localizable sensations (two-sided, two-sample t-test, t(236) = 21.6, P < 0.0001). Note that trials where the participant failed to detect stimulation are excluded here to reduce confounding localization performance with detectability. Data from participant C1. The box and whiskers show the 5th, 25th, 50th, 75th and 95th percentiles.
Fig. 5
Fig. 5. Perceived intensity increases linearly with ICMS amplitude.
a, Normalized magnitude ratings following ICMS delivered through single electrodes for three participants. Each line denotes ratings for one electrode. The different colours denote different participants. The black line denotes the mean across electrodes and participants. b, Normalized ratings when ICMS and mechanical stimuli are interleaved for one electrode. Indentations were delivered to the location on the skin corresponding to the PF of that electrode. c, Equal intensity contours for ICMS-evoked and mechanically evoked sensations. Each line represents the contour derived from the ratings from one stimulating electrode. The black line corresponds to the contour of the electrode shown in b. While perceived magnitude increases with amplitude on all electrodes, the range of the evocable intensities varies widely across electrodes. Data from b and c are from participant C1 only. d, Goodness of fit for ICMS or mechanical intensity ratings when using power adjusted versus linear adjusted functions. Power functions provide better fits for intensity ratings of skin indentations but not ICMS.
Fig. 6
Fig. 6. Amplitude discriminability is electrode dependent.
a, Example psychometric functions from each participant in which the probability of indicating each comparison stimulus was of higher intensity than the reference stimulus. Note that examples are selected to highlight variability. b, JND computed from psychometric functions for all electrodes across participants (n = 35). The thick grey line denotes median (13.5 μA). Note that values above 40 μA are set to 40 μA for graphical purposes (n = 2, JND = 60 and 106). c, The Weber fraction when the reference amplitude is either 50 μA or 70 μA. d, A diagram showing the estimated discriminable levels plots for the electrodes shown in a. The grey section at the bottom of each bar indicates the subthreshold range for that electrode and the height of each subsequent bar is determined by the JND (following Weber’s law), with the maximum amplitude capped at 100 μA. e, The estimated discriminable levels for tactile stimulation in the same approximate range of forces (0–0.4 N). f, The maximum force or intensity evoked by each electrode compared with the number of discriminable levels computed from the detection threshold and JND. Note that force values are predicted equivalent force at 100 μA based on iso-intensity curves (Fig. 5c) fit on a subset of the amplitude range. g, Example idealized stimulus profiles for linear (stimulus amplitude scales with force) and biomimetic (force transients are emphasized) stimuli. h, JNDs are reduced (sensitivity is enhanced) with biomimetic stimuli versus linear ones. i, The distribution of the number of discriminable levels computed from JNDs with constant (flat) (grey, n = 35), linear (black, n = 22) or biomimetic (blue, n = 22) stimuli. The number of levels is equivalent with constant and linear but higher with biomimetic stimuli. The box and whisker lines in b and i indicate the 5th, 25th, 50th, 75th and 95th percentiles.
Fig. 7
Fig. 7. Biomimetic multi-electrode stimulation produces more intense and more discriminable percepts.
a, Normalized magnitude ratings when biomimetic ICMS is delivered through electrodes individually or simultaneously, interleaved with mechanical stimuli for an example quartet. The lines denote the mean and the shaded areas denote the s.d. b, Equal intensity contours for single-electrode and multi-electrode ICMS for an example quartet. Inset: the maximum achievable force for single- or multi-electrode stimulation across all tested quartets, extrapolating fits to 100 μA. c, Psychometric functions for one quartet of electrodes using biomimetic single- or multi-electrode stimulation. The individual performance is in blue and the quartet is in red. Inset: JNDs for all single electrodes and quartets tested (n = 12 and 8, respectively). d, Psychometric functions for one quartet of electrodes using linear or biomimetic multi-electrode stimulation. Inset: JNDs for all quartets tested (n = 5). e, The estimated number of discriminable levels with single-electrode ICMS and biomimetic multi-electrode ICMS (n = 22, 22 and 8 and median of 8, 11 and 19.5, respectively). f, A schematic of the compliance discrimination task using a sensorized bionic hand. g, Compliance discrimination performance with linear single-electrode or biomimetic multi-electrode feedback (2 blocks of 20 trials for each condition). Data in c and e are from participants C1 and P2, and the remaining data are from participant C1. The box and whiskers in ce show the 5th, 25th, 50th, 75th and 95th percentiles.
Extended Data Fig. 1
Extended Data Fig. 1. Palmar and dorsal projected field maps for all participants.
The hand diagrams show the distributions of the locations of the sensations evoked by ICMS any electrode on the palmar (left) and dorsal (right) surface of the hand. The array diagrams show the dominant hand segment for each electrode. All array rotations are approximately aligned such that up is medial and anterior is left.
Extended Data Fig. 2
Extended Data Fig. 2. Thresholding the aggregate PFs to assess stability.
a, Proportion of times that ICMS (at 100 Hz, 60 µA) through a given electrode evoked a sensation in the three participants. b, The proportion of electrodes for which any pixel exceeds the criterion decreases as the pixel frequency threshold increases. c, The area of the aggregate PF drops dramatically as the pixel frequency threshold increases to 0.25 and then decreases more slowly. d, The variability in the PF (Euclidean distance of each observation’s centroid from the aggregate centroid) changes only marginally as pixel frequency threshold increases. Dashed line indicates 33% threshold applied for analyses (same for E & F). e, Electrodes with higher detection thresholds were less likely to be reported during survey sessions. f, The mean distance between the first centroid and subsequent ones is stable. g, The distribution of slopes computed from the data shown in panel A for individual electrodes grouped by participant. h, Centroid variability was maximized in both directions along a single axis instead of monotonic drift. Lines and shaded areas in C, F, and G represent mean and standard deviation. Box and whisker in A and G represent 5th, 25th, 50th, 75th, and 95th percentiles.
Extended Data Fig. 3
Extended Data Fig. 3. Residual touch sensation for each participant.
Shading indicates the degree of residual touch of the palmar surface of the hand for each participant.
Extended Data Fig. 4
Extended Data Fig. 4. PF size and sensory magnitude increase with ICMS amplitude and frequency.
a, Normalized ratings of sensory magnitude and PF size vs. ICMS amplitude (with frequency fixed at 100 Hz). The size of the PF for each electrode and condition was normalized by the mean PF across conditions. b, Normalized ratings of sensory magnitude and PF size vs. ICMS frequency (with amplitude fixed at 60 µA). Both frequency and amplitude significantly impact perceived size and intensity (2-way ANOVA, p < 0.01 for all). c, The effect of ICMS amplitude and frequency on PF size can be accounted for by the latter’s impact on sensory magnitude (r = 0.77, p < 0.01). Data from participant C1. Lines and shaded areas in A and B represent mean and standard deviation.
Extended Data Fig. 5
Extended Data Fig. 5. Localization task performance.
a, Performance on the localization task when stimuli were triggered via the robotic hand or the computer. Overall performance was statistically equivalent (two sided, 2-sample t-test, t(236) = 0.58, p = 0.56). b, Confusion matrices for single and c, multielectrode stimulation. Data from participant C1. Box and whisker in A represent 5th, 25th, 50th, 75th, and 95th percentiles.
Extended Data Fig. 6
Extended Data Fig. 6. Mechanical-task performance and single-electrode performance.
a, Mechanical JNDs for participant C1 with either the injured (contralateral) or uninjured (ipsilateral) hand are similar. Each point represents a different fingertip. b, Normalized intensity ratings from participant C1 on 3 different digits (denoted by different colors). Ratings are consistent across digits. Note that the normalization was performed based on the grand mean rating, which included ratings of single-electrode ICMS stimuli and tended to be weaker than the mechanical ones. c, JNDs for a subset of electrodes from participant C1 when the reference stimulus was 50 or 70 µA. Dashed lines connect to the same electrode. d, The discriminability of an electrode (JND) is inversely correlated with its detection threshold. e, JNDs for biomimetic and linear stimuli across participants and electrodes (n = 20). Biomimetic stimuli yield significantly lower JNDs than linear stimuli, expressed in terms of charge per phase. f, Normalized intensity ratings for one electrode. Linear ICMS (gray) does not give rise to significantly more intense sensations than does biomimetic ICMS (blue) when comparing stimuli with the same maximum amplitude. The mean relative intensity of the biomimetic stimuli was 92 ± 3% of the intensity of the linear ones (n = 5 electrode). Lines and shaded areas in B and F represent mean and standard deviation. Box and whisker in A represent 5th, 25th, 50th, 75th, and 95th percentiles.
Extended Data Fig. 7
Extended Data Fig. 7. Multielectrode force feedback.
a, Linear fits are equivalent to power law fits for single-electrode and multielectrode ICMS, but power law fits are better for mechanical stimuli. b, Variability of magnitude ratings is lower for multielectrode stimulation than for single-electrode stimulation (Tukey’s post-hoc test, p < 0.01) and statistically equivalent to its mechanical counterpart (p = 0.45). c, JNDs are significantly lower for single than multielectrode biomimetic stimulation when expressed in terms of charge per phase (1-way ANOVA, F = 36.1, p < 0.001). Box and whisker in B and C represent 5th, 25th, 50th, 75th, and 95th percentiles.
Extended Data Fig. 8
Extended Data Fig. 8. Pipeline for the compliance discrimination task.
At trial start, the subject attempts to grasp a foam puck. An LSTM decoder infers the attempted aperture based on signals from M1. Upon object contact, the output of sensors on the thumb and index finger drives ICMS according to a single-electrode linear algorithm or a multielectrode biomimetic one. Linear feedback is delivered through a single electrode, biomimetic feedback through a quartet with overlapping PFs (as in this schematic).
Extended Data Fig. 9
Extended Data Fig. 9. Receptive versus projected field mapping.
a, Illustration of cortical activation by ICMS and b, during RF mapping for a given electrode. The cortical activation by touch is much wider than that by ICMS. c, Considering the differences in cortical activation during transient and sustained phases of contact, the area of cortex activated by ICMS (AICMS) is on the same spatial scale as the hot zone (cortical activation during sustained contact - AS), but systematically smaller than the transiently activated cortical area (- AT), at a first approximation. d, Schematic of firing rate and area of activation along our recording arrays during mechanical stimulation (left and middle) compared with ICMS (right).

Update of

References

    1. Johansson, R. S. & Flanagan, J. R. Coding and use of tactile signals from the fingertips in object manipulation tasks. Nat. Rev. Neurosci.10, 345–359 (2009). - PubMed
    1. Johansson, R. S. & Westling, G. Signals in tactile afferents from the fingers eliciting adaptive motor responses during precision grip. Exp. Brain Res.66, 141–154 (1987). - PubMed
    1. Monzée, J., Lamarre, Y. & Smith, A. M. The effects of digital anesthesia on force control using a precision grip. J. Neurophysiol.89, 672–683 (2003). - PubMed
    1. Wijk, U. & Carlsson, I. Forearm amputees’ views of prosthesis use and sensory feedback. J. Hand Ther.28, 269–278 (2015). - PubMed
    1. Flesher, S. N. et al. Intracortical microstimulation of human somatosensory cortex. Sci. Transl. Med.8, 361ra141 (2016). - PubMed

LinkOut - more resources