

Evaluation of Trends in Influenza A and B Viruses in Wastewater and Human Surveillance Data: Insights from the 2022-2023 Season in Italy
- PMID: 39644457
- PMCID: PMC11625071
- DOI: 10.1007/s12560-024-09622-2
Evaluation of Trends in Influenza A and B Viruses in Wastewater and Human Surveillance Data: Insights from the 2022-2023 Season in Italy
Abstract
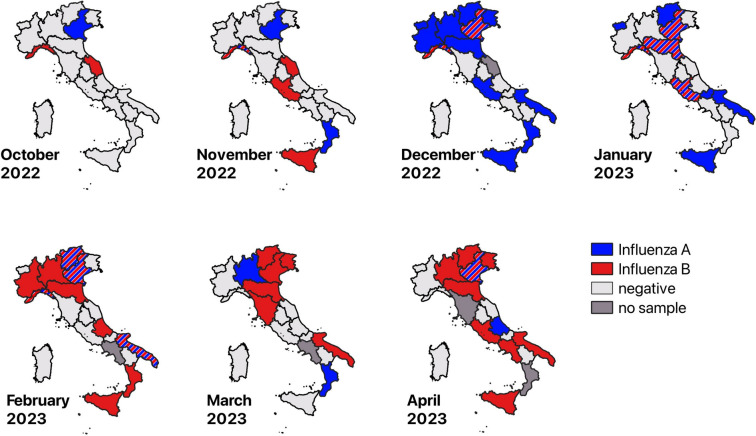
Wastewater-based epidemiology (WBE) is a recognized, dynamic approach to monitoring the transmission of pathogens in communities through urban wastewater. This study aimed to detect and quantify influenza A and B viruses in Italian wastewater during the 2022-2023 season (October 2022 to April 2023). A total of 298 wastewater samples were collected from 67 wastewater treatment plants (WTPs) across the country. These samples were analyzed for influenza A and B viruses (IAV, IBV) using primers originally developed by the Centers for Disease Control and Prevention (CDC) for real-time PCR and adapted for digital PCR. The overall detection rates of IAV and IBV across the entire study period were 19.1% and 16.8%, respectively. The prevalence of IAV in wastewater showed a gradual increase from October to December 2022, peaking at 61% in December. In contrast, IBV peaked at 36% in February 2023. This temporal discrepancy in peak concentrations suggests different seasonal patterns for the two influenza types. These trends mirrored human surveillance data, which showed influenza A cases peaking at 46% in late December and declining to around 2% by April 2023, and influenza B cases starting to increase significantly in January 2023 and peaking at about 14% in March. IAV concentrations ranged from 9.80 × 10² to 1.94 × 10⁵ g.c./L, while IBV concentrations ranged from 1.07 × 10³ to 1.43 × 10⁴ g.c./L. Overall, the environmental data were consistent with the human surveillance trends observed during the study period in the country. These results demonstrate the value of WBE in tracking epidemiological patterns and highlight its potential as a complementary tool to infectious diseases surveillance systems.
Keywords: Influenza virus; Surveillance; Wastewater; dPCR.
© 2024. The Author(s).
Conflict of interest statement
Declarations. Competing Interests: The authors declare that they have no known competing financial interests or personal relationships that could have appeared to influence the work reported in this paper.
Figures


References
-
- Ahmed, W., Bivins, A., Stephens, M., Metcalfe, S., Smith, W. J. M., Sirikanchana, K., Kitajima, M., & Simpson, S. L. (2023). Occurrence of multiple respiratory viruses in wastewater in Queensland, Australia: Potential for community disease surveillance. Science of the Total Environment,864, 161023. 10.1016/j.scitotenv.2022.161023 - PMC - PubMed
-
- Ando, H., Ahmed, W., Iwamoto, R., Ando, Y., Okabe, S., & Kitajima, M. (2023). Impact of the COVID-19 pandemic on the prevalence of influenza A and respiratory syncytial viruses elucidated by wastewater-based epidemiology. Science of the Total Environment,880, 162694. 10.1016/j.scitotenv.2023.162694 - PMC - PubMed
-
- Asadi, M., Hamilton, D., Shomachuk, C., Oloye, F. F., De Lange, C., Pu, X., Osunla, C. A., Cantin, J., El-Baroudy, S., Mejia, E. M., Gregorchuk, B., Becker, M. G., Mangat, C., Brinkmann, M., Jones, P. D., Giesy, J. P., & McPhedran, K. N. (2023). Assessment of rapid wastewater surveillance for determination of communicable disease spread in municipalities. Science of the Total Environment,901, 166541. 10.1016/j.scitotenv.2023.166541 - PubMed
-
- Centers for Disease Control and Prevention (CDC). (2022). CDC’s influenza SARS-CoV-2 multiplex assay. https://archive.cdc.gov/www_cdc_gov/coronavirus/2019-ncov/lab/multiplex....
-
- Centers for Disease Control and Prevention (CDC). (2023). Types of influenza viruses. https://www.cdc.gov/flu/about/viruses/types.htm
MeSH terms
Substances
Grants and funding
LinkOut - more resources
Full Text Sources
Medical
Miscellaneous
