. 2025 Feb:79:103455.
doi: 10.1016/j.redox.2024.103455. Epub 2024 Dec 4.

Macrophage Dvl2 deficiency promotes NOD1-Driven pyroptosis and exacerbates inflammatory liver injury

Affiliations

Macrophage Dvl2 deficiency promotes NOD1-Driven pyroptosis and exacerbates inflammatory liver injury

Xiaoye Qu et al. Redox Biol. 2025 Feb.

Abstract

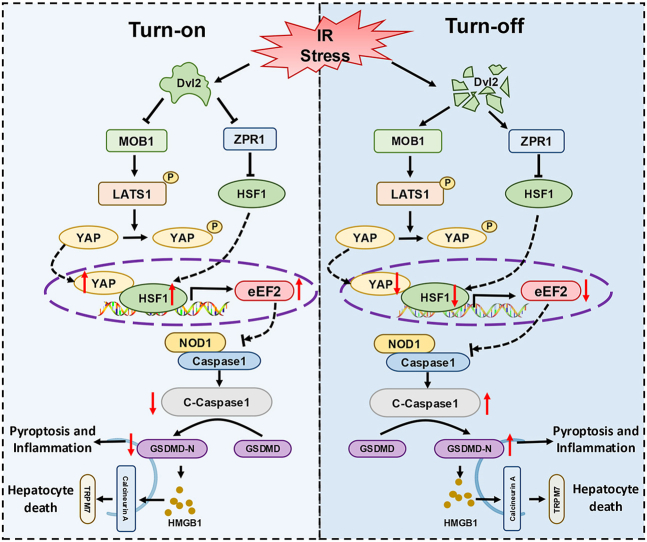
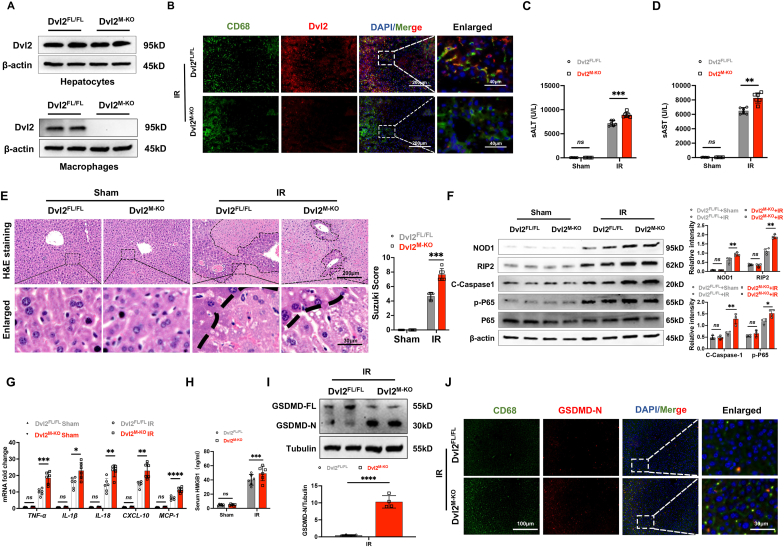
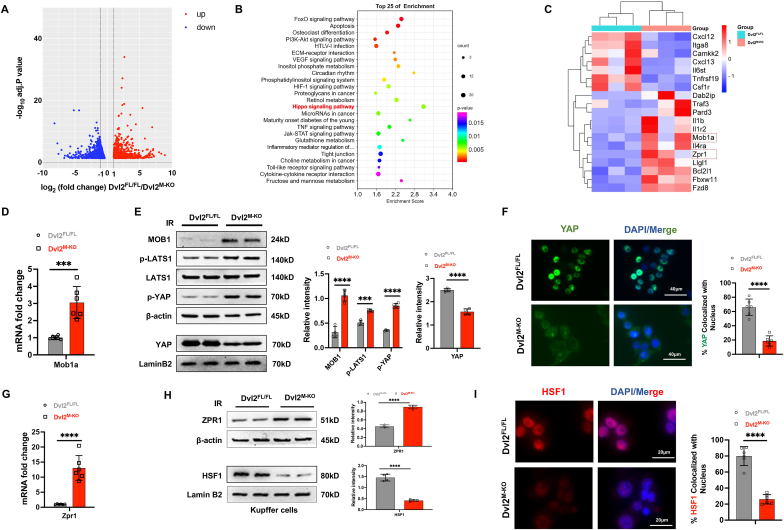
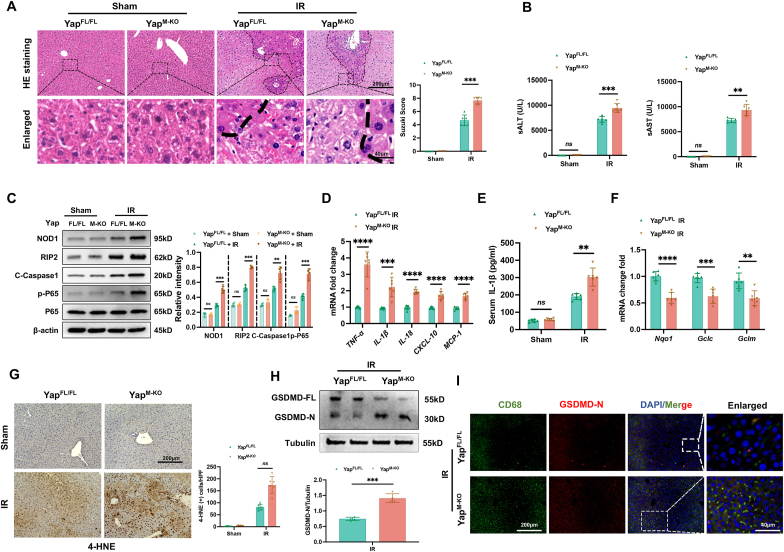
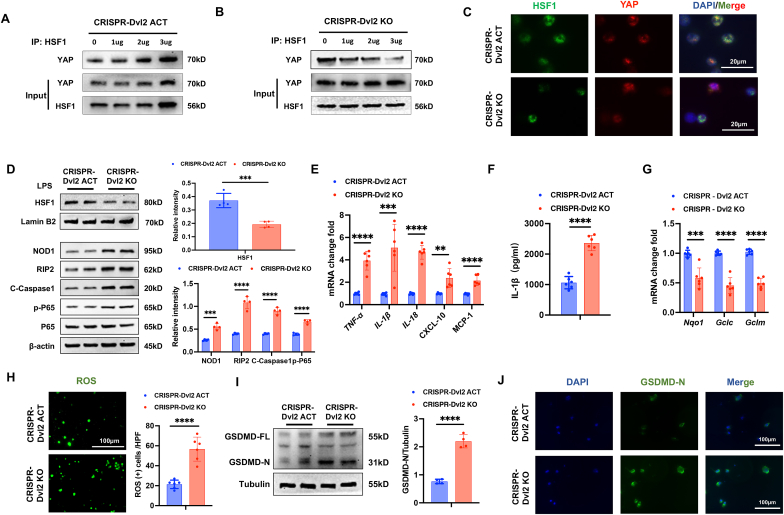
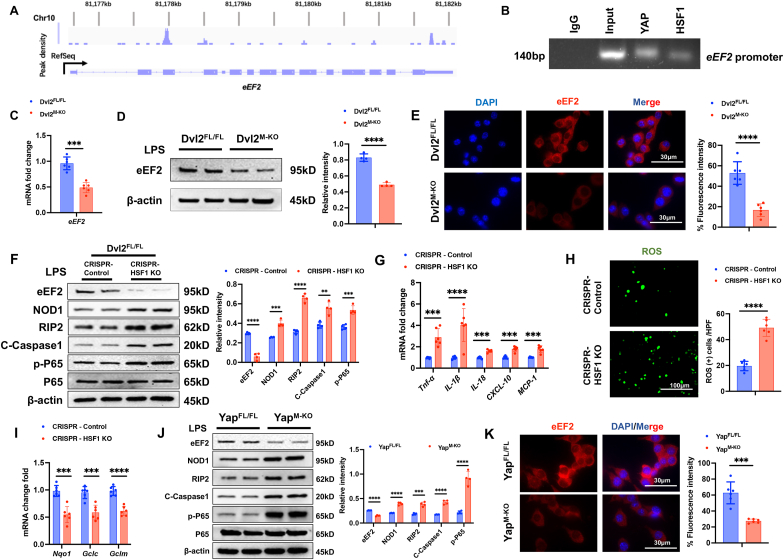
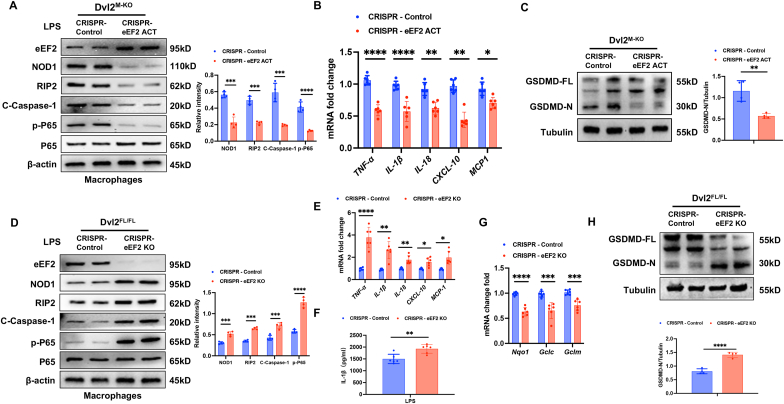
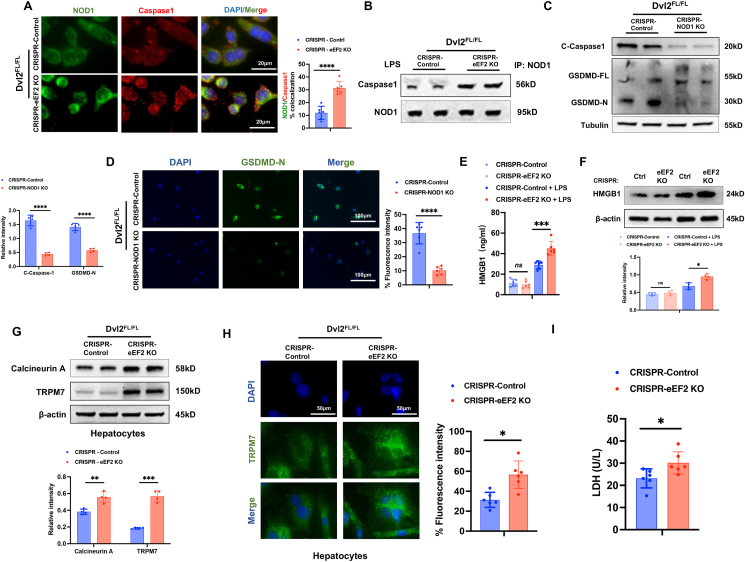
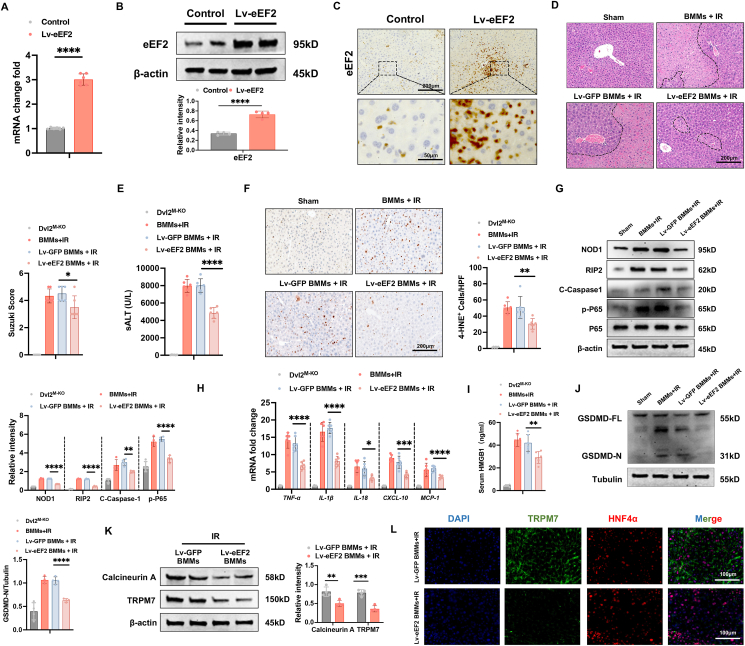
Dishevelled 2 (Dvl2) is a key mediator of the Wingless/Wnt signaling pathway that regulates cell proliferation, migration, and immune function. However, little is known about the role of macrophage Dvl2 in modulating NOD1-mediated pyroptosis and hepatocyte death in oxidative stress-induced inflammatory liver injury. In a mouse model of oxidative stress-induced liver inflammation, mice with myeloid-specific Dvl2 knockout (Dvl2M-KO) displayed exacerbated ischemia/reperfusion (IR) stress-induced hepatocellular damage with increased serum ALT levels, oxidative stress, and proinflammatory mediators. Unlike in Dvl2FL/FL controls, Dvl2M-KO enhanced NOD1, caspase-1, GSDMD, and NF-κB activation in liver macrophages after IR. Interestingly, IR stress enhanced YAP colocalized with HSF1 in Dvl2FL/FL macrophages, while macrophage Dvl2 deficiency reduced YAP and HSF1 colocalization in the nucleus under inflammatory conditions. Importantly, Dvl2 deletion diminished nuclear YAP interacted with HSF1 and augmented NOD1/caspase-1 and GSDMD activation in response to inflammatory stimulation. However, Dvl2 activation increased YAP interaction with HSF1 and activated HSF1 target gene eEF2, inhibiting NOD1/caspase-1, GSDMD, and NF-κB activity. Moreover, macrophage eEF2 deletion increased the NOD1-caspase-1 interaction, GSDMD activation, HMGB1 release, and hepatocyte LDH release after macrophage/hepatocyte co-culture. Adoptive transfer of eEF2-expressing macrophages in Dvl2M-KO mice alleviated IR-triggered liver inflammation and hepatocellular damage. Therefore, macrophage Dvl2 deficiency promotes NOD1-mediated pyroptosis and exacerbates IR-induced hepatocellular death by disrupting the YAP-HSF1 axis. eEF2 is crucial for modulating NOD1-driven pyroptosis, inflammatory response, and hepatocyte death. Our findings underscore a novel role of macrophage Dvl2 in modulating liver inflammatory injury and imply the therapeutic potential in organ IRI and transplant recipients.

Keywords: GSDMD; HSF1; TRPM7; YAP; eEF2.


Conflict of interest statement

Declaration of competing interest The authors declare that they have no competing interests.

Figures

Image 1
Graphical abstract
Fig. 1
Fig. 1
Disruption of myeloid-specific Dvl2 induces NOD1 and GSDMD activation and exacerbates IR stress-induced liver damage. The Dvl2FL/FL and Dvl2M−KO mice were subjected to 90min of partial liver warm ischemia, followed by 6h of reperfusion. (A) The Dvl2 expression was detected in hepatocytes and liver macrophages by Western blot assay. (B) Immunofluorescence staining of macrophage Dvl2 expression in the ischemic livers. Scale bars, 200 μm and 40 μm. (C and D) Liver function was evaluated by serum ALT and AST levels (IU/L) (n = 6 samples/group). (E) Representative histological staining (H&E) of ischemic liver tissue (n = 6 mice/group) and Suzuki’s histological score. Scale bars, 200 μm and 30 μm. (F) The protein expression of NOD1, cleaved caspase-1, p-P65, and P65 was detected by Western blot assay in ischemic livers from the Dvl2FL/FL and Dvl2M−KO mice. The graph shows the quantitation of relative intensity. (G) Quantitative RT-PCR-assisted detection of TNF-α, IL-1β, IL-18, CXCL-10, and MCP-1 in ischemic livers (n = 6 samples/group). (H) ELISA analysis of HMGB1 levels in the serum samples (n = 6 samples/group). (I) The full-length GSDMD (GSDMD-FL) and N-terminus of GSDMD (GSDMD-N) expression were detected in ischemic livers from the Dvl2FL/FL and Dvl2M−KO mice. (J) Immunofluorescence staining of macrophage GSDMD-N expression in ischemic livers from the Dvl2FL/FL and Dvl2M−KO mice. Scale bars, 200 μm and 40 μm. All Western blots represent four experiments, and the data represent the mean ± SD. Statistical analysis was performed using the Permutation t-test. ∗p < 0.05, ∗∗p < 0.01, ∗∗∗p < 0.001, ∗∗∗∗p < 0.0001.
Fig. 2
Fig. 2
Disruption of macrophage Dvl2 downregulates the YAP and HSF1 signaling pathways in IR-stressed liver. Liver macrophages (1 × 106/well) were isolated from the Dvl2FL/FL and Dvl2M−KO mice after liver IRI. Total RNA was extracted and subjected to a deep RNA-sequencing (RNA-seq) analysis. A modified Fisher’s exact test (enrichment score) was used for the functional enrichment analyses. Significantly upregulated or downregulated genes were determined by an adjusted p-value of less than 0.05 was set as the threshold to define DEGs, KEGG, and GO analysis. (A) The log2 fold changes of gene expression in IR-stressed Dvl2M−KO macrophages compared to the Dvl2FL/FL cells. Differentially expressed genes (DEGs) (n = 1487, p < 0.05) in Dvl2M−KO macrophages from the IR-stressed livers are indicated (red, upregulated, n = 856, and green, downregulated, n = 631). (B) Kyoto Encyclopedia of Genes and Genomes (KEGG) pathway enrichment analysis of transcripts differentially expressed in Dvl2M−KO macrophages from the IR-stressed livers. (C) Heat map showing the changed genes in Dvl2M−KO macrophages from the IR-stressed livers. (D) Analysis of Mob1a mRNA levels in Dvl2M−KO or Dvl2FL/FL macrophages from the IR-stressed livers (n = 6 samples/group). (E) Western blot analysis of MOB1, p-LATS1, LATS1, p-YAP, and nuclear YAP protein expression in the indicated groups. The graph shows the quantitation of relative intensity. (F) Immunofluorescence staining of nuclear YAP in Dvl2M−KO or Dvl2FL/FL macrophages from the IR-stressed livers. Scale bars, 40 μm. (G) Analysis of Zpr1 mRNA levels in Dvl2M−KO or Dvl2FL/FL macrophages from the IR-stressed livers (n = 6 samples/group). (H) Western blot analysis of Zpr1 and HSF1 protein expression in the indicated groups. The graph shows the quantitation of relative intensity. (I) Immunofluorescence staining of nuclear HSF1 in Dvl2M−KO or Dvl2FL/FL macrophages in the indicated groups. All Western blots represent four experiments, and the data represent the mean ± SD. Statistical analysis was performed using the Permutation t-test. ∗∗∗p < 0.001, ∗∗∗∗p < 0.0001.
Fig. 3
Fig. 3
YAP is required to regulate NOD1-mediated liver inflammation and pyroptotic cell death in IR-stressed liver. The YAPFL/FL and YAPM−KO mice were subjected to 90min of partial liver warm ischemia, followed by 6h of reperfusion. (A) Representative histological staining (H&E) of ischemic liver tissue (n = 6 mice/group) and Suzuki’s histological score. Scale bars, 200 μm, and 40 μm. (B) Liver function was evaluated by serum ALT and AST levels (IU/L) (n = 6 samples/group). (C) Western-assisted analysis and relative density ratio of NOD1, cleaved caspase-1, p-P65, and P-65 in the YAPFL/FL and YAPM−KO livers after IR stress. (D) Quantitative RT-PCR analysis of TNF-α, IL-1β, IL-18, CXCL-10, and MCP-1 mRNA levels in ischemic livers (n = 6 samples/group). (E) ELISA analysis of IL-1β levels in the serum samples (n = 6 samples/group). (F) Quantitative RT-PCR analysis of Nqo1, Gclc, and Gclm mRNA levels in ischemic livers (n = 6 samples/group). (G) Immunohistochemistry staining of 4-HNE in ischemic livers (n = 6 mice/group). Quantification of 4-HNE + cells, Scale bars, 200 μm. (H) The expression of the full-length GSDMD (GSDMD-FL) and N-terminus of GSDMD (GSDMD-N) was detected in ischemic livers from the YAPFL/FL and YAPM−KO mice. The graph shows the quantitation of relative intensity. (I) Immunofluorescence staining of macrophage GSDMD-N expression in the indicated groups. Scale bars, 200 μm and 40 μm. All Western blots represent four experiments, and the data represent the mean ± SD. Statistical analysis was performed using the Permutation t-test. ∗∗p < 0.01, ∗∗∗p < 0.001, ∗∗∗∗p < 0.0001.
Fig. 4
Fig. 4
Disruption of Dvl2 inhibits the YAP interaction with HSF1 and enhances NOD1 function in macrophages. Bone marrow-derived macrophages (BMMs, 1 × 106) were transfected with CRISPR/Cas9-mediated Dvl2 activation (CRISPR-Dvl2 ACT) or knockout vector (CRISPR-Dvl2 KO) (1 μg, 2 μg, and 3 μg, respectively), followed by LPS (100 ng/ml) stimulation for 6h. (A) Immunoprecipitation analysis of YAP and HSF1 in LPS-stimulated macrophages after transfection with CRISPR-Dvl2 ACT vector. (B) Immunoprecipitation analysis of YAP and HSF1 in LPS-stimulated macrophages after transfection with CRISPR-Dvl2 KO vector. (C) Immunofluorescence staining for macrophage HSF1 (green) and YAP (red) colocalization in the nucleus after LPS stimulation. DAPI was used to visualize nuclei (blue). Scale bars, 20 μm. (D) Western blot-assisted analysis and relative density ratio of HSF1, NOD1, cleaved caspase-1, p-P65, and P65 in LPS-stimulated macrophages. (E) Quantitative RT-PCR analysis of TNF-α, IL-1β, IL-18, CXCL-10, and MCP-1 mRNA levels in the indicated groups (n = 6 samples/group). (F) ELISA analysis of IL-1β levels in the culture supernatant (n = 6 samples/group). (G) Quantitative RT-PCR analysis of Nqo1, Gclc, and Gclm mRNA levels in the indicated groups (n = 6 samples/group). (H) Detection of ROS production by Carboxy-H2DFFDA in the indicated groups (n = 6 samples/group). Quantification of ROS-producing cells (green). Scale bars, 100 μm. (I) The expression of the full-length GSDMD (GSDMD-FL) and N-terminus of GSDMD (GSDMD-N) was detected in the indicated groups. Graph shows the quantitation of relative intensity. (J) Immunofluorescence staining of GSDMD-N expression in the indicated groups. Scale bars, 100 μm. All Western blots represent four experiments, and the data represent the mean ± SD. Statistical analysis was performed using the Permutation t-test. ∗∗p < 0.01, ∗∗∗p < 0.001, ∗∗∗∗p < 0.0001.
Fig. 5
Fig. 5
The YAP-HSF1 axis targets eEF2 and regulates NOD1 function in macrophages Bone marrow-derived macrophages (BMMs, 1 × 106) were collected and fixed after incubating LPS (100 ng/ml). Following chromatin shearing and HSF1 antibody selection, the precipitated DNA fragments bound by HSF1-containing protein complexes were used for sequencing. (A) Localization of HSF1-binding sites on the mouse eEF2 gene. The 14 exons, 15 introns, 3' untranslated region (UTR), 5’ UTR, and transcription start sites (TSS) of the mouse eEF2 gene on chromosome 10 are shown. (B) ChIP-PCR analysis of HSF1 and YAP binding to the eEF2 promoter. Protein-bound chromatin was prepared from BMMs and immunoprecipitated with HSF1 or YAP antibodies. For sequential ChIP, the protein-bound chromatin was first immunoprecipitated with the HSF1 antibody, followed by elution with a second immunoprecipitation using the YAP antibody. Then, the immunoprecipitated DNA was analyzed using PCR. The normal IgG was used as a negative control. (C) Analysis of eEF2 mRNA levels in LPS-stimulated macrophages from the Dvl2FL/FL and Dvl2M−KO mice (n = 6 samples/group). (D) Western blot analysis and relative density ratio of eEF2 in the indicated groups. (E) Immunofluorescence staining for eEF2 expression in LPS-stimulated macrophages from the Dvl2FL/FL and Dvl2M−KO mice (n = 6 samples/group). Scale bars, 30 μm. (F) Western blot analysis and relative density ratio of eEF2, NOD1, cleaved caspase-1, p-P65, and P65 in LPS-stimulated Dvl2FL/FL macrophages after transfection with CRISPR-HSF1 KO or control vector. (G) qRT-PCR analysis of TNF-α, IL-1β, IL-18, CXCL-10, and MCP-1 in LPS-stimulated macrophages in the indicated groups (n = 6 samples/group). (H) Detection of ROS production by Carboxy-H2DFFDA in the indicated groups (n = 6 samples/group). Quantification of ROS-producing cells (green). Scale bars, 100 μm. (I) Quantitative RT-PCR analysis of Nqo1, Gclc, and Gclm mRNA levels in the indicated groups (n = 6 samples/group). (J) Western blot analysis and relative density ratio of eEF2, NOD1, cleaved caspase-1, p-P65, and P65 in LPS-stimulated macrophages from the YAPFL/FL and YAPM−KO mice. (K) Immunofluorescence staining for eEF2 expression in LPS-stimulated macrophages from the YAPFL/FL and YAPM−KO mice (n = 6 samples/group). Scale bars, 30 μm. All Western blots represent four experiments, and the data represent the mean ± SD. Statistical analysis was performed using the Permutation t-test. ∗∗p < 0.01, ∗∗∗p < 0.001, ∗∗∗∗p < 0.0001.
Fig. 6
Fig. 6
eEF2 is required for the Dvl2-mediated immune regulation of NOD1 function in macrophages. (A) Bone marrow-derived macrophages (BMMs) were isolated from Dvl2M−KO mice and transfected with CRISPR/Cas9-mediated eEF2 activation (CRISPR-eEF2 ACT) or control vector followed by 6h of LPS (100 ng/ml) stimulation. Western-assisted analysis of eEF2, NOD1, cleaved caspase-1, p-P65 and P65. (B) qRT-PCR analysis of TNF-α, IL-1β, IL-18, CXCL-10, and MCP-1 in LPS-stimulated macrophages in the indicated groups (n = 6 samples/group). (C) The expression of the full-length GSDMD (GSDMD-FL) and N-terminus of GSDMD (GSDMD-N) was detected in the indicated groups. The graph shows the quantitation of relative intensity. (D) Bone marrow-derived macrophages (BMMs) were isolated from Dvl2FL/FL mice and transfected with CRISPR/Cas9-mediated eEF2 knockout (CRISPR-eEF2 KO) or control vector followed by 6h of LPS (100 ng/ml) stimulation. Western-assisted analysis of eEF2, NOD1, cleaved caspase-1, p-P65 and P65. (E) qRT-PCR analysis of TNF-α, IL-1β, IL-18, CXCL-10, and MCP-1 in LPS-stimulated macrophages in the indicated groups (n = 6 samples/group). (F) ELISA analysis of IL-1β levels in the culture supernatant (n = 6 samples/group). (G) Quantitative RT-PCR analysis of Nqo1, Gclc, and Gclm mRNA levels in the indicated groups (n = 6 samples/group). (H) The expression of the full-length GSDMD (GSDMD-FL) and N-terminus of GSDMD (GSDMD-N) was detected in the indicated groups. The graph shows the quantitation of relative intensity. All Western blots represent four experiments, and the data represent the mean ± SD. Statistical analysis was performed using the Permutation t-test. ∗p < 0.05, ∗∗p < 0.01, ∗∗∗p < 0.001, ∗∗∗∗p < 0.0001.
Fig. 7
Fig. 7
eEF2 is crucial to regulate NOD1-mediated macrophage pyroptosis and hepatocyte death in response to oxidative stress. (A) Bone marrow-derived macrophages (BMMs) were isolated from Dvl2FL/FL mice and transfected with CRISPR/Cas9-mediated eEF2 knockout (CRISPR-eEF2 KO) or control vector followed by 6h of LPS (100 ng/ml) stimulation. (A) Immunofluorescence staining for NOD1 (green) and caspase-1 (red) colocalization in LPS-stimulated macrophages (n = 6 samples/group). DAPI was used to visualize nuclei. Scale bars, 20 μm. (B) Immunoprecipitation analysis of caspase-1 and NOD1 in LPS-stimulated macrophages. (C) BMMs were isolated from Dvl2FL/FL mice and transfected with CRISPR/Cas9-mediated NOD1 knockout (CRISPR-NOD1 KO) or control vector followed by 6h of LPS (100 ng/ml) stimulation. Western blot analysis and relative density ratio of cleaved caspase-1, the full-length GSDMD (GSDMD-FL), and N-terminus of GSDMD (GSDMD-N) in LPS-stimulated macrophages. (D) Immunofluorescence staining of GSDMD-N expression in the indicated groups. Scale bars, 100 μm. (E) Western blot analysis and relative density ratio of HMGB1 in the indicated groups. (F) ELISA analysis of supernatant HMGB1 levels in CRISPR-eEF2 KO or control vector-treated BMMs after LPS stimulation (n = 6 samples/group). (G) BMMs from the Dvl2FL/FL mice were transfected with CRISPR/Cas9-mediated eEF2 knockout (CRISPR-eEF2 KO) or control vector followed by 6h of LPS (100 ng/ml) stimulation and then co-cultured with primary hepatocytes for 24h. Western blot analysis and relative density ratio of Calcineurin A and TRPM7 in primary hepatocytes after co-culture with CRISPR-eEF2 KO or control vector macrophages. (H) Immunofluorescence staining for TRPM7 expression in primary hepatocytes (n = 6 samples/group). DAPI was used to visualize nuclei. Scale bars, 50 μm. (I) LDH release from the primary hepatocytes in co-cultures (n = 6 samples/group). All Western blots represent four experiments, and the data represent the mean ± SD. Statistical analysis was performed using the Permutation t-test. ∗p < 0.05, ∗∗p < 0.01, ∗∗∗p < 0.001, ∗∗∗∗p < 0.0001.
Fig. 8
Fig. 8
Adoptive transfer of eEF2-expressing macrophages alleviates NOD1-driven inflammation, pyroptosis, and hepatocyte death in IR-stressed livers. The Dvl2M−KO mice were injected via tail vein with bone marrow-derived macrophages (BMMs, 1 × 106 cells/mouse) transfected with lentiviral-expressing eEF2 (Lv-eEF2) or GFP control (Lv-GFP) 24h before ischemia. (A) Quantitative RT-PCR analysis of eEF2 mRNA levels in IR-stressed livers 24h after tail vein injection (n = 6 samples/group). (B) Western blot analysis and relative density ratio of eEF2 protein expression in ischemic livers after Lv-eEF2 or control BMM treatment. (C) Immunohistochemistry staining of eEF2 in IR-stressed livers 24h after tail vein injection (n = 6 mice/group). Scale bars, 200 μm and 50 μm. (D) Representative histological staining (H&E) of ischemic liver tissue (n = 6 mice/group) and Suzuki’s histological score. Scale bars, 200 μm. (E) sALT levels (IU/L) (n = 6 samples/group). (F) Immunohistochemistry staining of 4-HNE+ cells in IR-stressed livers (n = 6 mice/group). Quantification of 4-HNE+ cells, Scale bars, 200 μm. (G) Western-assisted analysis and relative density ratio of NOD1, p-P65, and P-65 in the indicated groups. (H) qRT-PCR analysis of TNF-α, IL-1β, IL-6, CXCL-10, and MCP-1 in IR-stressed livers (n = 6 samples/group). (I) ELISA analysis of serum HMGB1 levels (n = 6 samples/group). (J) The full-length GSDMD (GSDMD-FL) and N-terminus of GSDMD (GSDMD-N) expression were detected in IR-stressed Dvl2M−KO livers after Lv-eEF2 or control BMM treatment. The graph shows the quantitation of relative intensity. (K) Western-assisted analysis and relative density ratio of Calcineurin A and TRPM7 in the indicated groups. (L) Immunofluorescence staining for TRPM7 expression in hepatocytes from the Dvl2M−KO mice after adoptive transfer of Lv-eEF2 expressing or control BMMs. (n = 6 samples/group). DAPI was used to visualize nuclei. Scale bars, 100 μm. All Western blots represent four experiments, and the data represent the mean ± SD. Statistical analysis was performed using the Permutation t-test. ∗p < 0.05, ∗∗p < 0.01, ∗∗∗p < 0.001, ∗∗∗∗p < 0.0001.

References

    1. Li C., Sheng M., Lin Y., Xu D., Tian Y., Zhan Y., Jiang L., et al. Functional crosstalk between myeloid Foxo1-beta-catenin axis and Hedgehog/Gli1 signaling in oxidative stress response. Cell Death Differ. 2021;28:1705–1719. - PMC - PubMed
    1. Wu L., Xiong X., Wu X., Ye Y., Jian Z., Zhi Z., Gu L. Targeting oxidative stress and inflammation to prevent ischemia-reperfusion injury. Front. Mol. Neurosci. 2020;13:28. - PMC - PubMed
    1. Yue S., Zhu J., Zhang M., Li C., Zhou X., Zhou M., Ke M., et al. The myeloid heat shock transcription factor 1/beta-catenin axis regulates NLR family, pyrin domain-containing 3 inflammasome activation in mouse liver ischemia/reperfusion injury. Hepatology. 2016;64:1683–1698. - PMC - PubMed
    1. Lu L., Yue S., Jiang L., Li C., Zhu Q., Ke M., Lu H., et al. Myeloid Notch1 deficiency activates the RhoA/ROCK pathway and aggravates hepatocellular damage in mouse ischemic livers. Hepatology. 2018;67:1041–1055. - PMC - PubMed
    1. Chakrabarti S., Visweswariah S.S. Intramacrophage ROS primes the innate immune system via JAK/STAT and toll activation. Cell Rep. 2020;33 - PMC - PubMed

Substances