. 2025 Jan;48(1):100167.
doi: 10.1016/j.mocell.2024.100167. Epub 2024 Dec 5.

The disordered effector RipAO of Ralstonia solanacearum destabilizes microtubule networks in Nicotiana benthamiana cells

Affiliations

The disordered effector RipAO of Ralstonia solanacearum destabilizes microtubule networks in Nicotiana benthamiana cells

Hyelim Jeon et al. Mol Cells. 2025 Jan.

Abstract

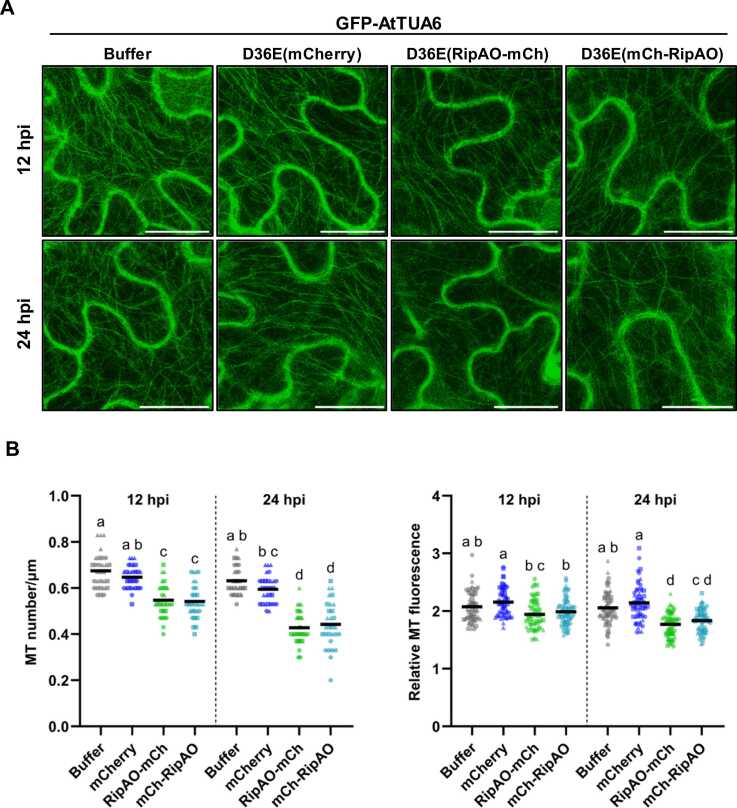
Ralstonia solanacearum causes bacterial wilt, a devastating disease in solanaceous crops. The pathogenicity of R. solanacearum depends on its type III secretion system, which delivers a suite of type III effectors into plant cells. The disordered core effector RipAO is conserved across R. solanacearum species and affects plant immune responses when transiently expressed in Nicotiana benthamiana. Specifically, RipAO impairs pathogen-associated molecular pattern-triggered reactive oxygen species production, an essential plant defense mechanism. RipAO fused to yellow fluorescent protein initially localizes to filamentous structures, resembling the cytoskeleton, before forming large punctate aggregates around the nucleus. Consistent with these findings, tubulin alpha 6 (TUA6) and tubulin beta-1, building blocks of microtubules, were identified as putative targets of RipAO in immunoprecipitation and mass spectrometry analyses. In the presence of RipAO, TUA6-labeled microtubules fragmented into puncta, mimicking the effects of oryzalin, a microtubule polymerization inhibitor. These effects were corroborated in a N. benthamiana transgenic line constitutively expressing green fluorescent protein-labeled TUA6, where RipAO reduced microtubule density and stability at an accumulation level that did not induce aggregation. Moreover, oryzalin treatment further enhanced RipAO's impairment of reactive oxygen species production, suggesting that RipAO disrupts microtubule networks via its association with tubulins, leading to immune suppression. Further research into RipAO's interaction with the microtubule network will enhance our understanding of bacterial strategies to subvert plant immunity.

Keywords: Cytoskeleton; Heterologous expression; Reactive oxygen species; Type III secreted effector; Virulence.


Conflict of interest statement

Declaration of Competing Interests The authors declare that they have no known competing financial interests or personal relationships that could have appeared to influence the work reported in this paper.

Figures

Fig. 1
Fig. 1
RipAO impairs flg22-triggered ROS production and enhances bacterial growth in N. benthamiana. (A) flg22-triggered ROS production in N. benthamiana leaf tissues expressing RipAO. RipAO-YFP or GFP were transiently expressed via agroinfiltration. Leaf disks were challenged with water or flg22 at 36 hours post agroinfiltration and ROS production was monitored for 6 hours. Solid line and shaded band present the mean values ± standard error of relative light unit (RLU) from a representative experiment (n = 12). Individual values of the total ROS production from 3 independent experiments are shown in boxes and whiskers (n = 32) on the right. (B) Growth of P. syringae pv. tomato DC3000 effectorless mutant D36E delivering RipAO in N. benthamiana. D36E carrying the empty vector (EV), RipP2, or RipAO were infiltrated into N. benthamiana leaves and the bacterial populations were enumerated at 0 and 3 days post inoculation (dpi) as colony-forming unit (CFU). Individual values from 3 independent experiments are shown in boxes and whiskers (n = 15). Different letters indicate significant differences determined by 1-way ANOVA followed by Tukey’s multiple comparisons test (P < .0001).
Fig. 2
Fig. 2
RipAO exhibits dynamic changes in subcellular localization during transient expression in N. benthamiana. (A) Subcellular localization of RipAO at different time points after agroinfiltration. RipAO-YFP and mCherry were coexpressed in N. benthamiana leaves and the subcellular localization in lower epidermal cells was analyzed by confocal microscopy at 24, 36, and 48 hours post infiltration (hpi). (B) Effect of microtubule inhibitors on RipAO-labeled structures. Leaf disks expressing RipAO-YFP were floated on a solution of oryzalin for 3 hours before observation. Taxol was infiltrated to the leaf area expressing RipAO-YFP 4 hours after agroinfiltration. Scale bars = 20 µm.
Fig. 3
Fig. 3
RipAO associates with tubulins in planta. Bimolecular fluorescence complementation (BiFC) analysis of RipAO association with tubulin. RipAO fused with the N-terminal part of the YFP (RipAO-YFPn) was coexpressed with free C-terminal part of the YFP (YFPc), YFPc-NbTUA6, or YFPc-NbTUB1. Taxol or DMSO were infiltrated to the same leaf area 4 hours after agroinfiltration. The YFP signals in lower epidermal cells were detected by confocal microscopy at 48 hours post agroinfiltration. BF, bright field. Scale bars = 20 µm.
Fig. 4
Fig. 4
RipAO destabilizes NbTUA6-labeled microtubule networks, leading to aggregation of microtubule fragments. Dynamics of RipAO and NbTUA6 colocalization. RipAO-CFP and YFP-NbTUA6 were coexpressed in N. benthamiana leaves and the subcellular localization in lower epidermal cells was analyzed by confocal microscopy at 24, 36, and 48 hours post infiltration (hpi). Fluorescence intensity profiles along the dashed line are shown in the right panels. Scale bars = 20 µm.
Fig. 5
Fig. 5
RipAO can destabilize microtubule filaments at the non–aggregate-triggering level. Destabilization of TUA6-labeled microtubule (MT) filaments by RipAO expression. (A) Confocal images of lower epidermal cells of GFP-AtTUA6 transgenic N. benthamiana–expressing mCherry or mCherry-RipAO 48 hours after agroinfiltration. Scale bars = 20 µm. (B) Quantification of MT destabilization by RipAO expression. Density and relative fluorescence of MT filaments were measured from the confocal images acquired in (A). Dots and bars present individual values and the median from 3 independent experiments, respectively (n = 15 for MT number/μm, n = 60 for relative MT fluorescence). Different letters indicate significant differences determined by 1-way ANOVA followed by Tukey’s multiple comparisons test (P < .05).
Fig. 6
Fig. 6
Type III secretion system–delivered RipAO destabilizes microtubule filaments. Destabilization of TUA6-labeled microtubule (MT) filaments by P. syringae pv. tomato DC3000 effectorless mutant D36E delivering RipAO. (A) Confocal images of lower epidermal cells of GFP-AtTUA6 transgenic N. benthamiana infiltrated with D36E carrying mCherry, RipAO-mCherry (RipAO-mCh), or mCherry-RipAO (mCh-RipAO) at 12 and 24 hours post infiltration (hpi). Scale bars = 20 µm. (B) Quantification of MT destabilization by RipAO delivery. Density and relative fluorescence of MT filaments were measured from the confocal images acquired in (A). Dots and bars present individual values and the median from 3 independent experiments, respectively (n = 30 for MT number/μm, n = 60 for relative MT fluorescence). Different letters indicate significant differences determined by 1-way ANOVA followed by Tukey’s multiple comparisons test (P < .05).
Fig. 7
Fig. 7
Oryzalin treatment exacerbates RipAO suppression of flg22-triggered ROS production. flg22-triggered ROS production in N. benthamiana leaf tissues expressing RipAO and pretreated with DMSO or oryzalin for 3 hours. The leaf disks were challenged with flg22 solution containing DMSO or oryzalin at 36 hours post agroinfiltration and ROS production was monitored for 60 minutes. Solid line and shaded band present the mean values ± standard error of relative light unit (RLU) from a representative experiment (n = 12). Individual values of the total ROS production from 4 independent experiments are shown in boxes and whiskers (n = 48). Different letters indicate significant differences determined by 1-way ANOVA followed by Tukey’s multiple comparisons test (P < .05).

Similar articles

Cited by

References

    1. Abramson J., Adler J., Dunger J., Evans R., Green T., Pritzel A., Ronneberger O., Willmore L., Ballard A.J., Bambrick J., et al. Accurate structure prediction of biomolecular interactions with AlphaFold 3. Nature. 2024;630:493–500. - PMC - PubMed
    1. Aung K., Xin X., Mecey C., He S.Y. Subcellular localization of Pseudomonas syringae pv. tomato effector proteins in plants. Methods Mol. Biol. 2017;1531:141–153. - PMC - PubMed
    1. Binet M.N., Humbert C., Lecourieux D., Vantard M., Pugin A. Disruption of microtubular cytoskeleton induced by cryptogein, an elicitor of hypersensitive response in tobacco cells. Plant Physiol. 2001;125:564–572. - PMC - PubMed
    1. Brandizzi F., Wasteneys G.O. Cytoskeleton-dependent endomembrane organization in plant cells: an emerging role for microtubules. Plant J. 2013;75:339–349. - PubMed
    1. Bücherl C.A., Jarsch I.K., Schudoma C., Segonzac C., Mbengue M., Robatzek S., MacLean D., Ott T., Zipfel C. Plant immune and growth receptors share common signalling components but localise to distinct plasma membrane nanodomains. eLife. 2017;6 - PMC - PubMed

MeSH terms

LinkOut - more resources