. 2025 Feb:79:103456.
doi: 10.1016/j.redox.2024.103456. Epub 2024 Dec 5.

Hydrogen sulfide attenuates disturbed flow-induced vascular remodeling by inhibiting LDHB-mediated autophagic flux

Affiliations

Hydrogen sulfide attenuates disturbed flow-induced vascular remodeling by inhibiting LDHB-mediated autophagic flux

Xia Wang et al. Redox Biol. 2025 Feb.

Abstract

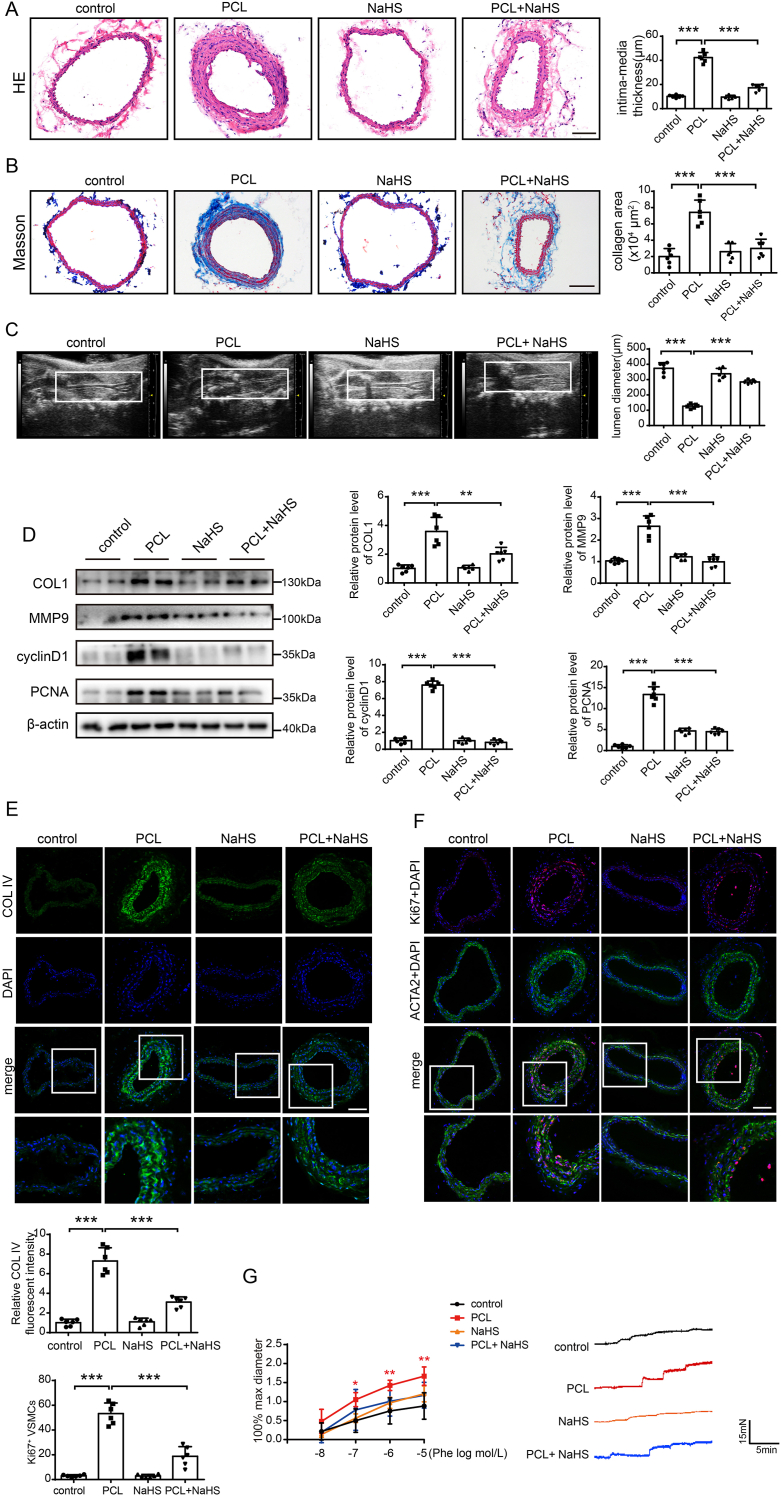
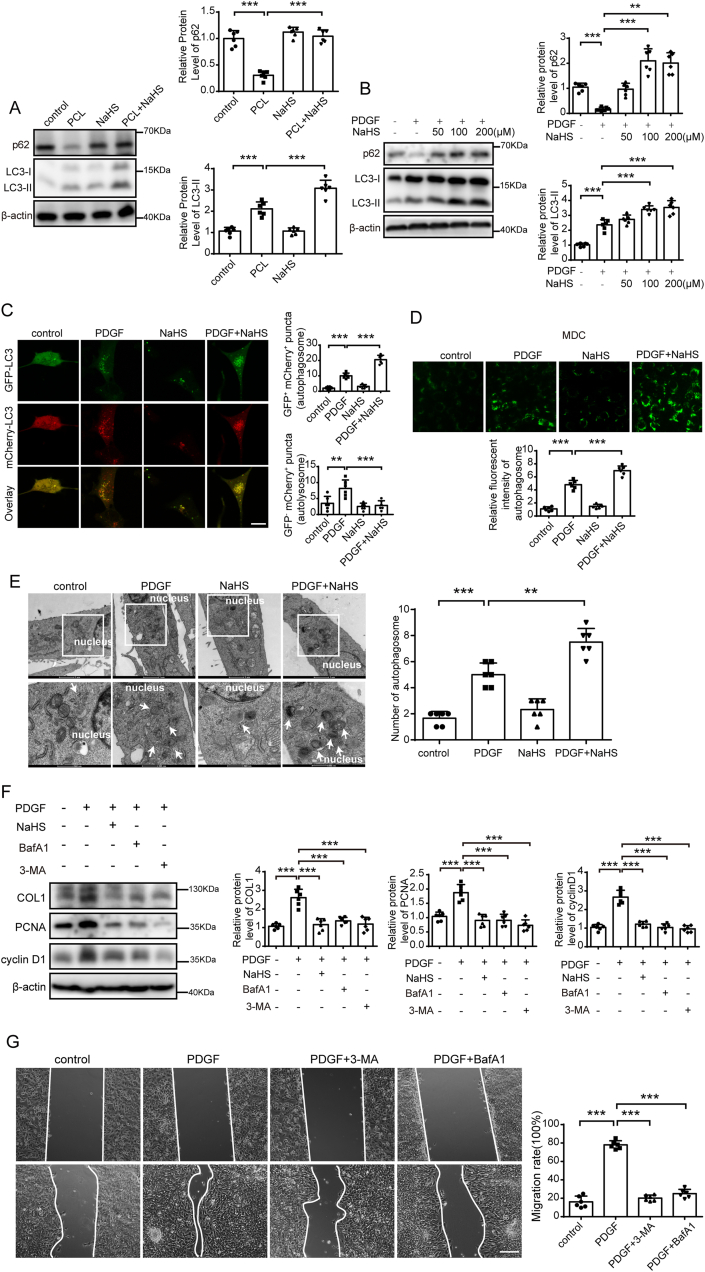
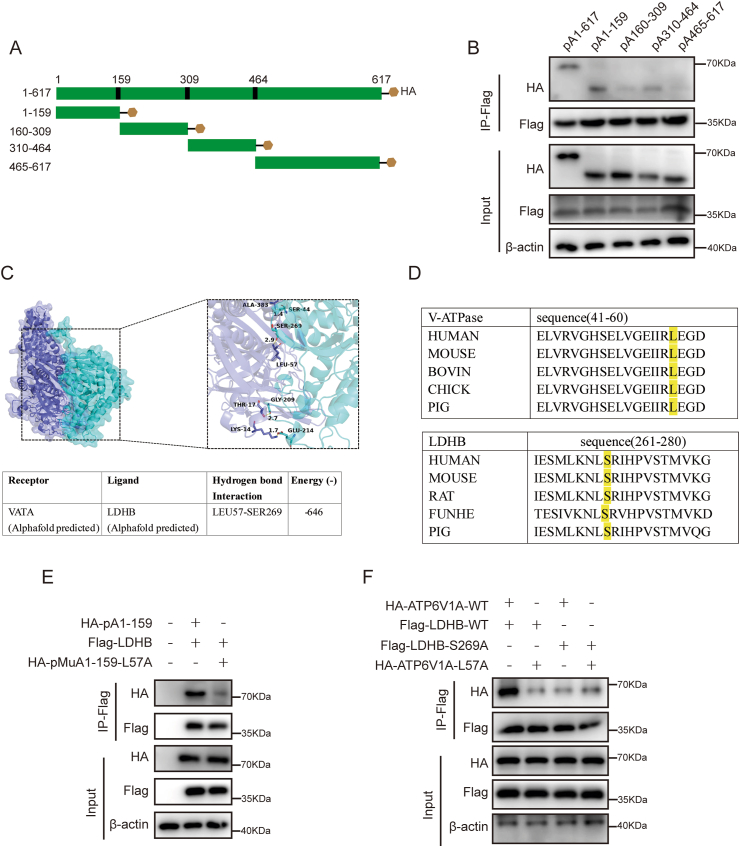
Disturbed flow (DF) plays a critical role in the development and progression of cardiovascular disease (CVD). Hydrogen sulfide (H2S) is involved in physiological processes within the cardiovascular system. However, its specific contribution to DF-induced vascular remodeling remains unclear. Here, we showed that the H2S donor, NaHS suppressed DF-induced vascular remodeling in mice. Further experiments demonstrated that NaHS inhibited the proliferation and migration of vascular smooth muscle cells (VSMCs) induced by platelet-derived growth factor-BB (PDGF), as well as the autophagy triggered by DF and PDGF. Mechanistically, RNA-Seq results revealed that NaHS counteracted the PDGF-induced upregulation of lactate dehydrogenase B (LDHB). Overexpression of LDHB abolished the protective effect of NaHS on DF-induced vascular remodeling. Furthermore, LDHB interacted with vacuolar-type proton ATPase catalytic subunit A (ATP6V1A), leading to lysosomal acidification, a process that was attenuated by NaHS treatment. The residues of leucine (Leu) 57 in ATP6V1A and serine (Ser) 269 in LDHB are critical for their interaction. Notably, the expression of LDHB was found to be elevated in vascular tissues from patients with abdominal aortic aneurysms (AAA) and thoracic aortic aneurysms (TAA). These data identify a molecular mechanism by which H2S attenuates DF-induced vascular remodeling by inhibiting LDHB and disrupting the interaction between LDHB and ATP6V1A, thereby impeding the autophagy process. Our findings provide insight that H2S or targeting LDHB has therapeutic potential for preventing and treating vascular remodeling.

Keywords: Autophagy; Disturbed flow; Hydrogen sulfide; Lactate dehydrogenase B; Vacuolar-type proton ATPase catalytic subunit A.


Conflict of interest statement

Declaration of competing interest The authors declare that they have no competing interests.

Figures

Fig. 1
Fig. 1
NaHS attenuated DF-induced vascular remodeling in mice. The left carotid artery in mice was partially ligated for four weeks. Then, mice were treated with NaHS (50 μmol/kg/day) or with 200 μL of 0.9 % NaCl every day after ligation. A, B. Representative images of HE and Masson staining, the quantification of intima-media thickness, and collagen content were shown in the right panel, n = 6, ∗∗∗p < 0.001. Scale bars = 50 μm. C. Carotid arteries of mice were performed with ultrasound imaging. Vascular lumen diameter was detected. Data were quantified in the right panel, n = 6, ∗∗∗p < 0.001. D. The expression of COL1, MMP9, cyclinD1, and PCNA was determined by Western blot. The relative expression of each target protein was normalized to β-actin, and the fold change was calculated by comparing it to the control group. Data were quantified in the right panel, n = 6, ∗∗p < 0.01, ∗∗∗p < 0.001. E, F. Immunofluorescence staining of COL IV, Ki67, and ACTA2 was performed in carotid cryosections of mice. n = 6, ∗∗∗p < 0.001. Scale bars = 50 μm. Data were quantified in the lower panel. G. Vasoconstriction of the carotid artery was measured by wire-Myograph. n = 6, ∗p < 0.05, ∗∗p < 0.01.
Fig. 2
Fig. 2
NaHS inhibited PDGF-induced proliferation and migration of VSMCs. rVSMCs and MOVAs were treated with NaHS (200 μM) and PDGF (20 ng/mL) for 24 h. A, B. The protein levels of COL1, cyclinD1, and PCNA in rVSMCs and MOVAs were determined by Western blot. Data were quantified in the lower panel. n = 6, ∗∗∗p < 0.001. C, D. Immunofluorescence staining of COL1 and Ki67 was performed in MOVAs. The quantification of COL1 and Ki67 expression were shown in the lower panel. n = 6, ∗∗∗p < 0.001. Scale bars = 50 μm. E. The migration of MOVAs was determined by wound healing. Data were quantified in the right panel. n = 6, ∗∗∗p < 0.001. Scale bars = 50 μm.
Fig. 3
Fig. 3
NaHS reduced autophagy that was induced by DF or PDGF in VSMCs. A. The expression of p62 and LC3-I/II in carotid arteriy tissues was determined by Western blot. Data were quantified in the right panel, n = 6, ∗∗∗p < 0.001. B. MOVAs were treated with NaHS (200 μM) and PDGF (20 ng/mL) for 24 h. The protein levels of p62 and LC3-II in MOVAs were determined by Western blot. Data were quantified in the right panel, n = 6, ∗∗p < 0.01, ∗∗∗p < 0.001. C. To observe autophagy, cells were infected with a tandem-labeled mCherry-GFP-LC3 adenovirus. The autophagosomes are represented as yellow dots or puncta and the autolysosomes are represented as red dots or puncta. Data were quantified in the right panel, n = 6, ∗∗∗p < 0.001. Scale bars = 10 μm. D. MDC staining of MOVAs was performed to observe autophagosomes. The number of autophagosomes was quantified in the lower panel. Data were quantified in the lower panel, n = 6, ∗∗∗p < 0.001. Scale bars = 50 μm. E. Autophagosomes in MOVAs were observed by TEM. The white arrows indicate autophagosomes. Data were quantified in the right panel, n = 6, ∗∗p < 0.01, ∗∗∗p < 0.001. F. MOVAs were treated with PDGF (20 ng/mL) in the presence or absence of NaHS (200 μM), BafA1 (50 nM) or 3-MA (5 mM) for 24 h. The protein levels of COL1, cyclinD1, and PCNA were determined by Western blot. Data were quantified in the right panel, n = 6, ∗∗∗p < 0.001. G. The migration of MOVAs was determined by wound healing. Data were quantified in the right panel, n = 6, ∗∗∗p < 0.001. Scale bars = 50 μm.
Fig. 4
Fig. 4
NaHS reduced DF or PDGF-induced increase of LDHB. A-D. MOVAs were treated with NaHS (200 μM) and PDGF (20 ng/mL) for 24 h. RNA-Seq was performed and the different expressed genes were analyzed. Heatmap, KEGG and volcano plot were shown in A-D. E. mRNA level of LDHB in MOVAs was detected by RT-PCR, n = 6, ∗∗p < 0.01, ∗∗∗p < 0.001. F. Immunofluorescence staining of LDHB was performed in MOVAs. Data were quantified in the lower panel, n = 6, ∗∗∗p < 0.001. Scale bars = 50 μm. G. The protein level of LDHB in MOVAs was determined by Western blot. Data were quantified in the right panel, n = 6, ∗∗∗p < 0.001. H. The protein level of LDHB in carotid arteries was determined by Western blot. Data were quantified in the right panel, n = 6, ∗∗∗p < 0.001. I-J. Double-labeling immunofluorescence of LDHB and ACTA2, or LDHB and CD68, was performed in carotid arteries. Data were quantified in the lower panel, n = 6, ∗∗∗p < 0.001. Scale bars = 50 μm.
Fig. 5
Fig. 5
Overexpression of LDHB abolished the protective effect of H2S. A. The experimental procedure of AAV injection. B. Representative images of HE staining, the quantification of intima-media thickness was shown in the lower panel. n = 6, ∗∗∗p < 0.001. Scale bars = 50 μm. C. Carotid arteries of mice were performed with ultrasound imaging. Data were quantified in the lower panel. n = 6, ∗∗∗p < 0.001. D. The protein levels of COL1 and cyclinD1 in carotid arteries were determined by Western blot. Data was quantified in the right panel. n = 6, ∗∗∗p < 0.001. E, F. Immunofluorescence staining of COL IV, Ki67 and ACTA2 in carotid arteries. Data were quantified in the right panel. n = 6, ∗∗∗p < 0.001. Scale bars = 50 μm. G. LDHB-OE or NC-OE plasmid was transfected into MOVAs for 24 h and then treated with indicated reagents. The protein levels of COL1, and cyclinD1 in MOVAs were determined by Western blot. Data were quantified in the right panel. n = 6, ∗∗∗p < 0.001. H. The migration of MOVAs was determined by wound healing. Data were quantified in the right panel. n = 6, ∗p < 0.05. Scale bars = 100 μm.
Fig. 6
Fig. 6
NaHS inhibited the interaction between LDHB and ATP6V1A and reduced ATP6V1A-dependent lysosomal acidification. A, B. MOVAs were treated with NaHS (200 μM) and PDGF (20 ng/mL) for 24 h. Whole-cell lysates were immunoprecipitated and then immunoblotted with antibodies against the indicated proteins. C. PLA was performed to detect the interaction of LDHB and ATP6V1A. Data were quantified in the lower panel. ∗∗∗p < 0.001.Scale bar = 50 μm. D. Co-localization of LDHB and ATP6V1A in MOVAs was examined by immunofluorescence. Data were quantified in the lower panel. n = 6, ∗∗∗p < 0.001. Scale bars = 50 μm. E. LDHB-GFP plasmid was transfected into MOVAs for 24 h and then stimulated with PDGF in the presence or absence of NaHS. Lyso-Tracker Red was used to label lysosomes. Data were quantified in the lower panel. n = 6, ∗∗∗p < 0.001.Scale bars = 20 μm. F. Lysosomal pH of MOVAs was measured by FITC-dextran staining (0.5 mg/mL). Data were quantified in the right panel. n = 6, ∗∗∗p < 0.001. Scale bars = 50 μm.
Fig. 7
Fig. 7
Identification of the domains of ATP6V1A and LDHB involved in their interaction. A. Schematic diagram illustrating the design of full-length HA-tagged ATP6V1A and the ATP6V1A truncates tagged with HA. B. HEK293T cells were co-transfected with these constructs, followed by IP assay using anti-Flag beads. Subsequent immunoblotting was performed with both anti-Flag and anti-HA antibodies to detect the expression of the constructs. C. The predicted structures of ATP6V1A and LDHB were generated using Alphafold. D. The conserved sequences containing L57 of ATP6V1A and S269 of LDHB were shown. E, F HEK293T cells were co-transfected with corresponding constructs and the cell lysates were collected for IP assays using beads conjugated with anti-Flag and anti-HA antibodies.
Fig. 8
Fig. 8
The expression of LDHB was up-regulated in VSMCs of human TAA and AAA. A. Co-localization of LDHB and ACTA2 in human TAA and AAA were analyzed by immunofluorescence staining. Data were quantified in the right panel. n = 6, ∗∗∗p < 0.001. Scale bars = 50 μm. B. The mRNA level of LDHB in aortic tissues was detected by RT-PCR. n = 5, ∗∗∗p < 0.001. C. Schematic diagram of this study. H2S attenuates DF-induced vascular remodeling by inhibiting the interaction between LDHB and ATP6V1A. The disruption of this interaction prevents lysosomal acidification and autophagic flux, thereby suppressing VSMC proliferation and migration.
figs1
figs1
figs2
figs2
figs3
figs3
figs4
figs4
figs5
figs5
figs6
figs6

References

    1. Browne L.D., Bashar K., Griffin P., Kavanagh E.G., Walsh S.R., Walsh M.T. The role of shear stress in arteriovenous fistula maturation and failure: a systematic review. PLoS One. 2015;10 doi: 10.1371/journal.pone.0145795. - DOI - PMC - PubMed
    1. Mendez P.L., Obendorf L., Jatzlau J., Burdzinski W., Reichenbach M., Nageswaran V., Haghikia A., Stangl V., Hiepen C., Knaus P. Atheroprone fluid shear stress-regulated ALK1-Endoglin-SMAD signaling originates from early endosomes. BMC Biol. 2022;20:210. doi: 10.1186/s12915-022-01396-y. - DOI - PMC - PubMed
    1. Wang X., Fu W., Zhou G., Huo H., Shi X., Wang H., Wang Y., Huang X., Shen L., Long L., He B. Endothelial cell-derived cholesterol crystals promote endothelial inflammation in early atherogenesis. Antioxid Redox Signal. 2024 doi: 10.1089/ars.2023.0498. - DOI - PubMed
    1. Davis M.J., Earley S., Li Y.S., Chien S. Vascular mechanotransduction. Physiol. Rev. 2023;103:1247–1421. doi: 10.1152/physrev.00053.2021. - DOI - PMC - PubMed
    1. Jinnouchi H., Sakakura K., Wada H., Ishida K., Arao K., Kubo N., Sugawara Y., Funayama H., Ako J., Momomura S. Effect of chronic statin treatment on vascular remodeling determined by intravascular ultrasound in patients with acute myocardial infarction. Am. J. Cardiol. 2014;113:924–929. doi: 10.1016/j.amjcard.2013.11.054. - DOI - PubMed

LinkOut - more resources