. 2025 Feb:79:103449.
doi: 10.1016/j.redox.2024.103449. Epub 2024 Nov 29.

Macrophage metabolic reprogramming ameliorates diabetes-induced microvascular dysfunction

Affiliations

Macrophage metabolic reprogramming ameliorates diabetes-induced microvascular dysfunction

Qiu-Yang Zhang et al. Redox Biol. 2025 Feb.

Abstract

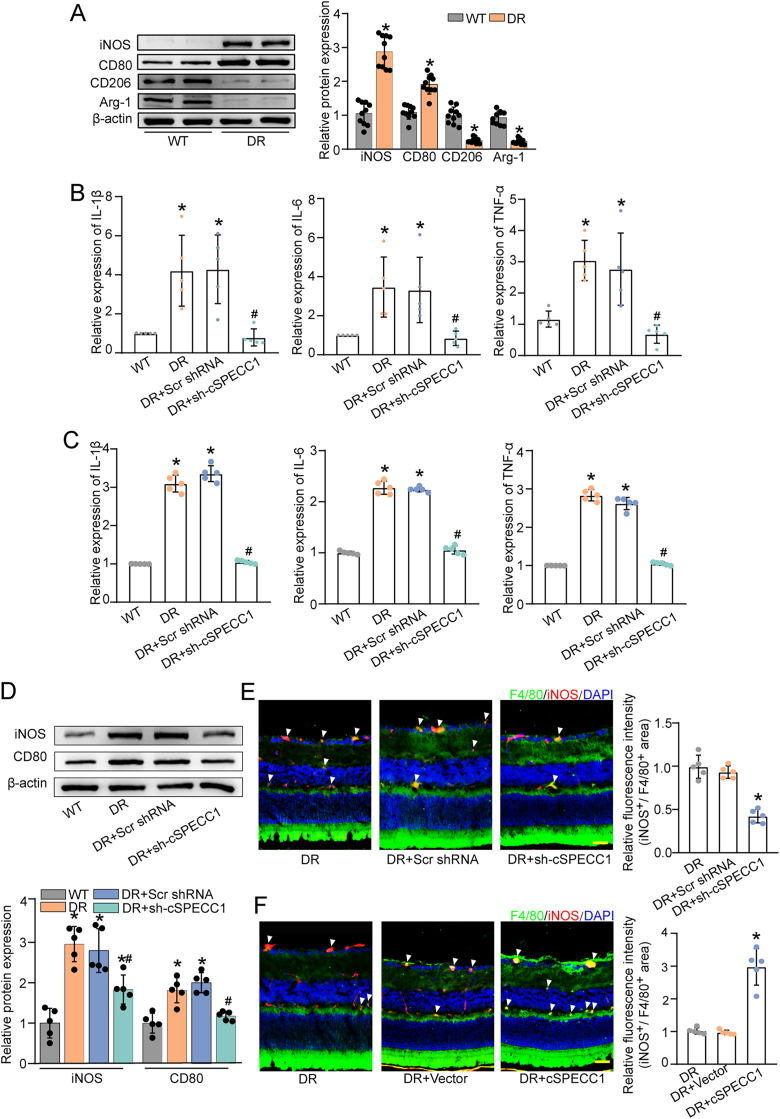
Macrophages play an important role in the development of vascular diseases, with their homeostasis closely linked to metabolic reprogramming. This study aims to explore the role of circular RNA-mediated epigenetic remodeling in maintaining macrophage homeostasis during diabetes-induced microvascular dysfunction. We identified a circular RNA, circRNA-sperm antigen with calponin homology and coiled-coil domains 1 (cSPECC1), which is significantly up-regulated in diabetic retinas and in macrophages under diabetic stress. cSPECC1 knockdown in macrophages attenuates M1 macrophage polarization and disrupts macrophage-endothelial crosstalk in vitro. cSPECC1 knockdown in macrophages mitigates diabetes-induced retinal inflammation and ameliorates retinal vascular dysfunction. Mechanistically, cSPECC1 regulates GPX2 expression by recruiting eIF4A3, enhancing GPX2 mRNA stability and altering arachidonic acid metabolism. The metabolic intermediate 12-HETE has emerged as a key mediator, regulating both macrophage homeostasis and the crosstalk between macrophages and endothelial cells. Exogenous 12-HETE supplementation interrupts the anti-angiogenic effects of cSPECC1 knockdown. Collectively, circSPECC1 emerges as a novel regulator of macrophage-mediated vascular integrity and inflammation. Targeting the metabolic reprogramming of macrophages presents a promising therapeutic strategy for mitigating diabetes-induced vascular dysfunction.

Keywords: Circular RNAs; Diabetic retinopathy; Macrophage homeostasis; Metabolic reprogramming; Vascular dysfunction.


Conflict of interest statement

Declaration of competing interest The authors declare that they have no known competing financial interests or personal relationships that could have appeared to influence the work reported in this paper.

Figures

Image 1
Graphical abstract
Fig. 1
Fig. 1
Identification of cSPECC1 as a high glucose-regulated circRNA in macrophages A, Sanger sequencing was conducted to detect cSPECC1 expression in macrophages. The result of Sanger sequencing (bottom) was consistent with the sequence of cSPECC1 reported in circBase (top). B, Total RNAs were digested with RNase R (3U/μg) at 37 °C for 30 min followed by qRT-PCR assay of cSPECC1 expression. SPECC1 mRNA was detected as the RNase R-sensitive control (n = 5, Student t-test). ∗P < 0.05 versus Mock group. C, qRT-PCR assays were conducted to detect the amount of cSPECC1 and SPECC1 mRNA in THP-1-derived macrophages following treatment with Actinomycin D (5 μM, n = 5, repeated-measures ANOVA with Bonferroni test). D, RNA-FISH assays conducted to detect the cellular distribution of cSPECC1 in THP-1-derived macrophages. Nuclei were stained with DAPI. Scale bar, 20 μm. 18S rRNA and U6 was detected as the cytoplasmic and nucleus control (n = 4). E, THP-1-derived macrophages were incubated with normal glucose (NG, 5.55 mM), osmotic control (OS, 5.55 mM glucose plus 24.45 mM mannitol), or high glucose (HG, 30 mM) for 24 h qRT-PCR assays were conducted to detect cSPECC1 expression (n = 5, ∗P < 0.05 versus Ctrl group, One-way ANOVA with Bonferroni test). F, qRT-PCRs were conducted to detect cSPECC1 expression in HRMECs, pericytes, Müller cells, RPEs, and THP-1-derived macrophages without (Ctrl) or with high glucose (HG, 30 mM) for 24 h (n = 4, ∗P < 0.05 versus Ctrl group, Mann-Whitney U test). G, qRT-PCRs were conducted to detect cSPECC1 expression in STZ-induced diabetic retinas and non-diabetic controls (Ctrl) at 1-month, 3-month, or 6-month following diabetes induction (n = 5, ∗P < 0.05 versus Ctrl group, Student t-test).
Fig. 2
Fig. 2
cSPECC1 regulates macrophage homeostasis in vitro THP-1-derived macrophages were transfected with scrambled (Scr) siRNA or cSPECC1 siRNA (si-cSPECC1), or left untreated (Ctrl) for 12 h, and then exposed without or with high glucose (HG, 30 mM) for 24 h. The expression of M1-like macrophage marker (CD68+/CD80+) was detected by flow cytometry (A, n = 5). The cytokine expression of M1-like macrophage (IL-1β, IL-6, and TNF-α) was detected by qRT-PCR assays (B, n = 5). The cytokine expression of M1-like macrophage (IL-1β, IL-6, and TNF-α) was detected by ELISA assays (C, n = 5). The expression of M1-like macrophage markers (iNOS and CD80) was detected by Western blot. β-actin as the internal reference (D, n = 5). The expression of M1-like macrophage marker (F4/80+/iNOS+) was detected by immunofluorescent staining. Scale bar, 20 μm (E, n = 5). ∗P < 0.05 versus Ctrl group, #P < 0.05 HG group versus HG group + si-cSPECC1 group; One-way ANOVA with Bonferroni test.
Fig. 3
Fig. 3
cSPECC1 regulates macrophage-endothelial cell crosstalk in vitro A, A schematic diagram showing the experimental procedure of macrophage-endothelial cell co-culture. B-D, THP-1-derived macrophages were transfected with scrambled (Scr) siRNA or cSPECC1 siRNA (si-cSPECC1), or left untreated (Ctrl) and co-cultured with ECs in high glucose (HG, 30 mM) for 24 h. Cell proliferation was detected by EdU assays. Proliferating cells were calculated as the ratio of EdU-positive and DAPI-positive cells and are shown relative to the control. Scale bar, 20 μm (B, n = 5). Cell migration was detected by transwell assays. The number of migrated cells was estimated by ImageJ software using the auto-count function. Data are expressed as fold change with the controls. Scale bar, 20 μm (C, n = 5). Tube formation activity was detected by Matrigel assays. Scale bar, 100 μm (D, n = 5). ∗P < 0.05 versus Ctrl group; One-way ANOVA with Bonferroni test.
Fig. 4
Fig. 4
cSPECC1 regulates diabetes-induced macrophage homeostasis in vivo A, The retinas of diabetic mice (DR) and wild-type mice (WT) were collected. Western blots were conducted to detect the specific markers of different macrophage phenotypes in the retinas (n = 5). β-actin was detected as the internal control. ∗P < 0.05 versus WT group. B-E, Diabetic C57BL/6J mice received intravitreous injections of scrambled (Scr) shRNA (DR + Scr shRNA), cSPECC1 shRNA (DR + sh-cSPECC1), or left untreated (DR). Non-diabetic C57BL/6J mice (WT) were served as the controls. The expression levels of cytokines in M1-like macrophages (IL-1β, IL-6, and TNF-α) were detected by qRT-PCRs (B, n = 5) and ELISA assays (C, n = 5). The expression of M1-like macrophage markers (iNOS and CD80) was detected by western blots. β-actin was detected as the internal control (D, n = 5). ∗P < 0.05 versus WT group, #P < 0.05 DR + Scr shRNA group versus DR + cSPECC1 shRNA group; Kruskal-Wallis test followed by Bonferroni test. The expression of M1-like macrophage marker (F4/80+/iNOS+) was detected by immunofluorescent staining of retinal frozen sections. Scale bar, 50 μm; ∗P < 0.05 versus DR group; Kruskal-Wallis test followed by Bonferroni test (E, n = 5). Diabetic C57BL/6J mice received intravitreous injections of Scr vector (DR + Vector), cSPECC1 overexpression vector (DR + cSPECC1), or left untreated (DR). The expression of M1-like macrophage marker (F4/80+/iNOS+) was detected by immunofluorescent staining of retinal frozen sections. Scale bar, 50 μm (F, n = 5). ∗P < 0.05 versus DR group; Kruskal-Wallis test with Bonferroni test.
Fig. 5
Fig. 5
cSPECC1 regulates retinal vascular inflammation and vascular integrity in vivo A-C, Diabetic C57BL/6J mice received an intravitreous injection of scrambled (Scr) shRNA (DR + Scr shRNA), cSPECC1 shRNA (DR + sh-cSPECC1), or left untreated (DR). Non-diabetic C57BL/6J mice (WT) were taken as the control. The infiltration of leukocytes in retinal vessels was detected by fluorescein-isothiocyanate (FITC)-coupled concanavalin A (FITC-conA) lectin perfusion assays. Adherent leukocytes (red arrows) were stained with FITC-conA (20 μg/mL) and observed under a fluorescence microscope. Scale bar, 50 μm (A, n = 5). The mice were perfused with Evans blue dye (45 mg/kg) for 2 h. The fluorescence signal of flat-mounted retina was detected using a fluorescence microscope. A representative image is shown. Scale bar, 200 μm (B, n = 5). Retinal trypsin digestion was conducted to detect acellular capillaries. Acellular capillaries were quantified in 30 random fields per retina and averaged. Yellow arrows indicated acellular capillaries. Scale bar, 10 μm (C, n = 5). ∗P < 0.05 versus WT group, #P < 0.05 DR + Scr shRNA group versus DR + cSPECC1 shRNA group; Kruskal-Wallis test followed by Bonferroni test. D, Retinal vaso-obliteration (VO) and neovascularization of cSPECC1 knockdown mice and the matched control mice at P17 were shown by isolectin B4 (IB4) staining. Avascular area was highlighted by white staining. Pathological angiogenic area (at P17) was highlighted by yellow staining. Low panels showed the high magnification of neovascular tufts. Avascular area and angiogenic area were statistically analyzed. Scale bar, 200 μm (n = 5). ∗P < 0.05 versus OIR group; Kruskal-Wallis test with Bonferroni test.
Fig. 6
Fig. 6
Conditional knockdown of cSPECC1 in macrophages alleviates retinal vascular dysfunction in vivo A, The infiltration of leukocytes in retinal vessels was detected by FITC-coupled ConA perfusion in non-diabetic C57BL/6J Cre mice (Cre), diabetic Cre mice (Cre-DR) with or without intravitreous injection of Scr shRNA or cSPECC1 shRNA. Scale bar, 50 μm (n = 5). B, The mice were perfused with Evans blue dye (45 mg/kg) for 2 h. The fluorescence signal of flat-mounted retina was detected using a fluorescence microscope. A representative image was shown. Scale bar, 200 μm (n = 5). C, Retinal trypsin digestion was conducted to detect the number of acellular capillaries. Acellular capillaries were quantified in 30 random fields per retina and averaged. Yellow arrows indicated acellular capillaries (n = 5). Scale bar, 10 μm ∗P < 0.05 versus Cre group; #P < 0.05 Cre-DR + Scr shRNA group versus Cre-DR + sh-cSPECC1 group. D, Retinal vaso-obliteration (VO) and neovascularization was detected by isolectin B4 (IB4) staining. Avascular area was highlighted using white staining. Pathologic angiogenic area (at P17) was highlighted using yellow staining. Low panels showed high magnification of neovascular tufts. Avascular area and pathologic angiogenic area were statistically analyzed. Scale bar, 200 μm (n = 5). ∗P < 0.05 versus Cre group; #P < 0.05 Cre-DR + Scr shRNA group versus Cre-DR + sh-cSPECC1 group; Kruskal-Wallis test with Bonferroni test.
Fig. 7
Fig. 7
cSPECC1 regulates macrophage homeostasis through arachidonic acid pathway A, Screening for the potential genes affected by cSPECC1 knockdown (red spots, up-regulated genes; blue spots, down-regulated genes). B and C, KEGG pathway analysis was conducted to predict the signaling pathways associated with cSPECC1 knockdown. D, THP-1-derived macrophages were transfected without or with cSPECC1 siRNA for 12 h, and then exposed to normal glucose (NG, 5.55 mM) or high glucose (HG, 30 mM) for 24 h. The cells without cSPECC1 siRNA transfection in normal glucose (NG) was taken as the control group. The expression levels of GPX2 were detected by qRT-PCR assays (n = 5, ∗P < 0.05, Student t-test). E, RNA immunoprecipitation (RIP) was conducted using GPX2 antibody or IgG negative control. RIP-derived RNAs were measured by qRT-PCR assays and cSPECC1 level was expressed as a percentage of the input. ns, no significant (n = 4). F, The expression levels of arachidonic acid and 12-HETE were determined by metabolic analysis in high glucose-treated (30 mM) group (HG) and cSPECC1 siRNA-transfected group with high glucose (30 mM) treatment (HG + si-cSPECC1). ∗P < 0.05 versus HG group. G, The macrophages were transfected cSPECC1 siRNA or left untreated, and cultured in normal glucose (NG, 5.55 mM) or high glucose (HG, 30 mM) for 24 h. The levels of 12-LOX expression were detected by qRT-PCR assays (n = 5, ∗P < 0.05, Student t-test). H, THP-1-derived macrophages were treated as shown and then co-cultured with ECs for another 24 h. The proliferation ability of ECs was analyzed by EdU assays. Scale bar, 20 μm. The migration ability of ECs was analyzed by transwell assays. Scale bar, 20 μm. The tube formation ability of ECs was analyzed by matrigel assays. Scale bar, 100 μm (n = 5, ∗P < 0.05 versus Ctrl group, #P < 0.05 versus si-cSPECC1 group).
Fig. 8
Fig. 8
cSPECC1 regulates GPX2 expression by recruiting eIF4A3 to enhance GPX2 stability A, Following the treatment with PMA (100 ng/mL, 48 h) to differentiate to macrophages, cell lysates were incubated with biotin-labelled cSPECC1 probes (100 μM). Silver-stained sodium dodecyl sulfate polyacrylamide gel of the proteins immunoprecipitated by cSPECC1 and its antisense sequence. eIF4A3 expression was detected by western blots (n = 4, ∗P < 0.05, Mann-Whitney U test). B, Schematic representation of screening for cSPECC1-binding targets. eIF4A3 belonged to the union set of CircInteractome predictive RNAs and pull-down RNAs. C, Total cellular fractions were isolated from macrophages and immunoprecipitated using eIF4A3 or IgG antibody. The amount of cSPECC1 in the immunoprecipitate was detected by qRT-PCR assays (n = 4, ∗P < 0.05, Mann-Whitney U test). D, Immunofluorescence staining and FISH assays were conducted to detect the co-localization between cSPECC1 and eIF4A3 in macrophages. Scale bar, 20 μm (n = 4). E, Immunostaining assays were conducted to detect the localization of eIF4A3 protein transfected with cSPECC1 siRNA or Scr siRNA following high glucose stress (HG, 30 mM) for 24 h. Scale bar, 20 μm (n = 4). F, The macrophages were transfected with scramble (Scr) siRNA or cSPECC1 siRNA for 24 h. Cytoplasmic and nucleus levels of eIF4A3 expression were detected by western blots. β-actin was detected as the cytoplasmic control. PCNA was detected as the nucleus control (n = 4). G, eIF4A3 expression was detected by western blots in macrophages transfected with Scr siRNA or cSPECC1 siRNA for 24 h (n = 4). H, Left: Identification of the proteins pulled down by GPX2 probe (100 μM) in the protein extracts of macrophages. The arrow indicates the band containing eIF4A3. Right: Immunoblot analysis of eIF4A3 expression following pull-down assays by GPX2 probe (n = 5, ∗P < 0.05 versus GPX2 anti-sense group). I, RIP assays were conducted to verify the interaction between GPX2 and eIF4A3 (n = 4, ∗P < 0.05 versus IgG group, Mann-Whitney U test). J, THP-1-derived macrophages were transfected with scramble (Scr) siRNA or eIF4A3 siRNA for 12 h, and then exposed to normal glucose (Ctrl, 5.55 mM) or high glucose (HG, 30 mM) for 24 h qRT-PCR assays were conducted to detect the relative levels of GPX2 (n = 5, Student t-test). K, The stability of GPX2 mRNA in macrophages transfected with eIF4A3 siRNA or left untreated (Ctrl) was detected by qRT-PCRs after the administration of Actinomycin D (5 μM, n = 5, repeated-measures ANOVA with Bonferroni test, ∗P < 0.05 versus Ctrl group). L, THP-1-derived macrophages were treated as shown and GPX2 mRNA stability was detected by qRT-PCRs following Actinomycin D treatment at the indicated time points (0 h, 6 h, 12 h and 18 h, n = 5, Repeated-measures ANOVA with Bonferroni test, ∗P < 0.05 si-cSPECC1+eIF4A3 group versus si-cSPECC1 group).

References

    1. Li X., Sun X., Carmeliet P. Hallmarks of endothelial cell metabolism in health and disease. Cell Metabol. 2019;30(3):414–433. - PubMed
    1. Annex B.H., Cooke J.P. New directions in therapeutic angiogenesis and arteriogenesis in peripheral arterial disease. Circ. Res. 2021;128(12):1944–1957. - PMC - PubMed
    1. Koenen M., et al. Obesity, adipose tissue and vascular dysfunction. Circ. Res. 2021;128(7):951–968. - PMC - PubMed
    1. Dumas S.J., et al. Phenotypic diversity and metabolic specialization of renal endothelial cells. Nat. Rev. Nephrol. 2021;17(7):441–464. - PMC - PubMed
    1. Antonetti D.A., Silva P.S., Stitt A.W. Current understanding of the molecular and cellular pathology of diabetic retinopathy. Nat. Rev. Endocrinol. 2021;17(4):195–206. - PMC - PubMed

Publication types

LinkOut - more resources