. 2025 Feb:92:102080.
doi: 10.1016/j.molmet.2024.102080. Epub 2024 Dec 9.

TMEM135 deficiency improves hepatic steatosis by suppressing CD36 in a SIRT1-dependent manner

Affiliations

TMEM135 deficiency improves hepatic steatosis by suppressing CD36 in a SIRT1-dependent manner

Arun Chhetri et al. Mol Metab. 2025 Feb.

Abstract

Objectives: Dysregulation of lipid homeostasis pathway causes many liver diseases, including hepatic steatosis. One of the primary factors contributing to lipid accumulation is fatty acid uptake by the liver. Transmembrane protein 135 (TMEM135), which exists in mitochondria and peroxisomes, participates in intracellular lipid metabolism. This study aims to investigate the role of TMEM135 on regulating cellular lipid import in the liver.

Methods: We used in vivo, ex vivo, and in vitro models of steatosis. TMEM135 knockout (TMEM135KO) and wild type (WT) mice were fed a high-fat diet (HFD) to induce hepatic steatosis. Primary mouse hepatocytes and AML12 cells were treated with free fatty acid (FFA). Additionally, TMEM135-deficient stable cells and overexpressed cells were established using AML12 cells.

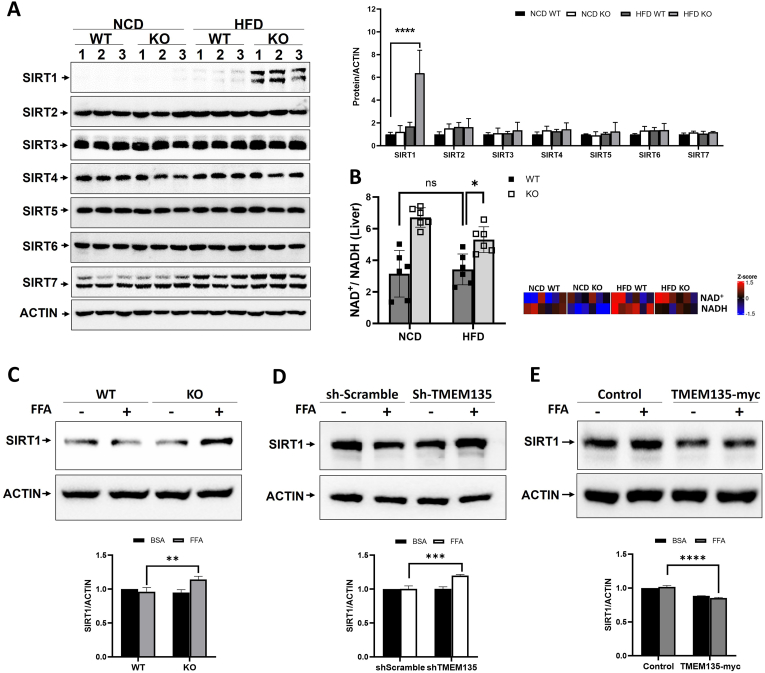
Results: TMEM135 deficiency mitigated lipid accumulation in the liver of HFD-fed TMEM135KO mice. TMEM135-depleted primary hepatocytes and AML12 cells exhibited less lipid accumulation when treated with FFA compared to control cells, as shown as lipid droplets. Consistently, the effect of TMEM135 depletion on lipid accumulation was completely reversed under TMEM135 overexpression conditions. CD36 expression was markedly induced by HFD or FFA, which was reduced by TMEM135 depletion. Among the SIRT family proteins, only SIRT1 expression definitely increased in the liver of HFD-fed TMEM135KO mice along with a significant increase in NAD+/NADH ratio. However, inhibition of SIRT1 in TMEM135-depleted cells using siSIRT1 or the SIRT1 inhibitor EX-527 resulted in an increase of CD36 expression and consequent TG levels.

Conclusions: TMEM135 depletion attenuates CD36 expression in a SIRT1-dependent manner, thereby reducing cellular lipid uptake and hepatic steatosis.

Keywords: CD36; Lipid accumulation; SIRT1; TMEM135.


Conflict of interest statement

Declaration of competing interest The authors who have taken part in this study declared that they do not have anything to disclose regarding funding or conflict of interest with respect to this manuscript.

Figures

Image 1
Graphical abstract
Figure 1
Figure 1
Depletion of TMEM135 decreases lipid accumulation in the liver of HFD mice and FFA-treated primary hepatocytes and AML12 cells. (A–C) WT and TMEM135KO mice were fed either NCD or HFD for 22 weeks (n = 6 per group). (A) Oil Red O staining of liver tissue section (Original magnification x100). (B) Immunoblots and densitometry for PLIN2, FSP27, and β-actin from the liver tissue of mice. Data represent mean ± SD, ∗∗p < 0.01, ∗p < 0.05, Two-way ANOVA. (C) Hepatic TG levels. Data represent mean ± SD, ∗∗p < 0.01, Two-way ANOVA. (D–F) Primary hepatocytes were isolated from the livers of WT and TMEM135KO mice and treated with FFA for 12 h. (D) Oil Red O staining and quantification of LD area (Original magnification x40, scale bar 20 μm). More than 100 cells per group in each experiment were measured. Data represent mean ± SD, ∗∗∗∗p < 0.0001, Two-way ANOVA. (E) Immunoblots and densitometry for PLIN2 and β-actin. Data represent mean ± SD, ∗∗∗∗p < 0.0001, ∗∗∗p < 0.001, Two-way ANOVA. (F) Quantification of TG levels. Data represent mean ± SD, ∗∗∗∗p < 0.0001, Two-way ANOVA. (G–I) sh-Scramble and sh-TMEM135 cells were treated with FFA for 12 h. (G) Oil Red O staining and quantification of LD area (Original magnification x100, scale bar 20 μm). More than 100 cells per group in each experiment were measured. Data represent mean ± SD, ∗∗∗∗p < 0.0001, ∗∗p < 0.01, Two-way ANOVA. (H) Immunoblots and densitometry for PLIN2 and β-actin. Data represent mean ± SD, ∗∗∗∗p < 0.0001, Two-way ANOVA. (I) Quantification of TG levels. Data represent mean ± SD, ∗∗∗∗p < 0.0001, ∗∗p < 0.01, Two-way ANOVA.
Figure 2
Figure 2
TMEM135 overexpression exacerbates lipid accumulation in FFA-treated AML12 cells. (A–D) AML12 cells overexpressed for TMEM135 were treated with FFA for 12 h (n = 6 per group). (A) Immunoblots and densitometry for PLIN2 and β-actin. Data represent mean ± SD, ∗∗∗∗p < 0.0001, Two-way ANOVA. (B) Quantification of TG levels. Data represent mean ± SD, ∗∗∗∗p < 0.0001, Two-way ANOVA. (C) Immunofluorescence staining for PLIN2 (Original magnification x100, scale bar 20 μm). (D) Quantification of fluorescence intensity of PLIN2. Data represent mean ± SD, ∗∗∗∗p < 0.0001, ∗∗∗p < 0.001, Two-way ANOVA.
Figure 3
Figure 3
Depletion of TMEM135 decreases CD36 expression in the liver of HFD mice and FFA-treated primary hepatocytes and AML12 cells. (A–B) Mice were fed either NCD or HFD for 22 weeks (n = 6 per group). (A) Immunostaining for CD36 and quantification (Original magnification 100×, scale bar 20 μm). Data represent mean ± SD, ∗∗∗∗p < 0.0001, Two-way ANOVA. (B) Immunoblots and densitometry for CD36, PPAR-γ and β-actin. Data represent mean ± SD, ∗∗∗∗p < 0.0001, ∗∗p < 0.01, Two-way ANOVA (C) Immunoblots and densitometry for CD36 and β-actin in the primary hepatocytes treated with FFA for 12 h. Data represent mean ± SD, ∗∗∗∗p < 0.0001, Two-way ANOVA. (D) Immunoblots and densitometry for CD36 and β-actin in sh-Scramble and sh-TMEM135 cells treated with FFA for 12 h. Data represent mean ± SD, ∗∗∗∗p < 0.0001, Two-way ANOVA (E) Immunoblots and densitometry for CD36 and β-actin in TMEM135 overexpressed cells treated with FFA for 12 h. Data represent mean ± SD, ∗∗p < 0.01, ∗p < 0.05, Two-way ANOVA. (F) Immunofluorescence staining and quantification for BODIPY-Palmitate in si-Control and si-TMEM135 cells (Original magnification x100, scale bar 20 μm). Data represent mean ± SD, ∗∗∗∗p < 0.0001, Two-way ANOVA.
Figure 4
Figure 4
Depletion of TMEM135 increases SIRT1 expression and NAD+/NADH ratio in the liver of HFD mice, and FFA-treated primary hepatocytes and AML12 cells. (A–B) WT and TMEM135KO mice were fed either NCD or HFD for 22 weeks (n = 6 per group). (A) Immunoblots and densitometry for SIRT family proteins and β-actin. Data represent mean ± SD, ∗∗∗∗p < 0.0001, Two-way ANOVA. (B) Quantification of NAD+/NADH ratio, and heatmap showing NAD+ and NADH levels from metabolomics. Data represent mean ± SD, ∗p < 0.05, Two-way ANOVA. (C) Immunoblot and densitometry for SIRT1 and β-actin in the primary hepatocytes from WT and KO treated with FFA for 12 h. Data represent mean ± SD, ∗∗p < 0.01, Two-way ANOVA. (D) Immunoblot and densitometry for SIRT1 and β-actin in sh-Scramble and sh-TMEM135 cells treated with FFA for 12 h. Data represent mean ± SD, ∗∗∗p < 0.001, Two-way ANOVA. (E) Immunoblot and densitometry for SIRT1 and β-actin in TMEM135 overexpressed AML12 cells treated with FFA for 12 h. Data represent mean ± SD, ∗∗∗∗p < 0.0001, Two-way ANOVA.
Figure 5
Figure 5
Inhibition of SIRT1 increases lipid import and accumulation through CD36 upregulation in TMEM135-depleted AML12 cells. (A–C) sh-Scramble and sh-TMEM135 cells were transfected with siSIRT1 and then treated with FFA for 12 h (n = 6 per group). (A) Immunoblots and densitometry for SIRT1, CD36, PLIN2 and β-actin. Data represent mean ± SD, ∗∗∗∗p < 0.0001, Two-way ANOVA. (B) Quantification of TG levels. Data represent mean ± SD, ∗∗∗∗p < 0.0001, ∗∗p < 0.01, Two-way ANOVA. (C) Quantification of SIRT1 activity. Data represent mean ± SD, ∗∗∗∗p < 0.0001, ∗p < 0.05, Two-way ANOVA. (D–E) sh-Scramble and sh-TMEM135 cells were treated with EX-527 in present or absent of FFA treatment. (D) Immunoblot and densitometry for SIRT1, CD36, PLIN2 and β-actin. Data represent mean ± SD, ∗∗∗∗p < 0.0001, ∗∗p < 0.01, Two-way ANOVA. (E) Quantification of TG levels. Data represent mean ± SD, ∗∗∗∗p < 0.0001, ∗∗p < 0.01, Two-way ANOVA. (F) Proposed mechanism that represents TMEM135 depletion decreases fatty acid import and accumulation in the liver.

References

    1. Landowski M., Bhute V.J., Grindel S., Haugstad Z., Gyening Y.K., Tytanic M., et al. Transmembrane protein 135 regulates lipid homeostasis through its role in peroxisomal DHA metabolism. Commun Biol. 2023;6(1):8. - PMC - PubMed
    1. Exil V.J., Silva Avila D., Benedetto A., Exil E.A., Adams M.R., Au C., et al. Stressed-induced TMEM135 protein is part of a conserved genetic network involved in fat storage and longevity regulation in Caenorhabditis elegans. PLoS One. 2010;5(12) - PMC - PubMed
    1. Maharjan Y., Lee J.N., Kwak S.A., Dutta R.K., Park C., Choe S.K., et al. TMEM135 regulates primary ciliogenesis through modulation of intracellular cholesterol distribution. EMBO Rep. 2020;21(5) - PMC - PubMed
    1. Lee W.H., Higuchi H., Ikeda S., Macke E.L., Takimoto T., Pattnaik B.R., et al. Mouse Tmem135 mutation reveals a mechanism involving mitochondrial dynamics that leads to age-dependent retinal pathologies. Elife. 2016;5 - PMC - PubMed
    1. Landowski M., Bhute V.J., Takimoto T., Grindel S., Shahi P.K., Pattnaik B.R., et al. A mutation in transmembrane protein 135 impairs lipid metabolism in mouse eyecups. Sci Rep. 2022;12(1):756. - PMC - PubMed

LinkOut - more resources