. 2024 Dec 9;10(1):121.
doi: 10.1038/s41421-024-00749-x.

Packaged release and targeted delivery of cytokines by migrasomes in circulation

Affiliations

Packaged release and targeted delivery of cytokines by migrasomes in circulation

Haifeng Jiao et al. Cell Discov. .

Abstract

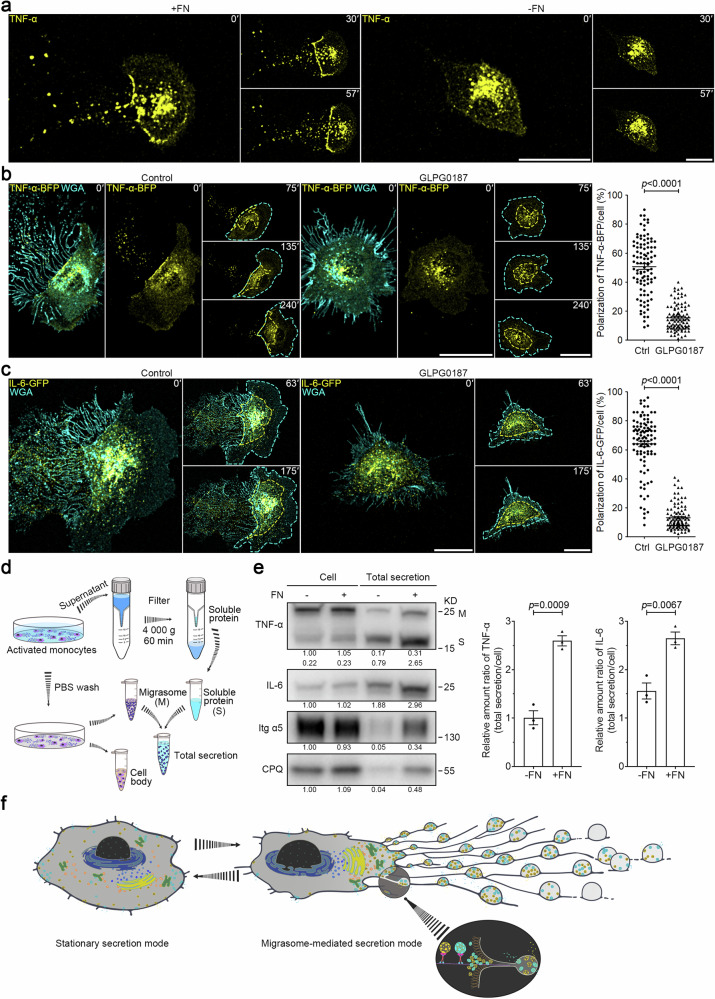
In dynamic systems like the circulatory system, establishing localized cytokine gradients is challenging. Upon lipopolysaccharide (LPS) stimulation, we observed that monocytes release numerous migrasomes enriched with inflammatory cytokines, such as TNF-α and IL-6. These cytokines are transported into migrasomes via secretory carriers, leading to their immediate exocytosis or eventual release from detached migrasomes. We successfully isolated TNF-α and IL-6-enriched, monocyte-derived migrasomes from the blood of LPS-treated mice. Total secretion analysis revealed a substantial amount of TNF-α and IL-6 released in a migrasome-packaged form. Thus, detached, monocyte-derived migrasomes represent a type of extracellular vesicle highly enriched with cytokines. Physiologically, these cytokine-laden migrasomes rapidly accumulate at local sites of inflammation, effectively creating a concentrated source of cytokines. Our research uncovers novel mechanisms for cytokine release and delivery, providing new insights into immune response modulation.


Conflict of interest statement

Conflict of interest: The authors declare no competing interests.

Figures

Fig. 1
Fig. 1. Monocytes release cytokine-containing extracellular particles in vivo, and migrasomes are the major sites of secretion in migrating cells in vitro.
a Intravital imaging of mouse circulating monocytes and monocyte-derived extracellular particles. LPS (12 mg/kg) was injected into mice by intraperitoneal (i.p.) injection. After 2 h, CCR2-PE antibody and WGA-AF647 were injected into mice by intravenous (i.v.) injection. Intravital imaging of the mouse liver was performed to monitor blood monocytes and monocyte-derived extracellular particles. Time-lapse images were acquired at intervals of 90 s. Scale bar, 10 µm. Monocytes and monocyte-derived extracellular particles are detected with CCR2-PE antibody. WGA-F647 labels blood vessels and white arrowheads indicate free CCR2-positive particles detached from retraction fibers. b Intravital imaging of monocytes in mouse liver after LPS stimulation as shown in a. Time interval, 120 s. Scale bar, 10 μm. Monocytes and monocyte-derived extracellular particles are labeled with CCR2-PE antibody; membrane-bound TNF-α is detected with TNF-α-AF647 antibody; blood vessels are labeled with WGA-AF488. c Schematic illustration of the procedure for purifying monocyte-derived extracellular particles from mouse blood samples. d Representative scanning electron microscopy images of migrasomes isolated from blood monocytes as shown in c. Scale bar, 2 µm. e, f Immunofluorescence z-stack images of migrasomes purified from blood monocytes. Migrasomes were immunostained with antibodies against TNF-α (e) or IL-6 (f). Left, z-stack images were acquired by confocal microscopy. Scale bars, 10 µm. Middle and right, 3D reconstructions of enlarged migrasomes. Scale bars, 2 µm. g, h Immunofluorescence z-stack images of LPS-stimulated monocytes. Mouse monocytes were cultured in FN-precoated confocal dishes in the presence of 500 ng/mL LPS combined with or without 10 μM BAPTA-AM for 12 h. Cells were then immunostained with antibodies against TNF-α (g) or IL-6 (h) before visualization. Z-stack images were acquired by confocal microscopy, and 3D reconstructions were performed with NIS-Elements. Scale bars, 10 μm. The lower panels show statistical analysis of relative fluorescence intensities of control cell bodies (C-C), control migrasomes (C-M), BAPTA-AM-treated cell bodies (B-C), and BAPTA-AM-treated migrasomes (B-M). Data are means ± SEM. n > 100 cells from three independent experiments. ANOVA and post-hoc tests were used for statistical analyses. Fluorescence intensity ratio of BAPTA-AM vs control groups in cell bodies (C) or in migrasomes (M) was quantified. Fluorescence intensity ratio of migrasome vs cell body was quantified. Control (C), BAPTA-AM (B). Data are means ± SEM. Two-tailed unpaired t-test was used for statistical analyses.
Fig. 2
Fig. 2. Cell migration causes the polarization of secretory carriers to the rear of the cell and drives a shift to the highly efficient, migrasome-mediated secretion mode.
a THP-1 cells were activated in the presence of 100 ng/mL PMA for 24 h and were then plated in control or FN-precoated dishes. After TNF-α fluorescent antibody and WGA staining, time-lapse imaging was conducted. Time interval, 180 s. Scale bars, 10 μm. b, c L929 cells stably expressing TNF-α-BFP (b) or IL-6-GFP (c), treated with or without 10 μM GLPG0187, were subjected to time-lapse imaging. Time-lapse images were acquired at intervals of 15 min (b) or 7 min (c). Scale bars, 20 μm. Cyan dashed lines outline the cell body. Yellow dashed lines outline TNF-α-BFP vesicles (b) or IL-6-GFP vesicles (c), respectively. Polarization of TNF-α-BFP (b) or IL-6-GFP (c) was quantified and shown as the means ± SEM for triplicate samples of more than 50 cells. Two-tailed unpaired t-test was used for statistical analyses (right panel). d Schematic illustration of the procedure for acquiring total cellular secretion from in vitro cultured monocytes. e Equal numbers of mouse monocytes were seeded on control or FN-precoated dishes in the presence of 500 ng/mL LPS for 16 h. Soluble proteins in the medium were isolated using ultrafiltration, and migrasomes were purified respectively from the identical cell culture dish, as shown in d. Total secretion mixtures of soluble proteins and migrasomes were normalized with the numbers of cells and were then subjected to western blot analysis using the indicated antibodies. Integrin α5 (Itg α5) and CPQ are used as migrasome markers in monocytes. Both membrane-bound (M) and soluble (S) forms of TNF-α were detected by western blot analysis. Representative densitometry analysis of western blot gray values was shown. Three independent experiments were conducted. The ratio of TNF-α or IL-6 in total secretion vs cell body was quantified. Quantification is shown as the means ± SEM from three independent experiments. Two-tailed unpaired t-test was used for statistical analyses (right panel). f Model for migrating cells switching from the stationary secretion mode to the highly efficient, migrasome-mediated secretion mode.
Fig. 3
Fig. 3. Monocytes produce fewer migrasomes in Tspan9–/– mice, and T9 KO results in a marked reduction of total cytokine levels in the blood.
a Total secretion (TS) analysis of TNF-α and IL-6 in the indicated monocytes as shown in Fig. 2d and e. Representative densitometry analysis of western blot gray values was shown. Three independent experiments were conducted. The ratio of TNF-α or IL-6 in total secretion vs cell body was quantified. Quantification is shown as the means ± SEM from three independent experiments. Two-tailed unpaired t-test was used for statistical analyses (right panel). b Equal numbers of WT and T9 KO monocytes were labeled with anti-CCR2 antibodies conjugated to different colored tags. The color-coded cells were mixed for injection into WT mice, and intravital imaging of the mouse liver was performed. Blood vessels are labeled with WGA-AF488. Time interval, 18 s. Scale bar, 20 μm. The right panel shows statistical analysis of the number of migrasomes per cell. Data are means ± SEM of more than 100 cells from three independent experiments. Two-tailed unpaired t-test was used to compare the datasets. c Diluted whole blood collected from mice with LPS stimulation was stained with CCR2-PE antibody and CD9-APC antibody for 30 min. Imaging flow cytometry analysis was performed to measure the number of monocyte migrasomes (CCR2-positive) and platelets (CD9-positive) in the blood from WT and T9 KO mice. Scale bars, 5 μm. Quantification of monocyte-derived migrasomes and platelets is shown as the means ± SEM. n = 20 mice from three independent experiments. Two-tailed unpaired t-test was used for statistical analyses (right panels). d Imaging analysis of CCR2-positive vesicles isolated from WT and T9 KO mouse blood samples. Scale bar, 10 μm. Quantification of monocyte-derived migrasomes is shown as the means ± SEM. n > 50 fields of view from 12 mice. Two-tailed unpaired t-test was used for statistical analyses (right panel). e After LPS stimulation, monocytes, monocyte-derived migrasomes, and small EVs were purified from mouse blood samples and then subjected to western blot analysis using the indicated antibodies. Lysates of monocyte cell bodies (C), monocyte-derived migrasomes (M), and small EVs (1#, 120,000× g and 2#, 160,000× g) were normalized to equal total protein loading for western blot analysis using the indicated antibodies. CD63, CD81, and Alix are used as exosome markers; Arf6 and Kif23 are used as microvesicle markers; CD9 is used as a platelet or platelet-derived EV marker. Representative densitometry analysis of western blot gray values was shown. Three independent experiments were conducted. f Monocyte-derived migrasomes from the indicated mice with LPS treatment were isolated from equal volumes of blood, respectively, and then analyzed by western blot analysis using the indicated antibodies. CPQ and Itg α5 are used as migrasome markers in circulating monocytes. Representative densitometry analysis of western blot gray values was shown. Three independent experiments were conducted. g Schematic illustration of the procedure for acquiring circulating monocyte-derived migrasomes (M), soluble proteins (S), and total secretion mixtures (TS) from mouse blood samples. h LPS (12 mg/kg) was injected into mice by i.p. injection. After 2 h, monocyte-derived migrasomes, and soluble proteins were isolated from equal volumes of the indicated mouse blood as shown in g. Migrasomes (M), soluble proteins (S), and total secretion mixtures (TS) were normalized with the volumes of mouse blood and subjected to western blot analysis using the indicated antibodies. Itg α5 and CPQ are used as migrasome markers in circulating monocytes. Both membrane-bound (M) and soluble (S) forms of TNF-α were detected by western blot analysis. Representative densitometry analysis of western blot gray values was shown. Three independent experiments were conducted.
Fig. 4
Fig. 4. Local inflammation triggers the rapid accumulation of circulating monocyte-derived migrasomes at the site of inflammation.
a Mice were injected with CCR2-labeled migrasomes purified from mouse monocytes by i.v. injection After 30 min, mice were anesthetized with avertin (i.p., 375 mg/kg). LPS (500 ng/mL) combined with WGA were then injected into mouse liver using a syringe. Intravital imaging of the mouse liver was immediately performed to monitor CCR2-positive migrasomes. WGA labels localized injection sites and blood vessels. Scale bar, 20 μm. The right panel shows a statistical analysis of the relative fluorescence intensity of CCR2 at injection sites. Data are means ± SEM. n = 8 mice from three independent experiments. Two-tailed unpaired t-test was used for statistical analyses. b LPS (12 mg/kg) was injected into mice by i.p. injection. After 2 h, fluorescent antibodies against TNF-α and CCR2 were injected into mice by i.v. injection. After localized injection of LPS (500 ng/mL) and WGA, intravital imaging of the mouse liver was immediately performed to monitor CCR2-positive migrasomes. Scale bar, 20 μm. The right panel shows a statistical analysis of the relative fluorescence intensity of TNF-α at injection sites. Data are means ± SEM. n = 10 mice from three independent experiments. Two-tailed unpaired t-test was used for statistical analyses. c Intravital imaging of monocyte-derived migrasomes in WT and T9 KO mice liver after LPS stimulation as shown in b. Scale bar, 20 μm. The right panel shows a statistical analysis of the relative fluorescence intensity of TNF-α at injection sites. Data are means ± SEM. n = 10 mice from three independent experiments. Two-tailed unpaired t-test was used for statistical analyses. d Model for the role of monocyte-derived migrasomes in packaged release and targeted delivery of signaling ligands to the site of inflammation.

References

    1. Kishimoto, T., Akira, S. & Taga, T. Interleukin-6 and its receptor: a paradigm for cytokines. Science258, 593–597 (1992). - PubMed
    1. Ramel, M. C. & Hill, C. S. Spatial regulation of BMP activity. FEBS Lett.586, 1929–1941 (2012). - PubMed
    1. Wartlick, O., Kicheva, A. & Gonzalez-Gaitan, M. Morphogen gradient formation. Cold Spring Harb. Perspect. Biol.1, a001255 (2009). - PMC - PubMed
    1. Kicheva, A., Bollenbach, T., Wartlick, O., Julicher, F. & Gonzalez-Gaitan, M. Investigating the principles of morphogen gradient formation: from tissues to cells. Curr. Opin. Genet. Dev.22, 527–532 (2012). - PubMed
    1. Lander, A. D., Nie, Q. & Wan, F. Y. Spatially distributed morphogen production and morphogen gradient formation. Math. Biosci. Eng.2, 239–262 (2005). - PubMed

LinkOut - more resources