. 2025 Mar;46(5):e2400755.
doi: 10.1002/marc.202400755. Epub 2024 Dec 8.

Spatiotemporal Retention of Structural Color and Induced Stiffening in Crosslinked Hydroxypropyl Cellulose Beads

Affiliations

Spatiotemporal Retention of Structural Color and Induced Stiffening in Crosslinked Hydroxypropyl Cellulose Beads

Piangtawan Phoungtawee et al. Macromol Rapid Commun. 2025 Mar.

Abstract

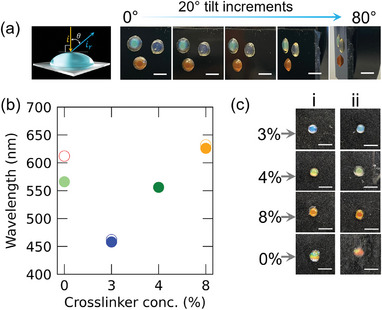
Hydroxypropyl cellulose (HPC) is known for its ability to form cholesteric liquid crystalline phases displaying vivid structural colors. However, these vibrant colors tend to fade over time when the material dries. This issue is a major bottleneck to finding practical applications for these materials. Here this problem is overcome by producing free-standing, millimeter-sized HPC structurally colored beads with spatiotemporal color retention, facilitated by a glutaraldehyde crosslinker. By leveraging the well-known chemically induced stabilization of cholesteric liquid crystalline phases, stable structural colors are achieved for at least three weeks. The presence of glutaraldehyde significantly increases the mechanical stiffness, with Young's modulus rising from 0.3± 0.1 GPa to 1.8± 0.2 GPa. This integrated approach of creating free-standing photonic HPC beads offers a strategy for developing robust and durable photonic HPC materials with enhanced stability, advancing photonic material applications with spatiotemporal color stability.

Keywords: Young's modulus; chiral nematic; crosslinker; hydroxypropyl cellulose; self‐assembly; structural colors.


Conflict of interest statement

The authors declare no conflict of interest.

Figures

Figure 1
Figure 1
a) Simplified schematics illustrating the effects of GA concentration on HPC. From left to right, the diagram depicts the progression from low to high GA crosslinking concentration. The arrows indicate the corresponding changes in material properties: color tunability, solvent evaporation rate, and stiffness. b) cross‐linking mechanism.
Figure 2
Figure 2
a) Schematic illustration of the preparation of SCBs, including self‐assembly and drying, using hexadecane to slow down evaporation. b) Digital photographs of millimeter‐sized blue, green, and red SCBs, with multiple samples demonstrating process consistency. The scale bars in (b) are 4 mm. c) Schematic illustration shows the interaction of light with the photonic HPC bead. The bead's selective reflection in the visible spectrum generates a green structural color, which is determined by the chiral pitch of the SCBs. d) Reflectance spectra of HPC beads showing reflectance peaks, corresponding to blue, green, and orange colors, respectively. e) Peak maxima wavelength as a function of GA concentration, demonstrating a redshift with increasing concentrations. Data represent the mean values from three measured spectra for each sample, as shown in b) and Figure S3 (Supporting Information).
Figure 3
Figure 3
Cross–sectional SEM micrographs of blue, green, and orange SCBs at 25 °C, 40% RH, and imaged at a) shell of the bead b) core of bead (low magnification), and c) core of bead (high magnification). Inset shows cartoons to illustrate the change in cholesteric pitch with increasing the GA concentration. The scale bar represents 10 µm in panel (a) and 1 µm in panels (b) and (c).
Figure 4
Figure 4
a) Digital photographs of SCBs and nc‐SCBs with varying crosslinker concentrations (0%, 3%, 4%, and 8%) over different time periods (1, 2, 3, and 8 weeks), demonstrating color stability. b) Raw reflectance spectra of SCBs beads with 4% GA concentration over different time periods (1, 2, 3, and 8 weeks), showing stable reflectance peaks. Raw spectral data (light lines) with smoothed data (bold lines) for visual clarity. Smoothing highlights trends without altering the underlying noise. c) Time evolution of reflectance peak maxima against time for different crosslinker concentrations, indicating stable peak positions with minor deviations over 8 weeks. d) Variation in Young's modulus as a function of varying crosslinker concentration in SCBs and nc‐SCBs. The inset shows typical force versus separation curves obtained from nanoindentation measurement.
Figure 5
Figure 5
Structural color stability and noniridescent colors. a) Non‐iridescence of SCBs: A schematic of the measurement setup is shown to the left, followed by photographs of SCBs at different rotation angles under ambient diffuse light, showing non‐iridescence. b) Plot of reflectance changes at λmax versus crosslinker concentration before (colored solid circles) and upon 5 min of water immersion (colored hollow circles) showing SC retained except without crosslinker SCBs. c) digital photographs showing SC optical comparison of SCBs before immersion (i) and after immersion (ii) showing only SCBs without crosslinker exhibiting a significant change in SC from green to reddish‐orange. The scale bar in (a) is 4 and 5 mm in (c).

References

    1. Arca H. C., Mosquera‐Giraldo L. I., Bi V., Xu D., Taylor L. S., Edgar K. J., Biomacromolecules 2018, 19, 2351. - PubMed
    1. Guo J.‐H., Skinner G. W., Harcum W. W., Barnum P. E., Pharmaceutical Science & Technology Today 1998, 1, 254.
    1. Martin‐Pastor M., Stoyanov E., J. Polym. Science 2021, 59, 1855.
    1. Park H. J., Chinnan M. S., J. Food Eng. 1995, 25, 497.
    1. Park H. J., Weller C. L., Vergano P. J., Testin R. F., J. Food Sci. 1993, 58, 1361.

LinkOut - more resources