[Preprint]. 2024 Nov 28:rs.3.rs-5489046.
doi: 10.21203/rs.3.rs-5489046/v1.

HUMAN ALVEOLAR MACROPHAGE FUNCTION IS IMPAIRED IN TUBERCULOSIS CONTACTS WITH DIABETES

Affiliations

HUMAN ALVEOLAR MACROPHAGE FUNCTION IS IMPAIRED IN TUBERCULOSIS CONTACTS WITH DIABETES

Léanie Kleynhans et al. Res Sq. .

Abstract

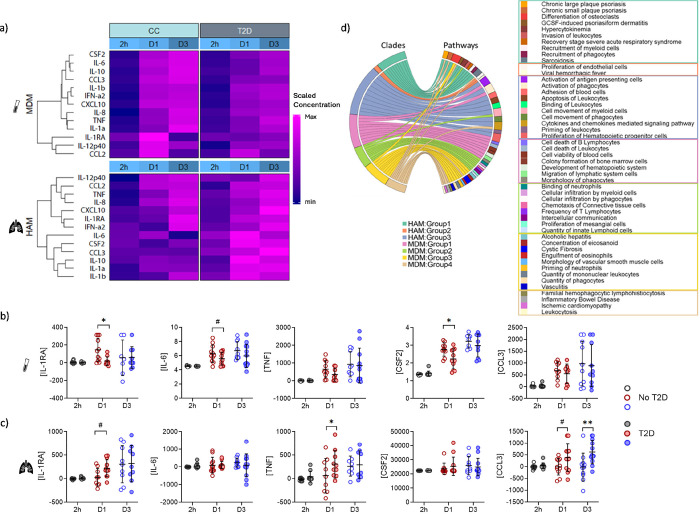
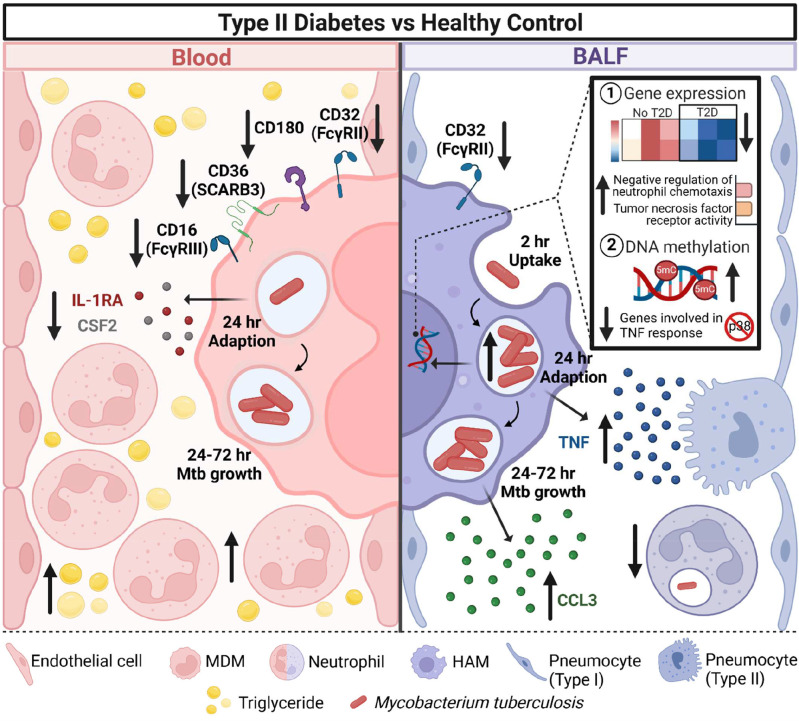
Type 2 diabetes (T2D) increases susceptibility to tuberculosis (TB) with the underlying mechanisms remaining unknown. To determine whether immune dysfunction in the lung contributes to TB susceptibility, we obtained paired human alveolar macrophages (HAMs) and monocyte-derived macrophages (MDMs) from TB-exposed individuals with/without T2D. Upon infection with Mycobacterium tuberculosis (M.tb), T2D-HAMs had more M.tb growth and produced more TNF. There were fewer neutrophils in the bronchoalveolar lavage of T2D patients which was inversely correlated with M.tb growth. Both T2D-HAMs and MDMs expressed less CD32, with T2D patients having fewer M1-like MDMs. T2D-MDMs produced less IL-1RA and CSF2. Overall M.tb-induced gene expression was delayed in T2D-HAMs, but genes involved in negative regulation of neutrophil migration were upregulated. T2D-HAM DNA was hypermethylated compared to control HAMs, however genes linked to TNF signalling were hypomethylated. We show here the first in-depth analysis of T2D-HAMs providing an explanation for more severe TB in T2D patients.

Keywords: alveolar macrophages; bronchoalveolar lavage; monocyte derived macrophages; mycobacterial growth; tuberculosis; type 2 diabetes.


Conflict of interest statement

CONFLICT OF INTEREST The authors declare no conflict of interest.

Figures

Figure 1.
Figure 1.
Graphical summary of the methodology employed to process samples collected from all study participants. 1) BAL cells were cryopreserved for CyTOF and DNA methylation analysis, while some were infected with M.tb on the day of collection. 2) In parallel, blood collected in NaHep tubes was used to isolate PBMCs. PBMCs were cultured in autologous plasma for 5 days in Teflon jars to allow monocytes to differentiate to MDMs. On day 5, MDMs were collected for flow cytometric analysis and for the MDM stimulation assay. HAMs and MDMs were allowed to adhere to the tissue culture plates for 2h. They were subsequently infected for 2h with M.tb H37Rv (MOI 1:1) for 2h and cultured for 1 and 3 days. Culture supernatants were collected for the Luminex analysis and cells collected for CFU determination, RNA sequencing and FACS (MDMs) or CyTOF (HAMs) analysis. Cell viability was determined using the CTAB method. This figure was created with BioRender.com.
Figure 2.
Figure 2.
Early interactions between M.tb and human alveolar macrophages are impacted by T2D status. Human alveolar macrophages (HAMs) and monocyte-derived macrophages (MDMs) from contacts of TB patients with and without T2D were infected in parallel with M.tb H37Rv (MOI 1:1) for 2h and subsequently cultured for 1 and 3 days. a) Number of bacilli, presented as log10 CFU/ml, associated with HAMs and MDMs after 2h. Bacterial load, presented as fold growth, in HAMS and MDMs cultured for b) 1 and c) 3 days. d) Neutrophil numbers measured in whole blood (absolute count) and BALF (percentage). e) Pictures of representative cytospins from BALF of contacts without T2D (left) and with T2D (right) taken at a 40x magnification. f) Correlation between neutrophil percentage in BALF and day 1 M.tb fold growth in HAMs. Data are presented as medians with interquartile ranges. CFU – colony forming units. *: p < 0.05
Figure 3.
Figure 3.
Frequencies of MDMs expressing CD36, CD32, CD16 and CD180 by T2D status. PBMCs were cultured in Teflon jars for 5 days to allow monocytes to differentiate into MDMs. After 5 days the PBMCs were stained for flow cytometric analysis. In addition, cryopreserved cells obtained from the BALF of the same participants were stained for CyTOF analysis. a) Frequencies of CD11b+CD11c+ (blue) MDMs expressing different cell surface markers. b) MDMs expressing cell surface markers associated with M1-like (CD86, HLA-DR) and M2-like (CD163, CD206) cells. c) CD32 expression in CD11b+CD11c+ (blue) and CD11b++CD11c+ (yellow) HAM populations. Data are presented as medians with interquartile ranges. *: p<0.05, **: p<0.01
Figure 4.
Figure 4.
M.tb-induced alterations in gene expression are delayed in HAMs of T2D patients. Differential expression analysis of M.tb-infected HAMs of a) no-T2D controls and b) T2D patients compared to uninfected HAMs. Genes with FDR-adjusted p-value<0.1 and log2 fold changes (LFC) of >1 or <−1 were considered differentially expressed. Green corresponds to genes whose expression was significantly downregulated upon M.tb infection and red corresponds to genes whose expression was significantly upregulated. Venn diagrams were used to illustrate the number of co-expressed genes. Venn diagrams were also used to indicate the number of co-expressed genes between the two patient groups at c) 2h, d) day 1 and e) day 3. Gene Ontology Resource (PANTHER) was used to determine the biological processes, molecular functions and cellular components the genes, that were significantly upregulated in M.tb-infected T2D HAMs vs no-T2D HAMs, were involved in at f) 2h and g) day 1.
Figure 5.
Figure 5.
Cytokine/chemokine concentrations in HAMs and MDMs culture supernatant. Culture supernatants from both infected and uninfected cells were collected at 2h, day 1 and 3 p.i. and the cytokine/chemokine concentrations measured using the Luminex platform. a) Protein concentrations were clustered according to cell type, group and time point. The ComplexHeatmap package in R was used to generate the heatmap using the mean concentration of each analyte at each time point. Within each cell type, the analyte means were scaled between 0 (blue) and 1 (red). b) Cytokine concentrations secreted by MDMs and HAMs of no-T2D controls at day 1 p.i. c) Cytokine concentrations from MDMs and HAMs of T2D patients at day 1 p.i. Luminex data were transformed to correct for the distribution of the data. Data are presented as mean±SEM. An adjusted p-value <0.05 was considered significant after correcting for multiple comparisons. CC: close contact, *: p<0.05, **: p<0.01, ***: p<0.001
Figure 6.
Figure 6.
MDMs and HAMs have opposing M.tb-induced cytokine responses associated with T2D status. Culture supernatants from both infected and uninfected cells were collected at 2h, day 1 and 3 p.i. and the cytokine concentrations measured using the Luminex platform. M.tb-induced cytokine/chemokine concentrations were normalized to uninfected controls. a) Using a heatmap, analyte concentrations were clustered according to cell type, group and time point. Within each cell type, the analyte concentrations were scaled around the median concentration. b) M.tb specific cytokine concentrations measured in the culture supernatant of MDMs. c) M.tb specific cytokine concentrations measured in the culture supernatant of HAMs. Luminex data were transformed to correct for the distribution of the data and the data presented as medians with interquartile ranges. An adjusted p-value < 0.05 was considered significant after correcting for multiple comparisons. d) Chord diagram summarizing the pathways in which the analytes of the individual clades are involved in.
Figure 7.
Figure 7.
Summary and genomic locations of differentially methylated positions (DMPs) of CpGs (uncorrected p < 0.01). Hyper- and hypomethylation refer to T2D methylation levels relative to non-diabetic levels. Overall hypomethylated and hypermethylated DMP counts are shown for whole blood leucocytes (51.9% hypomethylated) (a) and BAL (39.9% hypomethylated) cells (b). Individual chromosome methylation statistics are shown for whole blood leucocytes (c) and BAL cells (d). Principal component analysis of the methylation profile of individual participants shows no separation by T2D status in the blood (e), and a perfect separation by T2D status in BAL cells (f). Gene set enrichment analysis was done on the whole blood leucocytes (g) and BAL cells (h) using Human MSigDB Collections’ hallmark and gene ontology gene sets. The enrichment score (color gradient on the plots) refers to the fraction of genes in the gene set that were associated with differential methylation in each sample type.
Figure 8.
Figure 8.
Schematic summary of differences in the response of human monocyte-derived macrophage (MDM) and alveolar macrophage (HAM) to Mtb, by type 2 diabetes status. The blood of T2D patients has higher levels of glucose and triglycerides and circulating white blood cells and neutrophil counts. In contrast, T2D patients have lower neutrophil percentages in their bronchoalveolar lavage fluid. MDMs from T2D patients express less CD32, CD180, CD36 and CD16 and produce less IL-1RA and CSF2 (GM-CSF) in response to M.tb infection (day 1 p.i.). However, these changes did not result in changes in the ability of MDMs to phagocytose or kill M.tb. HAMs from T2D patients also express less CD32. HAMs, however, produce more TNF (day 1 p.i.) and CCL3 (MIP-1α) (day 3 p.i.) in response to M.tb. Twenty-four h (day 1) p.i., HAMs of T2D patients have a significantly higher bacterial burden which coincides with an overall decrease in gene expression and increase in DNA methylation. This figure was created with BioRender.com.

References

    1. World Health Organisation. Global Tuberculosis Report. 2023;https://www.who.int/teams/global-tuberculosis-programme/tb-reports/globa... .
    1. Jeon CY, Murray MB. Diabetes mellitus increases the risk of active tuberculosis: a systematic review of 13 observational studies. PLoS Med. 2008;5(7):e152. - PMC - PubMed
    1. Lee PH, Fu H, Lai TC, Chiang CY, Chan CC, Lin HH. Glycemic Control and the Risk of Tuberculosis: A Cohort Study. PLoS Med. 2016;13(8):e1002072. - PMC - PubMed
    1. Noubiap JJ, Nansseu JR, Nyaga UF, Nkeck JR, Endomba FT, Kaze AD, et al. Global prevalence of diabetes in active tuberculosis: a systematic review and meta-analysis of data from 2ꞏ3 million patients with tuberculosis. Lancet Glob Health. 2019;7(4):e448–e60. - PubMed
    1. International Diabetes Federation. IDF Diabetes Atlas Tenth Edition. 2021;Accessed 29 April 2020(https://diabetesatlas.org/atlas/tenth-edition/).

Publication types

LinkOut - more resources