. 2024;2(1):51.
doi: 10.1038/s44303-024-00055-x. Epub 2024 Dec 4.

Robust self-supervised denoising of voltage imaging data using CellMincer

Affiliations

Robust self-supervised denoising of voltage imaging data using CellMincer

Brice Wang et al. Npj Imaging. 2024.

Abstract

Voltage imaging is a powerful technique for studying neuronal activity, but its effectiveness is often constrained by low signal-to-noise ratios (SNR). Traditional denoising methods, such as matrix factorization, impose rigid assumptions about noise and signal structures, while existing deep learning approaches fail to fully capture the rapid dynamics and complex dependencies inherent in voltage imaging data. Here, we introduce CellMincer, a novel self-supervised deep learning method specifically developed for denoising voltage imaging datasets. CellMincer operates by masking and predicting sparse pixel sets across short temporal windows and conditions the denoiser on precomputed spatiotemporal auto-correlations to effectively model long-range dependencies without large temporal contexts. We developed and utilized a physics-based simulation framework to generate realistic synthetic datasets, enabling rigorous hyperparameter optimization and ablation studies. This approach highlighted the critical role of conditioning on spatiotemporal auto-correlations, resulting in an additional 3-fold SNR gain. Comprehensive benchmarking on both simulated and real datasets, including those validated with patch-clamp electrophysiology (EP), demonstrates CellMincer's state-of-the-art performance, with substantial noise reduction across the frequency spectrum, enhanced subthreshold event detection, and high-fidelity recovery of EP signals. CellMincer consistently outperforms existing methods in SNR gain (0.5-2.9 dB) and reduces SNR variability by 17-55%. Incorporating CellMincer into standard workflows significantly improves neuronal segmentation, peak detection, and functional phenotype identification, consistently surpassing current methods in both SNR gain and consistency.

Keywords: Cellular imaging; Fluorescence imaging; Image processing.


Conflict of interest statement

Competing interestsAuthor M.B. is a consultant and a scientific advisory board member of Hepta Bio. The other authors declare no competing interests.

Figures

Fig. 1
Fig. 1. Overview of voltage imaging data and CellMincer denoising model.
a A simplified schematic diagram of a typical optical voltage imaging experiment (left). The spatially resolved fluorescence response is recorded over time to produce a voltage imaging movie. A key component of CellMincer’s preprocessing pipeline is the computation of spatial summary statistics and various auto-correlations from the entire recording, which are concatenated into a stack of global features (right). b An overview of CellMincer’s deep learning architecture. c The conditional U-Net convolutional neural network (CNN). At each step in the contracting path, the precomputed global feature stack is spatially downsampled in parallel (FFF) and concatenated to the intermediate spatial feature maps. d The temporal post-processor neural network. The sequence of pixel embeddings are convolved with a 1D kernel along the time dimension, producing a single vector of length C. A multilayer perceptron subsequently reduces this vector to a single value. e A comparison of model performance on simulated data before and after introducing global features as a U-Net conditioner. Using global features confers an average increase of 5 dB to the denoiser, roughly corresponding to a 3-fold noise reduction. The presented data consists of several segments in which the simulated recording was performed under several neuron stimulation conditions, which are reported as separate distributions of PSNR gain. For further elaboration, see “Optimizing CellMincer network architecture and training scheduleusing Optosynth-simulated datasets” in “Methods”.
Fig. 2
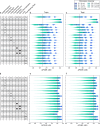
Fig. 2. Benchmarking CellMincer and three other denoising methods on simulated voltage imaging.
a Sample denoised frame visualizations (grayscale images) and their residuals with respect to simulated ground truth imaging (red/blue images). Both the denoised and residual images are shown as relative change in fluorescence ΔF/F with respect to a frame-averaged polynomial regression of the baseline (see “CellMincer preprocessing and global feature extraction details” in “Methods”). b Sample denoised ROI-averaged neuron traces (color), overlaid with the ground truth (black). c Distributions of single-frame PSNR gain achieved through denoising. Each distribution corresponds to a different value of simulated photon-per-fluorophore count Q (shown in the legend), which is the measure of raw data SNR in Optosynth simulations (see “Simulating realistic voltage imaging datasets using Optosynth” in “Methods”). The dashed vertical line over the top four rows is a guide for the eye and indicates the mode of CellMincer’s PSNR gain distribution for the lowest SNR data (corresponding to Q = 5). The plot at the bottom row shows the SNR distributions of the raw datasets at different Q levels. d Distributions of lagged cross-correlations between denoised single-neuron traces and their ground truths. Their medians are overlaid with peak correlations at Δt = 0 labeled. Abbreviations: GT (ground truth).
Fig. 3
Fig. 3. Benchmarking CellMincer and two other denoising methods on paired optical and patch clamp datasets.
a Sample denoised ROI-averaged neuron traces (color), aligned to the EP-derived ground truth (black). b Inlays of subthreshold activity as indicated in the previous column, magnified. c Distributions of lagged cross-correlations between denoised single-neuron traces and their corresponding aligned EP signals. Their medians are overlaid with peak correlations at Δt = 0 labeled. d Average noise reductions at varying frequency ranges achieved through denoising. e Peak-calling accuracy F1-scores over a range of EP peak prominence levels, using the EP signal as ground truth. Abbreviations: ROI (region of interest).
Fig. 4
Fig. 4. Comparing the spiking activity of chronically tetrodotoxin (TTX)-treated vs.
control hPSC-derived neurons with raw and CellMincer-denoised Optopatch voltage imaging data. a Raw and denoised versions of a sample frame, colored with the neuron components identified in their corresponding datasets. b Corresponding ROI-averaged single-neuron traces detected in both versions of the above frame. c Spike count distributions, separated by neuron population and stimulation intensity. Spikes were identified in each detected neuron’s trace and binned by their stimulation intensity. The separation between the sets of green (TTX-treated) and purple (Control) boxplots in each respective plot indicates the degree to which we were able to identify the difference in spiking activity in the data. d Detected neuron counts in the raw and denoised versions of each dataset. e Statistical power of the Wilcoxon Rank Sum test applied to the neuron population differentiation hypothesis, reported as the negative logarithm of its p-value.
Fig. 5
Fig. 5. Overview of Optosynth voltage imaging simulation environment.
a Single-neuron paired morphology and EP data downloaded from Allen Brain Atlas; b Generating experiment manifest, including selecting neurons and sweeps for each segment of the experiment, and random sampling and precomputing various simulation accessories; c Schematic illustration of the generation process of a movie frame: depending on the position of a pixel on a given neuron, an action potential wavefront propagation delay is read off from the precomputed delay map and is used to select the appropriately delayed timepoint on the EP voltage trace. The voltage value is converted to fluorescence amplitude in combination with the precomputed reporter heterogeneity and spike decay maps. This process is repeated within an efficient vectorized algorithm for all pixels for a given neuron and for all other neurons in the simulation. A background frame is generated and added to the total fluorescence amplitude map generated by the neurons. A point spread function (Gaussian blur) is applied to the total fluorescence map to generate a clean movie frame. The application of pixelwise Poisson-Gaussian noise with specified parameters (thermal noise strength, quantum yield) generates a noisy movie frame. This process is repeated for each frame in the stimulation segment and for all other segments in the simulation. d From top to bottom: (1) neuronal masks juxtaposed in different colors; (2) a simulated frame before the addition of background and PSF; (3) the same frame after the addition of background and PSF; (4) the same frame after the addition of Poisson-Gaussian noise.
Fig. 6
Fig. 6. CellMincer hyperparameter settings and their resulting models’ performance on Optosynth data.
Each model was evaluated on both its training data (b, e) and unseen test data (c, f). ac Initial series of experiments using no global features as a baseline. df Followup iteration of experiments using repeated global features as a baseline. The global features setting determines whether the precomputed global features is not used (0), used to augment the U-Net input only at the beginning (1), or used to augment repeatedly at every contracting path step (R). The included temporal post-processor variants refers to the architecture of the ultimate multilayer perceptron component: CC/2 → C (A), CCC/2 → 1 (B), and CCC → 1 (C). The architectural variants are ordered in increasing complexity. The pixel masking setting refers to the Bernoulli parameter used to decide whether each pixel is masked, a sampling process repeated for each training iteration. The second set of experiments adjusts the original baseline model to use a conditional U-Net with repeated global features.
Fig. 7
Fig. 7
A sample spectral power map (dB) of a residual voltage imaging recording before and after denoising with CellMincer.
Fig. 8
Fig. 8. A visualization of the prominence attribute in a simplified signal with three peaks.
A moderate prominence threshold would exclude transient peaks produced by noise fluctuations (green), and a larger threshold would exclude subthreshold activity (blue), leaving only the true action potentials (red).

Update of

References

    1. Adam, Y. et al. Voltage imaging and optogenetics reveal behaviour-dependent changes in hippocampal dynamics. Nature569, 413–417 (2019). - PMC - PubMed
    1. St-Pierre, F. et al. High-fidelity optical reporting of neuronal electrical activity with an ultrafast fluorescent voltage sensor. Nat. Neurosci.17, 884–889 (2014). - PMC - PubMed
    1. Hochbaum, D. R. et al. All-optical electrophysiology in mammalian neurons using engineered microbial rhodopsins. Nat. Methods11, 825–833 (2014). - PMC - PubMed
    1. Kulkarni, R. U. & Miller, E. W. Voltage imaging: pitfalls and potential. Biochemistry56, 5171–5177 (2017). - PMC - PubMed
    1. Lin, M. Z. & Schnitzer, M. J. Genetically encoded indicators of neuronal activity. Nat. Neurosci.19, 1142–1153 (2016). - PMC - PubMed

LinkOut - more resources