[Preprint]. 2024 Nov 25:2024.11.21.624746.
doi: 10.1101/2024.11.21.624746.

Diverse priming outcomes under conditions of very rare precursor B cells

Affiliations

Diverse priming outcomes under conditions of very rare precursor B cells

Patrick J Madden et al. bioRxiv. .

Update in

  • Diverse priming outcomes under conditions of very rare precursor B cells.
    Madden PJ, Marina-Zárate E, Rodrigues KA, Steichen JM, Shil M, Ni K, Michaels KK, Maiorino L, Upadhyay AA, Saha S, Pradhan A, Kalyuzhiny O, Liguori A, Lopez PG, Phung I, Flynn C, Zhou A, Melo MB, Lemnios A, Phelps N, Georgeson E, Alavi N, Kubitz M, Lu D, Eskandarzadeh S, Metz A, Rodriguez OL, Shields K, Schultze S, Smith ML, Healy BS, Lim D, Lewis VR, Ben-Akiva E, Pinney W 3rd, Gregory J, Xiao S, Carnathan DG, Pai Kasturi S, Watson CT, Bosinger SE, Silvestri G, Schief WR, Irvine DJ, Crotty S. Madden PJ, et al. Immunity. 2025 Apr 8;58(4):997-1014.e11. doi: 10.1016/j.immuni.2025.03.003. Epub 2025 Mar 31. Immunity. 2025. PMID: 40168992 Free PMC article.

Abstract

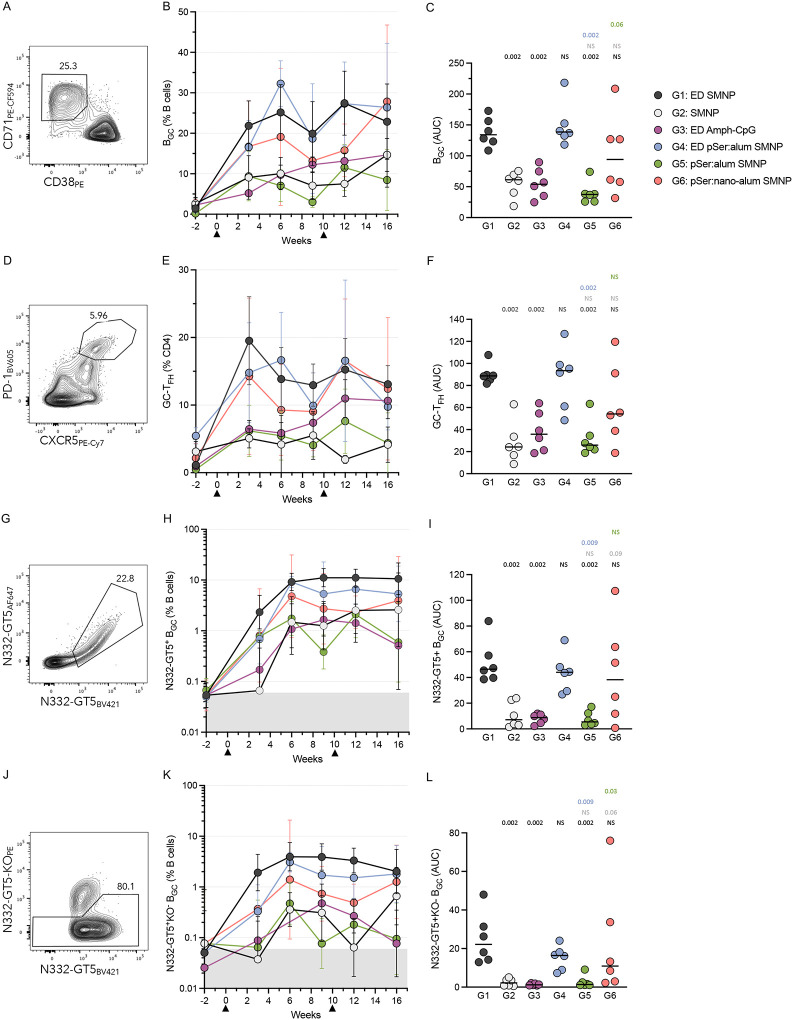
Rare B cells can have special pathogen-recognition features giving them the potential to make outsized contributions to protective immunity. However, rare naive B cells infrequently participate in immune responses. We investigated how germline-targeting vaccine antigen delivery and adjuvant selection affect priming of exceptionally rare BG18-like HIV broadly neutralizing antibody-precursor B cells (~1 in 50 million) in non-human primates. Only escalating dose (ED) priming immunization using the saponin adjuvant SMNP elicited detectable BG18-like cells in germinal centers (GCs). All groups had strong GC responses, but only ED+SMNP and bolus+SMNP induced BG18-like memory B cells in >50% of animals. One group had vaccine-specific GC responses equivalent to ED+SMNP, but BG18-like memory B cells were rarely detected. Following homologous boosting, BG18-like memory B cells were more frequent in a bolus priming group, but had lower somatic hypermutation and affinities. This outcome was inversely associated with post-prime antibody titers, suggesting antibody feedback can significantly influence rare precursor B cell responses.


Conflict of interest statement

Declaration of interests D.J.I. and S.C. are inventors on a patent for the SMNP adjuvant (US11547672B2). K.A.R. and D.J.I. are inventors on patent applications for the synergistic combination of alum and SMNP adjuvants (PCT/US2022/074302 and US No. 17/816,045). D.J.I. and W.R.S. are named as inventors on a patent for pSer technology (US No. 11,224,648 B2). J.M.S. and W.R.S. are inventors on patent applications related to immunogens in this manuscript that have been filed by Scripps and IAVI. W.R.S. is an employee and shareholder of Moderna, Inc. All other authors declare no competing interests.

Figures

Figure 1:
Figure 1:. Study schematic.
Study schematic showing seven immunization groups and sampling types and timepoints (n =6 for each)
Figure 2:
Figure 2:. Escalating dose immunization and SMNP prime larger GC responses.
A) Flow cytometry gating of BGC cells (CD38CD71+). B) BGC cell frequency (CD38CD71+) as a percentage of total B cells (CD20+). C) Area under the curve (AUC) of BGC cell frequency as a percentage of total B cells post-priming (weeks 3–9) immunization. D) Flow cytometry gating of GC-TFH cells (PD-1HiCXCR5+). E) GC-TFH cell frequency as a percentage of total CD4+ cells. F) AUC of GC-TFH cell frequency as a percentage of total CD4+ cells post-priming (week 3–9) immunization. G) Flow cytometry gating of N332-GT5 antigen specific BGC cells (N332-GT5-AF647+N332-GT5-BV421+; N332-GT5++). H) Antigen-specific BGC cell frequency (N332-GT5-AF647+N332-GT5-BV421+) as a percentage of total B cells (CD20+). I) Area under the curve (AUC) of antigen-specific BGC cell frequency as a percentage of total B cells post-priming (weeks 3–9) immunization. J) Flow cytometry gating of N332-GT5 epitope specific BGC cells (N332-GT5-AF647+N332-GT5-BV421+N332-GT5KO-PE). K) Epitope-specific BGC cell frequency (N332-GT5-AF647+N332-GT5-BV421+N332-GT5KO-PE) as a percentage of total B cells (CD20+). I) Area under the curve (AUC) of epitope-specific BGC cell frequency as a percentage of total B cells post-priming (weeks 3–9) immunization. Triangles in longitudinal graphs represent time of immunizations. Mean and SEM or geometric mean and geometric SD are plotted depending on the scale in all longitudinal figures and median was plotted in all per animal figures. Statistical significance was tested using unpaired two-tailed Mann-Whitney tests with the p-values listed on each graph representative of the tests carried out, NS listed when p-value was >0.1. Gray regions (H, K) represent BGC LOD determined using pre-immunization samples.
Figure 3:
Figure 3:. Escalating dose adjuvanted with SMNP leads to a larger, more diverse, composition of BCRs 3-weeks post-prime.
A) Frequency of BG18 type I BGC cells from week 3 among total B cells, plotted per animal. Numbers below indicate total number of paired BCR sequences recovered from each group and the total number of BG18 type I BCRs recovered. All cells are from week LN FNAs. B) Clonal richness of the BCR sequences recovered from epitope specific BGC cells plotted as the Chao1 index on a per animal basis. Chao was calculated for all animals that had at least 1 sequence recovered. C) Clonal abundance curves for each group. Clonal abundance was calculated per animal then the mean abundance for each clone rank was plotted for each group. Animals with fewer than 5 total clones were excluded from abundance calculations. D) Cumulative abundance of the top 5 most abundant clones plotted per animal. Animals with fewer than 5 total clones were excluded from abundance calculations. E) Percentage of each Ig isotype making up the total BCR sequences isolated from each group. The lines in all per animal graphs represent medians. Statistical significance was tested using unpaired two-tailed Mann-Whitney tests with the p-values listed on each graph representative of the tests carried out except for A) where multiple Fisher’s exact tests were used to compare each group directly to G1, NS listed when p-value was >0.1.
Figure 4:
Figure 4:. Vaccine-elicited T cell and serum IgG responses.
A) Representative flow cytometry gating of an AIM assay performed at week 2 using N332-GT5 (Env) overlapping peptide pools or a DMSO control (unstimulated). B) Frequency of AIM+ (CD40L+OX40+) T cells out of total CD4+ T cells. C) Representative flow cytometry gating of an AIM assay performed at week 2 using N332-GT5 (Env) overlapping peptide pools. Red dots are Env+ cells. D) Frequency of AIM+ (CD40L+OX40+) cTFH cells out of total CD4+ cTFH cells. E) Representative flow cytometry gating of an AIM assay performed at week 2 using N332-GT5 (Env) overlapping peptide pools or a DMSO control (unstimulated). F) Frequency of AIM+ICS+ (CD40L+IL21+) T cells out of total CD4+ T cells. G) Representative flow cytometry gating of an AIM assay performed at week 2 using N332-GT5 overlapping peptide pools. H) Frequency of AIM+ICS+ (CD69+IFNg+) T cells out of total CD8+ T cells. I) Longitudinal area under the curve (AUC) of total antigen-specific serum IgG measured by ELISA. J) AUC of antigen-specific serum IgG at week 10 plotted by animal. K) Longitudinal area under the curve (AUC) of total epitope-specific serum IgG measured by ELISA. L) AUC of epitope-specific serum IgG at week 10 plotted by animal. Mean and SD are plotted in I and K, lines in all other graphs are median values. Pre-immunization time point included in all AIM/ICS assays. Statistical significance was tested using unpaired two-tailed Mann-Whitney tests with the p-values listed on each graph representative of the tests carried out, NS listed when p-value was >0.1. The row of asterixis in B, D, F, and H above the Y-axis indicate statistical significance for each group compared to the pre-immunizations samples using the following scale: NS > 0.05, * <0.05,** <0.01, *** <0.001, **** <0.0001.
Figure 5:
Figure 5:. Antigen-specific Bmem responses.
A) Representative flow cytometry gating showing N332-GT5 antigen specific (N332-GT5-AF647+N332-GT5-BV421+) Bmem cells. B) Frequency of antigen-specific Bmem cells of total B cells from PBMCs over time for each group. C) Representative flow cytometry gating showing N332-GT5 epitope specific (N332-GT5-AF647+N332-GT5-BV421+N332-GT5KO-PE) Bmem. D) Frequency of epitope specific Bmem cells of total B cells over time for each group. E) Week 10 and week 12 antigen specific Bmem frequency plotted per animal. F) Fold change of week 12 antigen specific Bmem frequency over the week 10 antigen specific Bmem frequency. G) Week 10 and week 12 epitope specific Bmem frequency plotted per animal. H) Fold change of week 12 epitope specific Bmem frequency over the week 10 epitope specific Bmem frequency. I) Frequency of BG18 type I BCRs that are Bmem cells among total B cells plotted per animal at week 12. Numbers below indicate total number of paired BCR sequences recovered from each group and the total number of BG18 type I BCRs recovered. J) Clonal richness of the BCR sequences recovered from epitope specific Bmem cells from week 12 plotted as the Chao1 index on a per animal basis. Chao was calculated for all animals that had at least 1 sequence recovered. K) Clonal abundance curves for each group from sequences at week 12. Clonal abundance was calculated per animal then the mean abundance for each clone rank was plotted for each group. Animals with fewer than 5 total clones were excluded from abundance calculations. L) Cumulative abundance of the top 5 most abundant clones plotted per animal. The lines in all per animal graphs represent medians. M) Frequency of IGHD3–41 usage in IgM+ naïve B cells for 35 of the 36 animals plotted by specific genotype. Statistical significance was tested using unpaired two-tailed Mann-Whitney tests with the p-values listed on each graph representative of the tests carried out, NS listed when p-value was >0.1. Gray regions (B, D, E, G) represent Bmem LOD determined using pre-immunization samples.
Figure 6:
Figure 6:. Level of antigen specific circulating IgG predict boost outcomes
A) AUC of antigen-specific serum IgG at week 12 plotted by animal. B) Fold change increase in serum IgG from week 10 to 12 calculated by taking week 12 AUC over week 10 AUC. C) AUC of epitope-specific serum IgG at week 12 plotted by animal. D) Fold change from week 10 to 12 for N332-GT5 epitope specific serum IgG. E) Correlation between fold change increase from week 10 to 12 and week 10 AUC. r and p-value are from pearson correlation analysis. F) Correlation between fold change increase for antigen-specific Bmem from week 10 to 12 and week 10 IgG AUC. r and p-value are from pearson correlation analysis. G) N332-GT5 specific BM-BPC measured from bone marrow aspirates by ELISpot assay at weeks 10 and 16. H) Fold change from week 10 to 12 for BM-BPC. Statistical significance was tested using unpaired two-tailed Mann-Whitney tests with the p-values listed on each graph representative of the tests carried, NS listed when p-value was >0.1.
Figure 7:
Figure 7:. BG18 type I BCRs have more SHM and higher affinity for boosting candidates.
A) Quantitation of BG18 clones in each group and the number of IGHV genes used by those clones. B) Graph of the percentage of BG18 type I clones for each group that use the specified IGHV genes. C) Heavy chain nucleotide mutations plotted on a per cell basis for each group. Both total recovered BCRs and BG18 type I BCRs are shown with the number of sequences in each, the median mutations listed, and the percent of all sequences with at least 1 mutation. Statistical significance was tested using unpaired two-tailed Mann-Whitney test. D) Binding affinities (Apparent KD) for a random subset of BG18 type I BCRs expressed from groups 1 and 2 to N332-GT5 and three potential boosting immunogens obtained by capturing IgG as the ligand and flowing trimers as analyte. Number and percent of binders are listed for each comparison (G1: n = 8, G2: n = 14). Dotted line represents the limit of detection for this assay. Statistical significance was tested between groups using unpaired two-tailed Mann-Whitney tests.

References

    1. Plotkin S.A. (2010). Correlates of Protection Induced by Vaccination. Clin. Vaccine Immunol. 17, 1055–1065. 10.1128/cvi.00131-10. - DOI - PMC - PubMed
    1. Burton D.R. (2023). Antiviral neutralizing antibodies: from in vitro to in vivo activity. Nat. Rev. Immunol. 23, 720–734. 10.1038/s41577-023-00858-w. - DOI - PMC - PubMed
    1. Goldblatt D., Alter G., Crotty S., and Plotkin S.A. (2022). Correlates of protection against SARS-CoV-2 infection and COVID-19 disease. Immunol. Rev. 310, 6–26. 10.1111/imr.13091. - DOI - PMC - PubMed
    1. Abbott R.K., Lee J.H., Menis S., Skog P., Rossi M., Ota T., Kulp D.W., Bhullar D., Kalyuzhniy O., Havenar-Daughton C., et al. (2018). Precursor Frequency and Affinity Determine B Cell Competitive Fitness in Germinal Centers, Tested with Germline-Targeting HIV Vaccine Immunogens. Immunity 48, 133–146.e6. 10.1016/j.immuni.2017.11.023. - DOI - PMC - PubMed
    1. Havenar-Daughton C., Sarkar A., Kulp D.W., Toy L., Hu X., Deresa I., Kalyuzhniy O., Kaushik K., Upadhyay A.A., Menis S., et al. (2018). The human naive B cell repertoire contains distinct subclasses for a germline-targeting HIV-1 vaccine immunogen. Science Translational Medicine 10, eaat0381. 10.1126/scitranslmed.aat0381. - DOI - PMC - PubMed

Publication types

LinkOut - more resources