[Preprint]. 2024 Nov 28:2024.11.26.625329.
doi: 10.1101/2024.11.26.625329.

An updated reference genome sequence and annotation reveals gene losses and gains underlying naked mole-rat biology

Affiliations

An updated reference genome sequence and annotation reveals gene losses and gains underlying naked mole-rat biology

Dustin J Sokolowski et al. bioRxiv. .

Abstract

The naked mole-rat (NMR; Heterocephalus glaber) is a eusocial subterranean rodent with a highly unusual set of physiological traits that has attracted great interest amongst the scientific community. However, the genetic basis of most of these traits has not been elucidated. To facilitate our understanding of the molecular mechanisms underlying NMR physiology and behaviour, we generated a long-read chromosomal-level genome assembly of the NMR. This genome was subsequently annotated and incorporated into multiple whole genome alignments in the Ensembl database. Our long-read assembly identified thousands of repeats and genes that were previously unassembled in the NMR and improved the results of routinely used short-read sequencing-based experiments such as RNA-seq, snRNA-seq, and ATAC-seq. We identified several spermatozoa related gene losses that may underlie the unique degenerative sperm phenotype in NMRs (IRGC, FSCB, AKAP3, MROH2B, CATSPER1, DCDC2C, ATP1A4, TEKT5, and ZAN), and an additional gene loss related to the established NK-cell absence in NMRs (PILRB). We resolved several tandem duplications in genes related to pathways underlying unique NMR adaptations including hypoxia tolerance, oxidative stress, and nervous system protection (TINF2, TCP1, KYAT1). Lastly, we describe our ongoing efforts to generate a reference telomere-to-telomere assembly in the NMR which includes the resolution of complex gene families. This new reference genome should accelerate the discovery of the genetic underpinnings of NMR physiology and adaptation.


Conflict of interest statement

EEE is a scientific advisory board (SAB) member of Variant Bio, Inc. JTS. receives research funding from Oxford Nanopore Technologies (ONT) and has received travel support to attend and speak at meetings organized by ONT, and is on the Scientific Advisory Board of Day Zero Diagnostics. The European Molecular Biology Laboratory (EMBL) core funding and the EMBL transversal research themes funding under the new scientific programme. Views and opinions expressed are however those of the author(s) only and do not necessarily reflect those of the European Union or the European Research Executive Agency (REA). Neither the European Union nor the granting authority can be held responsible for them.

Figures
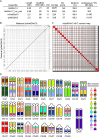
Figure 1.
Figure 1.. Global view of the de novo naked mole-rat assembly.
A) Summary statistics for global assembly evaluation in the short-read based NMR HetGla1.2, the scaffolded short-read based naked mole-rat assembly HetGla1.7_hic_pac, and the diploid assembly presented in this study (mHetGlaV3 and pHetGlaV3). B) Genome-wide dot plot between mHetGlaV3 and pHetGlaV3 calculated using D-GENIES. C) Genome-wide Hi-C contact map of the mHetGlaV3 visualized with Juicebox. D) in silico karyotype of the naked mole-rat genome. Chromosome numbers match the physical karyotype. Chromosome painting using the mouse (mm10) genome as a reference, because it is the most commonly studied rodent in genomics. For example, the dark green in the Q arm of naked mole-rat chromosome 1 corresponds to regions with large alignment blocks to mouse chromosome 16.
Figure 2.
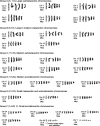
Figure 2.. Composite image details the morphological characteristics of each chromosome group, as observed by traditional cytogenetics.
Chromosome classes are grouped by centromeric position and ordered by descending sequence length. G-banded chromosome examples show a range of band resolutions. Ideograms illustrate landmark band locations.
Figure 3.
Figure 3.. Evaluation of the chromatin state of the hypothalamus in the naked mole-rat genome (mHetGlaV3).
A) Chromatin state emissions. Numbers in brackets show the proportion of the genome assigned to each chromatin state. The “heterogeneous chromatin state” (state 14) has activity of both H3K27me3 and H3K27Ac, representing regions with cell-type or cell-state dependent gene regulation. B) Genome browser snapshot of the GAD1 gene, a canonical marker for GABAergic neurons, with its promoter region representing the “heterogeneous state”.
Figure 4.
Figure 4.. Evaluation of transposable elements (TE) in the naked mole-rat genome.
A) Landscape plot displaying the distribution of TEs in HetGla1.2 (top), mHetGlaV3 (middle) and mouse (mm10) (bottom). The Y-axis represents the percentage of genome coverage, and the X-axis represents the Kimura distance of the TE, which reflects the rate of sequence transversion from the TE in the NMR genome and the best matching TE in the Dfam database. The lower the Kimura distance, the lower the rate of sequence transversion, and the more likely that the TE is evolutionarily young. Colour represents the TE class. B) Heatmap of the percentage of total genome coverage for each TE class in HetGla1.2, mHetGlaV3, and mm10.
Figure 5.
Figure 5.. Comparison of bulk RNA-seq and bulk ATAC-seq alignment and annotation between NMR assemblies.
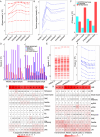
A-B) Total number of bulk RNA-seq reads aligned to each publicly available NMR assembly (A) or assigned to a gene feature (B). “HetGla1.2” and “HetGla1.7_hic_pac” (gap-filled HetGla1.2) are short-read based, while the HetGla assemblies are the long-read based assemblies published in this study. Each line represents the same bulk RNA-seq sample from Bens et al., 2018. C) Comparison of the number of expressed and non-expressed genes that are assigned a gene symbol between mHetGlaV3 (our primary assembly) and NMR2011. D) Distribution of reads assigned to features in HetGla1.2 (left) and mHetGlaV3 (right). Each group of bar plots is a different sample from Bens et al 2018. Purple bars are assigned reads. Light blue bars are unassigned due to ambiguity. Blue bars are unassigned due to multimapping. Red bars are unassigned because the read did not map to a feature in the assemblies annotation file. E-F) Comparison of ATAC-seq reads (E) and number of ATAC-seq peaks (F) from 12 samples in the NMR-hypothalamus (this study) when aligned to HetGla1.2, mHetGlaV2, and mHetGlaV3. G-H) Repeat annotation of the HetGla1.2-specific peaks when projected onto the mHetGlaV3 assembly. Each row is a different repeat class and each column is a different NMR sample. G) populates the heatmap with the percentage of HetGla1.2 peaks assigned to each repeat family. H) populates the heatmap with the fold-enrichment of each TE compared to the universe of ATAC-seq peaks using the gat enrichment tool.
Figure 6.
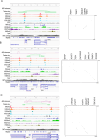
Figure 6.. Visualisation of four loci containing tandem duplications where both gene copies contain gene expression and regulation in the NMR.
A-D) Genome browser screenshots of loci containing the TINF2 (A), TCP1 (B), KYAT1 (C) genes. Screenshots on the left show NMR data projected onto the mHetGlaV3 assembly, and the right represents dot-plot between the same genomic regions between mHetGlaV3 and mm10.
Figure 7.
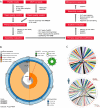
Figure 7.. Overview of the naked mole-rat primary genome assembly using sequencing technologies from the telomere-to-telomere genome era.
A) Genome assembly and evaluation pipeline of the naked mole-rat using Pacbio HiFi and ONT ultra-long reads. B) Assembly composition plot showing GC content, missingness, assembly and scaffold lengths, and BUSCO score. C) Circos plot comparing CAM-845F1 (HetGlaV4) (left) and HetGlaV3 (right). D) Ciros plot comparing the human, mouse and CAM-845F1 T2T genome assemblies.

References

    1. Pamenter M. E. Adaptations to a hypoxic lifestyle in naked mole-rats. J. Exp. Biol. 225, (2022). - PubMed
    1. Buffenstein R. et al. The naked truth: a comprehensive clarification and classification of current “myths” in naked mole-rat biology. Biol. Rev. Camb. Philos. Soc. 97, 115–140 (2022). - PMC - PubMed
    1. Jarvis J. U., O’Riain M. J., Bennett N. C. & Sherman P. W. Mammalian eusociality: a family affair. Trends Ecol. Evol. 9, 47–51 (1994). - PubMed
    1. Keane M. et al. The Naked Mole Rat Genome Resource: facilitating analyses of cancer and longevity-related adaptations. Bioinformatics 30, 3558–3560 (2014). - PMC - PubMed
    1. Brieño-Enríquez M. A. et al. Postnatal oogenesis leads to an exceptionally large ovarian reserve in naked mole-rats. Nat. Commun. 14, 670 (2023). - PMC - PubMed

Publication types

LinkOut - more resources