[Preprint]. 2024 Nov 28:2024.11.27.625768.
doi: 10.1101/2024.11.27.625768.

Hippocampal CA2 neurons disproportionately express AAV-delivered genetic cargo

Affiliations

Hippocampal CA2 neurons disproportionately express AAV-delivered genetic cargo

Georgia M Alexander et al. bioRxiv. .

Abstract

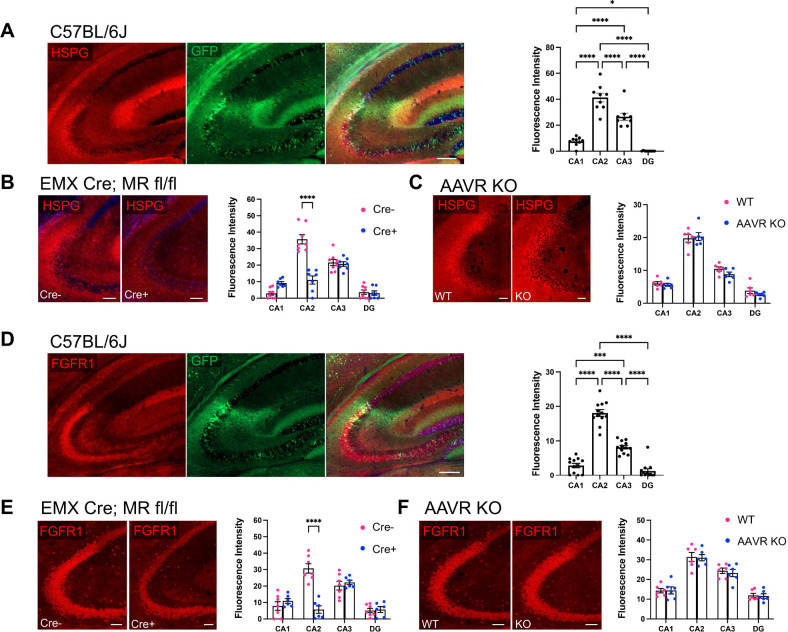
Hippocampal area CA2 is unique in many ways, largely based on the complement of genes expressed there. We and others have observed that CA2 neurons exhibit a uniquely robust tropism for adeno-associated viruses (AAVs) of multiple serotypes and variants. In this study, we aimed to systematically investigate the propensity for AAV tropism toward CA2 across a wide range of AAV serotypes and variants, injected either intrahippocampally or systemically, including AAV1, 2, 5, 6, 8, 9, DJ, PHP.B, PHP.eB, and CAP-B10. We found that most serotypes and variants produced disproportionally high expression of AAV-delivered genetic material in hippocampal area CA2, although two serotypes (AAV6 and DJ) did not. In an effort to understand the mechanism(s) behind this observation, we considered perineuronal nets (PNNs) that ensheathe CA2 pyramidal cells and, among other functions, buffer diffusion of ions and molecules. We hypothesized that PNNs might attract AAV particles and maintain them in close proximity to CA2 neurons, thereby increasing exposure to AAV particles. However, genetic deletion of PNNs from CA2 had no effect on AAV transduction. Next, we next considered the AAV binding factors and receptors known to contribute to AAV transduction. We found that the AAV receptor (AAVR), which is critical to transduction, is abundantly expressed in CA2, and knockout of AAVR nearly abolished expression of AAV-delivered material by all serotypes tested. Additionally, we found CA2 enrichment of several cell-surface glycan receptors that AAV particles attach to before interacting with AAVR, including heparan sulfate proteoglycans, N-linked sialic acid and N-linked galactose. Indeed, CA2 showed the highest expression of AAVR and the investigated glycan receptors within the hippocampus. We conclude that CA2 neurons are endowed with multiple factors that make it highly susceptible to AAV transduction, particularly to the systemically available PHP variants, including CAP-B10. Given the curved structure of hippocampus and the relatively small size of CA2, systemic delivery of engineered PHP or CAP variants could all but eliminate the need for intrahippocampal AAV injections, particularly when injecting recombinase-dependent AAVs into animals that express recombinases in CA2.


Conflict of interest statement

Conflict of Interest Statement: The authors declare no competing financial interests.

Figures

Figure 1.
Figure 1.
Intrahippocampally injected AAVs showed differential tropism for CA2 according to serotype or variant. A. Male C57BL/6J mice were injected bilaterally with AAV-hSyn-GFP of various serotypes/variants at the listed coordinates, all relative to Bregma. The specific serotypes and titer, held constant for all serotypes, are listed, and the volume injected in each instance was 250 nl. B. Representative images of GFP delivered by AAV2 (left) or AAV6 (right) serotypes at each of the injection site place (top row, −2.3 mm AP) and a more anterior plane (bottom row, −1.8 mm AP), defined as dorsal hippocampus (dHC) here. Plotted below are mean fluorescence intensities of GFP in the CA2 pyramidal cell layer, defined by PCP4 expression, and a similar area of CA1 pyramidal cell layer at each AP plane. AAV2 and AAV6, which showed the most robust expression of the serotypes, displayed opposite affinity for CA2 expression, with AAV2 showing the greatest GFP expression in CA2 of dHC and AAV6 showing the greatest GFP expression at the injection site in CA1. C. Mean fluorescence intensities for GFP delivered by the remaining AAVs and representative images from each plane of section. For measurements shown in B and C, image acquisition settings were held constant for all samples within a serotype, but settings differed across serotypes due to the relative expression level afforded by each. D. Samples were re-imaged using identical image acquisition settings for all samples across all serotypes to demonstrate the relative level of GFP expression with each AAV. The area of maximum fluorescence intensity, regardless of hippocampal subfield, was collected at each AP coordinate plane listed and compared across serotype (−2.3 AP: F(6,23)=84.91, p<0.0001; −1.8 AP: F(6,23)=18.79, p<0.0001, one-way ANOVAs with Tukey’s multiple comparisons tests). Results of repeated measures two-way ANOVAs associated with B and C are shown in Table 1. Results of Sidak’s multiple comparisons tests following two-way ANOVAs (B-C) and Tukey’s tests following one-way ANOVAs (D) shown on graphs. Replicates reflect brain hemispheres (two per animal). *p<0.05, **p<0.01. All scale bars = 250 μm.
Figure 2.
Figure 2.
PHP.B, PHP.eB, and CAP-B10 AAV variants, administered by retro-orbital injection, preferentially target CA2 neurons. C57BL/6J mice were injected retro-orbitally with hSyn-GFP packaged in either PHP.B or PHP.eB serotypes (A-B) or hSyn-jGCaMP8s packaged in CAP-B10 (C). A total of 1 × 10¹¹ GC of PBP.B or PHP.eB or 4 × 10¹¹ GC CAP-B10 was administered, with volume adjusted based on the titer. The representative images show a whole-brain coronal (A) or sagittal (C) sections immunostained for the CA2 marker, PCP4, and GFP following injection with PHP.B (A) or CAP-B10 (C) variants. CA2 is marked by the white arrows. Below each whole-brain image, an image of hippocampus only is shown. B. GFP fluorescence intensity was quantified in each hippocampal subfield for PHP.B and PHP.eB-injected animals. GFP expression in CA2 was significantly greater than expression in any other hippocampal subfield for both serotypes (PHP.B: F(3,15)=37.35, p<0.0001; PHP.eB: F(3,9)=107.8, p<0.0001). Results of Tukey’s multiple comparisons tests shown on graphs. Scale bars = 1 mm for whole brain images and 250 μm for hippocampal images.
Figure 3.
Figure 3.
CA2 highly expresses AAVR, and AAVR KO animals lack AAV expression. A. Immunofluorescence for AAVR and GFP in PHP.B-hSyn-GFP-injected animals shows overlap of high AAVR expression and GFP expression in CA2 (arrows). Quantification of AAVR fluorescence intensity shows significantly greater AAVR expression in CA2 than surrounding subfield (F(3,20)=34.80, p<0.0001; one-way ANOVA, results of Tukey’s post hoc tests shown on graph). B-C. Whereas WT animals show robust AAVR (B) and AAV-delivered GFP expression (C) in CA2, AAVR KO animals lack both AAVR (B) and AAV-delivered GFP expression (C). D. Quantification of GFP fluorescence intensity in WT and AAVR KO animals following retro-orbital injection of PHP.B or PHP.eB-hSyn-GFP. GFP expression was significantly lower in all subfields in the AAVR KO animals compared with WT littermates (PHP.B: genotype: F(1,12)=107.2, p<0.0001, subfield: F(1.4,16.5)=118.7, p<0.0001, interaction: F(3,36)=114.1, p<0.0001; PHP.eB: genotype: F(1,12)=1399, p<0.0001, subfield: F(1.4,16.9)=561.2, p<0.0001, interaction: F(3,36)=530.1, p<0.0001, two-way ANOVAs with Geisser-Greenhouse correction, results of Bonferroni multiple comparisons tests shown on graphs). Tissue from PHP.B and PHP.eB injections were processed and analyzed independently, so data cannot be directly compared between these two serotypes. E. Quantification of GFP fluorescence following intrahippocampal injection of AAV1, 2, 5, 6, 8, 9 or DJ-hSyn-GFP. Coordinates for injections: −2.3 AP, +/−2.3 ML, −1.9 DV. Ei. In comparing expression between genotypes, image acquisition settings were held constant within serotypes but differed across serotypes. Data are shown as the fluorescence intensity in KOs relative to mean expression in WTs for each serotype. Based on raw fluorescence intensity values, all serotypes had significantly lower expression in AAVR KOs than WTs (AAV1: t(6)=11.02, p<0.0001; AAV2: t(6)=2.91, p=0.026; AAV5: t(6)=8.06, p=0.0002; AAV6: t(6)=34.36, p<0.0001; AAV8: t(6)=4.20, p=0.0057, AAV9: t(6)=6.39, p=0.0007; AAVDJ: t(6)=2.46, p=0.049; two-tailed unpaired t-tests). Eii. GFP expression after delivery via AAV6 in AAVR WT and AAVR KO animals, although using separate microscope settings, meant to demonstrate the presence of GFP-expressing cells despite the lower overall expression level in the absence of the AAVR. Eiii. Images were acquired a second time from KO animals only with image acquisition setting held constant across all serotypes, and GFP fluorescence intensity was quantified, to identify the most highly expressed AAV serotype despite the absence of AAVR. AAV6-delivered GFP showed the greatest fluorescence intensity of all intrahippocampally injected AAVs in AAVR KO animals (F(6,21)=20.38, p<0.0001, one-way ANOVA, results of Tukey’s multiple comparisons tests shown on graph). Scale bar in A=250 μm, B,C=500 μm, E=100 μm. *p<0.05, **p<0.01, ***p<0.001, ****p<0.0001.
Figure 4.
Figure 4.
Mineralocorticoid receptor conditional KO animals (EMX Cre+; MR fl/fl) show less AAV-delivered GFP and less AAVR expression in CA2 than WT Cre− littermates. A. After retro-orbital injection with PHP.B-hSyn-GFP, Cre− animals showed robust expression in CA2 pyramidal cells (white arrows), found at the distal end of the mossy fibers, labeled by ZnT3. CA2 neurons also colocalize with perineuronal nets, as labeled by WFA. Cre+; MR fl/fl animals, which are known to lack CA2 perineuronal nets and other markers of CA2 pyramidal cells, showed significantly less GFP expression in CA2. As molecular markers of CA2 neurons are not expressed in CA2 of MR KO animals, we defined CA2 as the pyramidal cells at the distal end of the ZnT3-labeled mossy fibers (white arrows). B. Quantification of GFP fluorescence intensity in the cell body layer of each hippocampal subfield showed significantly decreased GFP expression in CA2 and significantly increased expression in DG of Cre+ MR fl/fl animals (subfield: F(3,48)=78.27, p<0.0001; genotype: F(1,16)12.20, p=0.0030; interaction: F(3,48)=98.02, p<0.0001). C. Quantification of WFA fluorescence intensity in the cell body layers. WFA was significantly decreased in CA2 of Cre+ MR fl/fl animals (subfield: F(3,45)=107.1, p<0.0001; genotype: F(1,15)=157.6, p<0.0001; interaction: F(3,45)=102.8, p<0.0001). D. Immunofluoresence for AAVR was significantly decreased in CA2 of Cre+ MR fl/fl animals compared with Cre− WTs (subfield: F(3,51)=75.29, p<0.0001; genotype: F(1,17)=4.35, p=0.052; interaction: F(3,51)=73.99, p<0.0001). Repeated-measured two-way ANOVAs with Bonferroni multiple comparisons used for all analyses, and results of multiple comparisons tests are shown on graphs. Scale bar in A=500 μm, D=100 μm.
Figure 5.
Figure 5.
Perineuronal nets do not facilitate AAV expression in CA2. A. Following retro-orbital injection of PHP.B-hSyn-GFP, GFP expression is seen in cells that also express perineuronal nets, labeled with WFA, including in pyramidal neurons of CA2 (left) and in presumptive parvalbumin expressing interneurons in CA1 (right, colabeled cells marked by arrows). B. In Amigo2 Cre; Acan fl/fl animals, Acan, and thus PNNs, are deleted from CA2 neurons. Arrows in each image demark CA2, as defined by PCP4 expression. C. Fluorescence intensity of WFA stain is significantly less in CA2 of Cre+ Amigo2; Acan fl/fl compared to Cre− controls (subfield: F(3,76)=43.84, p<0.0001; genotype: F(1,76)=55.64, p<0.0001; interaction: F(3,76)=18.04, p<0.0001). D. GFP expression does not differ in animals lacking PNNs in CA2 (subfield: F(3,76)=205.0, p<0.0001; genotype (F1,76)=2.55, p=0.11; interaction: F(3,76)=0.55, p=0.65). Repeated-measured two-way ANOVAs with Bonferroni multiple comparisons used for all analyses, and results of multiple comparisons tests are shown on graphs. Scale bars in A = 50 μm, B=500 μm.
Figure 6.
Figure 6.
Sambucus Nigra agglutinin (SNA), which recognizes N-linked sialic acid glycans and acts as a primary glycan receptor for AAVs enriched in CA2. A. SNA staining colocalizes with GFP expression following both PHP.B- and CAP-B10 injection. SNA fluorescence intensity is significantly higher in CA2 than all other subfields (F(3,9)=98.79, p<0.0001, one-way ANOVA; results of Tukey’s multiple comparisons tests shown on graph). B. In Cre+ MR fl/fl animals, SNA fluorescence is decreased in CA2, defined as the pyramidal cells at the distal end of the ZnT3-expressing mossy fibers (genotype: F(1,7)=20.89, p=0.0026; subfield: F(3,21)=142.4, p<0.0001; interaction: F(3,21)=94.62, p<0.0001, repeated-measures two-way ANOVA with Bonferroni multiple comparisons tests, shown on graph). C Immunofluorescence for SNA does not differ between AAVR KO animals and WT littermates (genotype: F(1,10)=0.3721, p=0.56; subfield: F(3,30)=544.2, p<0.0001; interaction: F(3,30)=0.88, p=0.47).
Figure 7.
Figure 7.
HSPG and FGFR1 stain is enriched in CA2 and colocalizes with (PHP.B) GFP. A. HSPGs, which are considered a primary glycan receptor for AAVs, showed significantly greater expression in CA2 compared with other subfield and coloalized with GFP expression following PHP.B-hSyn-GFP injection. CA3 also showed greater HSPG staining than CA1 and DG (F(3,24)=105.6, p<0.0001, RM one-way ANOVA; results of Tukey’s multiple comparisons tests shown on graph). B. HSPG staining is significantly decreased in CA2 of EMX-Cre+; MR fl/fl animals compared with Cre− animals (subfield: F(3,39)=97.47, p<0.0001; genotype: F(1,13)=7.77, p=0.015; interaction: F(3,39)=42.59, p<0.0001; RM two-way ANOVA, Bonferroni’s multiple comparisons results shown on graph). C. HSPG staining level was similar between AAVR KO animals and WTs (subfield: F(3,30)=199.8, p<0.0001; genotype: F(1,10)=1.13, p=0.31; interaction: F(3,30)=0.84, p=0.48, RM two-way ANOVA). D. Immunostaining for FGFR1, which has been described as an AAV co-receptor, in tissue from C57BL/6J animals injected with PHP.B-hSyn-GFP shows colocalization of FGFR1 and GFP. Fluorescence intensity for FGFR1 was significantly greater in CA2 than all other subfields, and CA3 showed increased expression relative to CA1 and DG (F(3,33)=166.9, p<0.0001, RM one-way ANOVA; results of Tukey’s multiple comparisons tests shown on graph). E. FGFR1 expression in CA2 is significantly decreased in Cre+ MR fl/fl aninmals compared to Cre− animals (subfield: F(3,33)=31.93, p<0.0001; genotype: F(1,11)=5.31, p=0.041; interaction: F(3,33)=26.44, p<0.0001; Bonferroni’s multiple comparisons results shown on graph). F. FGFR1 expression is similar in all subfields between AAVR KOs and WT littermates (subfield: F(3,30)=167.7, p<0.0001; genotype: F(1,10)=0.048, p=0.83; interaction: F(3,30)=0.14, p=0.93, RM two-way ANOVA). Scale bar in A, D=200 μm. Scale bars in B, C, E, F = 100 μm. *p<0.05, ***p<0.001, ****p<0.0001.
Figure 8.
Figure 8.
Focal injection of AAV6-hSyn-GFP into CA2 permits GFP expression in EMX Cre+; MR fl/fl animals at levels not significantly different from Cre− animals. Mossy fibers are immunopositive for ZnT3, and CA1 pyramidal cells are immunopositive for WFS1. In Cre− animals, CA2 pyramidal cells reside between the mossy fiber stain and the WFS1 stain, but in Cre+ animals, ZnT3 and WFS overlap in CA2. Fluorescence intensity of GFP in CA2 delivered by AAV6 intrahippocampal injection was not significantly different between Cre− and Cre+ animals (t(12)=0.29, p=0.77, two-tailed unpaired t-test).

References

    1. Alexander GM, Brown LY, Farris S, Lustberg D, Pantazis C, Gloss B, Plummer NW, Jensen P, Dudek SM (2018) CA2 neuronal activity controls hippocampal low gamma and ripple oscillations. eLife 7:e38052. - PMC - PubMed
    1. Alexander GM, Farris S, Pirone JR, Zheng C, Colgin LL, Dudek SM (2016) Social and novel contexts modify hippocampal CA2 representations of space. Nature Communications 7:10300. - PMC - PubMed
    1. Alexander GM, Nikolova VD, Stober TM, Gruzdev A, Moy SS, Dudek SM (2024) Perineuronal nets on CA2 pyramidal cells and parvalbumin-expressing cells differentially regulate hippocampal dependent memory. BioRxiv doi.org/ 10.1101/2024.11.07.622463. - DOI - PMC - PubMed
    1. Bai X, Brown JR, Varki A, Esko JD (2001) Enhanced 3-O-sulfation of galactose in Asn-linked glycans and Maackia amurenesis lectin binding in a new Chinese hamster ovary cell line. Glycobiology 11:621–632. - PubMed
    1. Besnard A, Miller SM, Sahay A (2020) Distinct Dorsal and Ventral Hippocampal CA3 Outputs Govern Contextual Fear Discrimination. Cell Rep 30:2360–2373.e5. - PMC - PubMed

Publication types

LinkOut - more resources