[Preprint]. 2024 Dec 3:2024.11.26.625568.
doi: 10.1101/2024.11.26.625568.

Structural and functional insights into activation and regulation of the dynein-dynactin-NuMA complex

Affiliations

Structural and functional insights into activation and regulation of the dynein-dynactin-NuMA complex

Merve Aslan et al. bioRxiv. .

Abstract

During cell division, NuMA orchestrates the focusing of microtubule minus-ends in spindle poles and cortical force generation on astral microtubules by interacting with dynein motors, microtubules, and other cellular factors. Here we used in vitro reconstitution, cryo-electron microscopy, and live cell imaging to understand the mechanism and regulation of NuMA. We determined the structure of the processive dynein/dynactin/NuMA complex (DDN) and showed that the NuMA N-terminus drives dynein motility in vitro and facilitates dynein-mediated transport in live cells. The C-terminus of NuMA directly binds to and suppresses the dynamics of the microtubule minus-end. Full-length NuMA is autoinhibited, but mitotically phosphorylated NuMA activates dynein in vitro and interphase cells. Together with dynein, activated full-length NuMA focuses microtubule minus-ends into aster-like structures. The binding of the cortical protein LGN to the NuMA C-terminus results in preferential binding of NuMA to the microtubule plus-end. These results provide critical insights into the activation of NuMA and dynein for their functions in the spindle body and the cell cortex.


Figures

Extended Data Figure 1.
Extended Data Figure 1.. Biochemical characterization and motility of N-terminal NuMA constructs.
a. Denaturing gel pictures of N-terminal NuMA constructs after gel filtration. The numbers on the left represent molecular weight in kDa. b. Elution of NuMA 1-505 from a Superose 6 gel filtration column. c. Mass photometry shows that NuMA 1-705 SpM forms a homodimer (mean ± s.d.). d. (Left) An example kymograph of DDN complexes formed with NuMA 1-705 SpM in vitro. Dynein and NuMA are colored with red and cyan, respectively. The assay was performed in 1 mM ATP and 100 mM KAc. (Right) The comparison of the run frequencies of single DDN complexes assembled with NuMA 1-505 and NuMA 1-705 SpM. The centerline and whiskers represent mean and s.d., respectively (From left to right, n = 29 and 40 MTs). The P value is calculated from a two-tailed t-test. The velocity and run length of complexes formed with NuMA 1-705 SpM could not be determined due to the infrequency of processive runs.
Extended Data Figure 2.
Extended Data Figure 2.. Cryo-EM image processing pipeline for DDN complexes in the presence of Lis1.
All refinements and classifications were performed in CryoSPARC unless otherwise specified. The masks used for particle subtraction are displayed in purple. Static masks used for refinements are displayed in yellow. When no mask is displayed, a dynamic mask was used instead. Before contrast transfer function (CTF) refinement, a non-uniform refinement was performed (not shown). The plots show gold-standard Fourier shell correlation for the final maps.
Extended Data Figure 3.
Extended Data Figure 3.. Structural analysis of the interactions between NuMA and dynein-dynactin.
a. The organization of the dynein-A and dynein-B interactions with the NuMA coiled-coil, with the dynactin subunits hidden. The arrow in the insert shows the viewing angle of the DDN complex. b. Fitting of an AF2 model of NuMA 351-450 bound to the dynactin pointed end complex into a locally refined EM density for the same region of dynactin, with the mask used and model colored by local predicted alignment error (PAE) values. Residues with low predicted local distance difference test (pLDDT) scores are hidden. c. The Spindly motif of NuMA bound to the p25 subunit of dynactin, colored by hydrophobicity. d. Sequence alignment of the Spindly motif region in NuMA orthologues, with the location of the mutations from Okumura et al.. e. Close-up view of the CC1-box-like motif (pink) on NuMA in our EM density. A model of the DLIC tail with the unstructured region extended illustrates that the interaction is likely unfavored due to the distance. f. Comparison between the AF2 model of the NuMA Hook domain interaction with DLIC1 and the published structure of the complex between the HOOK3 hook domain and DLIC1 (PDB 6B9H). Residues outside of the HOOK domain and DLIC are not displayed. g. PAE plots for AF2 complex models in a and f.
Extended Data Figure 4.
Extended Data Figure 4.. Biochemical characterization and structure prediction of C-terminal NuMA constructs.
a. Denaturing gel pictures of C-terminal NuMA constructs after gel filtration. b. The elution profile of NuMA C (black arrow) from a Superdex 200 gel filtration column. c. (Left) AF2 predicts that the NuMA C-terminus is almost fully unstructured except for a single short helix in MTBD1. (Right) PAE for the model on the left.
Extended Data Figure 5.
Extended Data Figure 5.. MT binding of C-terminal NuMA constructs.
a. An example picture shows that NuMA 1-505 (cyan) in the flow chamber does not bind to MTs (magenta). b. An example picture shows that MTBD2 (cyan) does not exhibit any detectable MT (magenta) binding when the salt concentration is increased to 400 mM. c. (Left) The denaturing gel picture shows the reduction of the molecular weight of tubulin due to the cleavage of tubulin C-terminal tails by subtilisin treatment. (Right) The normalized fluorescence intensity of 300 nM NuMA C and 50 nM MTBD2 on surface-immobilized MTs in the presence and absence of subtilisin treatment. Error bars represent s.d. (n = 119, 166, 70, and 174 MTs from left to right). P-values are calculated from a two-tailed t-test. d. Two color kymographs of K490 (red) and NuMA C or MTBD1 (cyan) on the MT. MT polarity was determined from the plus-end directed motility of K490 motors. NuMA accumulates at the minus-end of the MTs.
Extended Data Figure 6.
Extended Data Figure 6.. Expression of NuMA Bonsai and NuMA FL constructs.
a. Denaturing gel pictures of NuMA FL and Bonsai constructs after gel filtration. b. The run lengths of single DDN complexes assembled with NuMA FL and Bonsai constructs. (n = 154, 87, 243, and 377 MTs motors for NuMA Bonsai, FL, S1969D, and T2055D, respectively). 1-CDFs of motor run length were fitted to a single exponential decay (blue dashed curves) to determine the mean run length (±s.e.).
Extended Data Figure 7.
Extended Data Figure 7.. MT binding of phosphomimetic mutants of NuMA.
a. An example negative-stain EM micrograph shows that NuMA S1969D forms a large cluster with coiled-coils pointing outward (black arrowhead). b. Example pictures show MT (magenta) binding of NuMA 3StoD and T2055D (cyan) under different concentrations. c. The intensity of NuMA 3StoD and T2055D per length of an MT (n = 25, 98, 101, 101, 25, 120, 131, 116, and 112 MTs from left to right). d. Normalized MT binding and end binding preference of NuMA FL, 3StoD, and T2055D (n = 104, 150, and 178 MTs from left to right).
Extended Data Figure 8.
Extended Data Figure 8.. The analysis of peroxisome trafficking assays.
a. Representative confocal images of peroxisomes (PEX3, green), NuMA (red), and tubulin (SiR-tubulin, grey) from z-stacks taken 45 minutes after rapamycin addition in WT RPE1 cells (control) and RPE1 cells expressing different NuMA constructs. Centrosomes (white dots in tubulin channel) and consequently area of quantification is marked by the yellow circle in each still. Cells are the same as in Fig. 5b. Scale bar = 5 μm. b. Normalized cytoplasmic NuMA concentration was calculated by averaging the mean pixel intensity for NuMA in the cytoplasm from the timepoints before rapamycin addition (n=16, 14, 15, 19, 22, 17, and 17 from left to right, two independent experiments). c. Normalized cytoplasmic NuMA concentration sorted by trafficking outcome. Cells are the same as in b. d. Average peroxisome signal accumulation over time using normalized GFP intensity, from a subset of cells where the centrosome (marked by SiR-tubulin) stayed in focus for the majority of frames. For NuMA 1-705, Bonsai, T2055D, and S1969D, only cells that had trafficking were tracked. Time points where the centrosome was out of focus were excluded. Shading represents s.d. From top to bottom, n = 7, 4, 5, 4, 2, 3, and 3 cells pooled from two independent experiments. e. Representative confocal images of peroxisomes (PEX3, green) before and after rapamycin addition in RPE1 cells expressing NuMA 1-705 SpM. Scale bar = 5 μm. In b and c, the centerline and whiskers represent mean and s.d., respectively. P values are calculated from a two-tailed t-test.
Extended Data Figure 9.
Extended Data Figure 9.. Additional examples of the organization of MTs into aster-like structures by DDN.
a. NuMA 3StoD and T2055D bind to freely diffusing MTs but cannot bundle MTs or form MT asters. b. Additional examples of the organization of MTs into aster-like structures by active DDN complexes formed by NuMA 3StoD and T2055D. These structures were not observed in the absence of NuMA (DD only) or the presence of NuMA FL and NuMA 1-705. MT polarity was determined from the plus-end directed motility of Cy5-labeled K490 (not shown). Dynein, NuMA, and MTs are colored yellow, cyan, and magenta, respectively.
Extended Data Figure 10.
Extended Data Figure 10.. MT Binding of NuMA FL constructs in the presence of LGN.
a. The denaturing gel picture of the LGN construct after gel filtration. b. LGN does not bind to MTs in the absence of NuMA. c. The intensity of NuMA FL per length of an MT in the presence and absence (from Fig. 4c) of 470 nM LGN (From left to right, n = 25, 67, 67, 116, 25, 90, 115, and 86 MTs). d. The intensity of 3StoD and T2055D per length of an MT in the presence of 470 nM LGN (From left to right, n = 25, 113, 110, 99, 25, 98, 95, and 138 MTs). In b and d, NuMA, LGN, and MTs are colored cyan, red, and magenta respectively. The white color represents the colocalization of all three proteins.
Fig. 1.
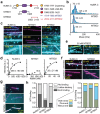
Fig. 1.. NuMA is a bona fide activator of dynein and dynactin.
a. Schematic for the mitotic roles of NuMA. (Left) NuMA recruits dynein/dynactin to the cell cortex by interacting with Gαi subunits of heterotrimeric G proteins and LGN. DDN complexes move toward the MT minus-end (blue arrows), pull on astral MTs (red arrows) and generate tension on the mitotic spindle. (Right) In spindle poles, DDN sorts and focuses the minus-ends of MTs. b. Domain organization and truncations of human NuMA. The N-terminal portion of the coiled-coil domain contains the CC1 box and Spindly motif that recruits dynein and dynactin. c. Mass photometry shows that NuMA 1-505, 1-705, and 1-1699 form homodimers (mean ± s.d.). d. Schematic depiction of the in vitro reconstitution and single molecule imaging of DDN motility on surface-immobilized MTs. Lis1 was added to stimulate the formation of the DDN complex. Dynein and NuMA were labeled with LD655 and LD555 dyes, respectively. e. Kymographs show the processive motility of DDN complexes formed with different NuMA constructs in vitro. The assays were performed in 1 mM ATP and 100 mM KAc. f. The run frequency, velocity, and run length of single DDN complexes. The centerline and whiskers represent mean and s.d., respectively (From left to right, n = 29, 29, and 43 MTs for the run frequency and 418, 682, and 93 motors for the velocity and run length measurements). P values are calculated from a two-tailed t-test. The inverse cumulative distribution functions (1-CDF) of motor run length were fit to a single exponential decay to determine the mean run length (±s.e.).
Fig. 2.
Fig. 2.. Cryo-EM structure of dynein-dynactin-NuMA-Lis1 on MTs.
a. Linearized AF2 prediction of NuMA 1-705, the construct used for this structure. b. EM density map of dynein-dynactin bound to NuMA and Lis1. The dynein motor domains, p150 arm, and Lis1 are not resolved. c. Multiple sequence alignment of HBS1 from NuMA orthologues. Other activating adaptors with known HBS1 sequences are shown for comparison. d. Cryo-EM density and model of the NuMA HBS1-DHC interfaces. e. AF2 model of the NuMA interaction with the dynactin pointed end. Individual dynactin subunits are labeled. f. Spindly motif interactions with the dynactin pointed end for JIP3 (PDB: 8PR4), BICDR1 (PDB: 7Z8M), and NuMA (AF2, this study) illustrate the different positions of the interacting residues, with multiple sequence alignment of the Spindly motif of the adaptors JIP3, HOOK3, BICDR1 and NuMA.
Fig. 3.
Fig. 3.. The C-terminus of NuMA preferentially binds to the minus-end of MTs.
a. The NuMA C-terminal region contains two MTBDs (MTBD1 and 2), a clustering motif, an LGN binding site (LGN-BS), and a nuclear localization signal (NLS). b. Mass photometry shows that the C-terminal constructs primarily form monomers (mean ±s.d.). c. Example pictures show NuMA C and MTBD2, but not MTBD1, densely decorated surface-immobilized MTs. d. The fluorescence intensity of NuMA constructs per length of an MT (n = 47, 46, 48, 53, 48, 48, 61, 18, 50, 52, 50, 54, 43, 59, 39, 62, 62, 60, 63, and 75 MTs from left to right). Kd values are calculated from a fit to a binding isotherm (solid black curves; ±s.e.; N.D.: not determined). e. MT binding of MTBD2 is greatly reduced by increasing the salt concentration. f. NuMA C and MTBD2 exhibit little to no binding to subtilisin-treated MTs. g. Example pictures show MT binding of C-terminal constructs at concentrations lower than their respective Kd values. MT polarity is determined from the directionality of plus-end-directed Cy5-labeled K490 motors (not shown). h. Normalized MT binding and end binding preference of C-terminal constructs (n = 107, 117, and 142 MTs from left to right). In c, e, f, and g, NuMA and MTs are colored in cyan and magenta, respectively.
Fig. 4.
Fig. 4.. NuMA-dynein interaction is activated by the phosphorylation of its C-terminus.
a. Negative-stain EM micrographs show that NuMA FL forms both elongated coiled coil (black arrow) and large clusters with coiled-coils pointing outward (black arrowhead), whereas NuMA 1-1699 forms only elongated coiled-coils. Dashed curves represent the trajectories of the coiled-coils. b. Example pictures show MT (magenta) binding of NuMA FL and Bonsai (cyan) under different concentrations. c. The intensity of NuMA constructs fused to mNeonGreen (mNG)per length of an MT (n = 25, 67, 67, 116, 25, 70, 25, 46, and 17 MTs from left to right). The Kd value of NuMA Bonsai was calculated from a fit to a binding isotherm (solid black curves; ±s.e.). d. Normalized MT binding and end binding preference of NuMA FL (n = 104 MTs). e. Kymographs show processive motility of DDN complexes assembled with NuMA FL and Bonsai. f. The run frequency and velocity of DDN complexes assembled with NuMA FL and Bonsai, compared to NuMA 1-705 (from left to right, n = 24, 52, 38 MTs for the run frequency and 85, 154, 682 motors for the velocity measurements). g. Kymographs show the processive motility of DDN complexes assembled with phosphomimetic mutants of NuMA FL. h. The run frequency and velocity of DDN complexes assembled with phosphomimetic mutants of NuMA FL (from left to right, n = 24, 28, 24, 23 MTs for run frequency and 286, 243, 435 motors for velocity measurements). In f and h, the centerline and whiskers represent mean and s.d., respectively. P values are calculated from a two-tailed t-test.
Figure 5.
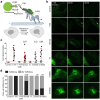
Figure 5.. Mitotically-phosphorylated NuMA activates dynein in interphase cells.
a. Cartoon depiction of peroxisome trafficking assay. Rapamycin addition (time 0:00) induces recruitment of a NuMA construct to peroxisomes and facilitates the trafficking of peroxisomes towards the centrosome if the NuMA construct activates dynein. b. Representative confocal images of peroxisomes (PEX3, green) before and after rapamycin addition in WT RPE1 cells (control) and RPE1 cells expressing different NuMA constructs. PEX3-mEmerald-FKBP levels vary between cells due to variations in transfections. Scale bar = 5 μm. c. Normalized mEmerald intensity at the centrosome, as assessed 45 min after rapamycin addition. Cells were scored as trafficking (black) if normalized fluorescence intensity was above the threshold (blue dashed line), which is two-fold higher than cytoplasmic background (grey; n = 16, 14, 15, 10, 22, 17, and 17 from left to right; two independent experiments). Error bars represent mean ±s.d. of trafficking cells. d. Percent of cells with peroxisome trafficking, from same samples as c and defined from normalized mEmerald intensity. In c and d, P values are calculated from a two-tailed t-test and Fisher’s exact test, respectively, in comparison to the 1-705 condition.
Fig. 6.
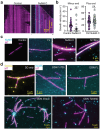
Fig. 6.. NuMA focuses MT minus-ends into asters with dynein/dynactin.
a. Kymographs of dynamic MTs with GMPCPP MT seeds in the presence and absence of 100 nM NuMA C. Minus-end accumulation of NuMA C stops its growth and shrinkage. b. Growth velocities of the MT plus and minus ends in the absence and presence of NuMA C (n = 41, 43, 59, and 126 MT growth events from left to right). The centerline and whiskers represent mean and s.d., respectively. P values are calculated from a two-tailed t-test. c. Example pictures show that NuMA FL weakly interacts with freely diffusing MTs, whereas NuMA C and MTBD2 form MT bundles (yellow arrows). d. In the presence of dynein and dynactin (DD), NuMA T2055D and 3StoD focus MT minus-ends into aster-like structures. In comparison, DD alone, DDN with NuMA 1-705, and NuMA FL did not bundle or focus MTs. MT polarity is determined from the minus-end-directed motility of DDNs (not shown). The disappearance of the MT signal near the center of the asters in DDN 3StoD and T2055D conditions is due to the bending of MTs in the z direction near the NuMA cluster, which positions them away from the evanescent field of TIRF excitation. In a, c, and d, NuMA, MTs, and dynein are colored in cyan, magenta, and yellow, respectively.
Figure 7.
Figure 7.. LGN favors MT plus-end binding and dynein activation of NuMA.
a. Mass photometry shows that NuMA C and LGN are primarily monomers and form a 3:3 complex when mixed in equimolar (20 nM) concentrations. b. Example pictures show MT binding (magenta) of NuMA FL (cyan) in 470 nM LGN (red). The white color represents the colocalization of all three proteins. c. Example pictures show the colocalization of NuMA C terminal constructs (cyan) and 100 nM LGN (unlabeled) on MTs (magenta). MT polarity is determined by the plus-end-directed motility of K490 (not shown). d. Normalized MT binding and end binding preference of NuMA constructs in the presence of 100 nM LGN (n = 65, 73, 247, and 81 MTs from left to right). e. Kymographs show the comigration of LGN with DDN complexes on unlabeled MTs. f. The run frequency of DDN complexes in the presence and absence of LGN. The centerline and whiskers represent mean and s.d., respectively (n = 34, 38, 11, 29, 28, and 23 MTs from left to right). P values are calculated from a two-tailed t-test.

References

    1. Kiyomitsu T. & Boerner S. The Nuclear Mitotic Apparatus (NuMA) Protein: A Key Player for Nuclear Formation, Spindle Assembly, and Spindle Positioning. Front Cell Dev Biol 9, 653801 (2021). - PMC - PubMed
    1. Radulescu A.E. & Cleveland D.W. NuMA after 30 years: the matrix revisited. Trends in cell biology 20, 214–222 (2010). - PMC - PubMed
    1. Serra-Marques A. et al. The mitotic protein NuMA plays a spindle-independent role in nuclear formation and mechanics. J Cell Biol 219 (2020). - PMC - PubMed
    1. Merdes A., Ramyar K., Vechio J.D. & Cleveland D.W. A complex of NuMA and cytoplasmic dynein is essential for mitotic spindle assembly. Cell 87, 447–458 (1996). - PubMed
    1. Heald R. et al. Self-organization of microtubules into bipolar spindles around artificial chromosomes in Xenopus egg extracts. Nature 382, 420–425 (1996). - PubMed

Publication types