. 2024 Nov 22:15:1474697.
doi: 10.3389/fmicb.2024.1474697. eCollection 2024.

MinD proteins regulate CetZ1 localization in Haloferax volcanii

Affiliations

MinD proteins regulate CetZ1 localization in Haloferax volcanii

Hannah J Brown et al. Front Microbiol. .

Abstract

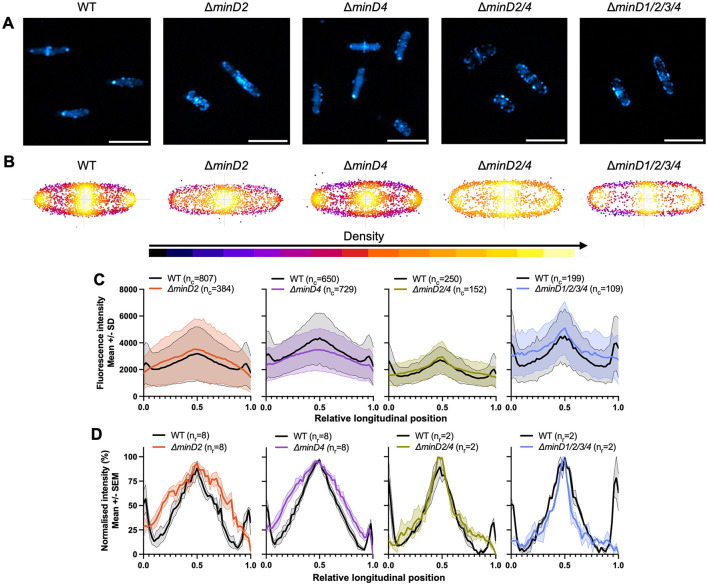
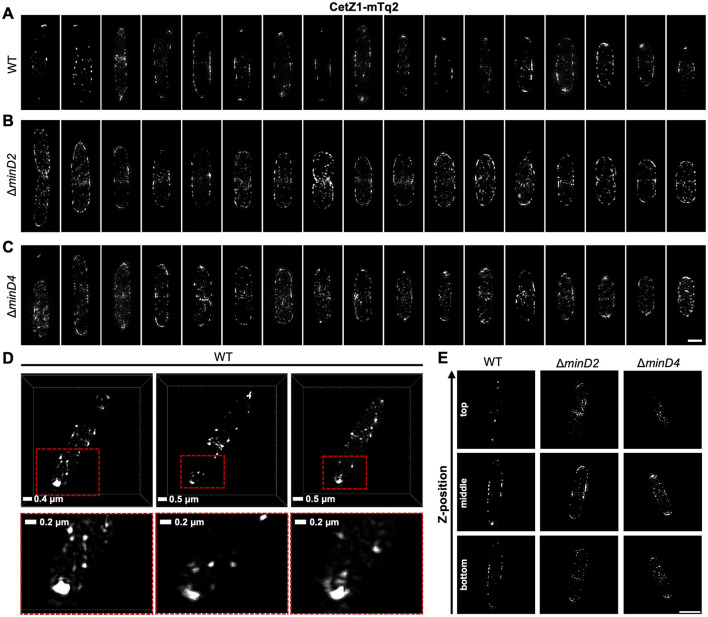
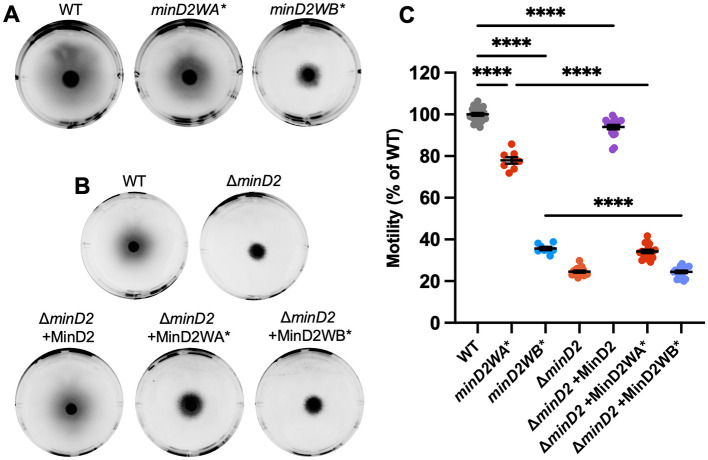
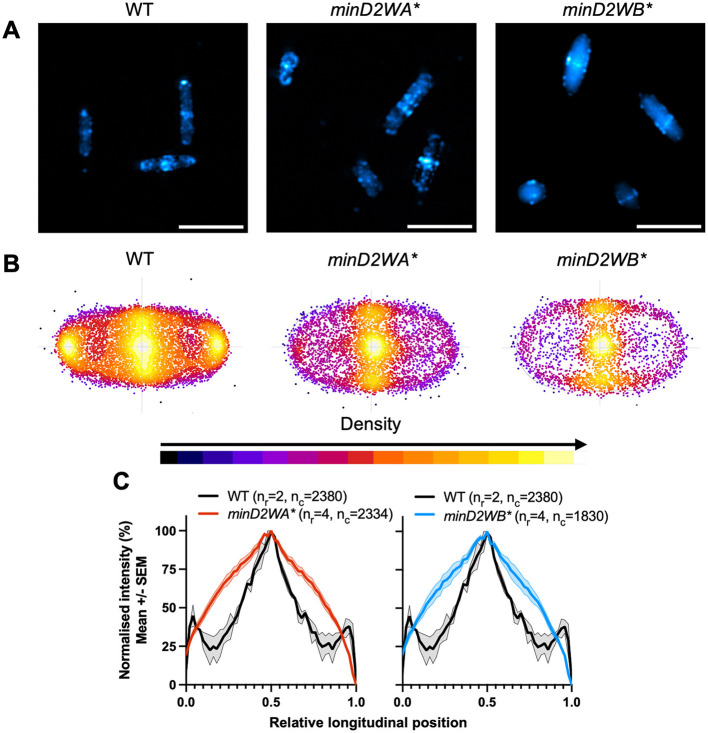
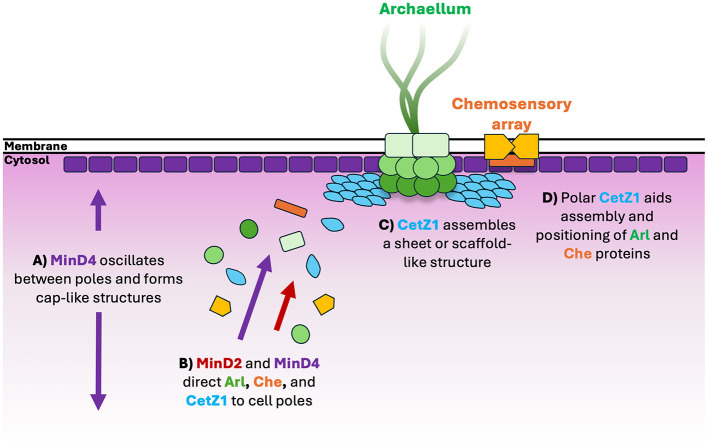
CetZ proteins are archaea-specific homologs of the cytoskeletal proteins FtsZ and tubulin. In the pleomorphic archaeon Haloferax volcanii, CetZ1 contributes to the development of rod shape and motility, and has been implicated in the proper assembly and positioning of the archaellum and chemotaxis motility proteins. CetZ1 shows complex subcellular localization, including irregular midcell structures and filaments along the long axis of developing rods and patches at the cell poles of the motile rod cell type. The polar localizations of archaellum and chemotaxis proteins are also influenced by MinD4, the only previously characterized archaeal member of the MinD family of ATPases, which are better known for their roles in the positioning of the division ring in bacteria. Using minD mutant strains and CetZ1 subcellular localization studies, we show here that a second minD homolog, minD2, has a strong influence on motility and the localization of CetZ1. Knockout of the minD2 gene altered the distribution of a fluorescent CetZ1-mTq2 fusion protein in a broad midcell zone and along the edges of rod cells, and inhibited the localization of CetZ1-mTq2 at the cell poles. MinD4 had a similar but weaker influence on motility and CetZ1-mTq2 localization. The minD2/4 mutant strains formed rod cell shapes like the wildtype at an early log stage of growth. Our results are consistent with distinct roles for CetZ1 in rod shape formation and at the poles of mature rods, that are positioned through the action of the MinD proteins and contribute to the development of swimming motility in multiple ways. They represent the first report of MinD proteins controlling the positioning of tubulin superfamily proteins in archaea.

Keywords: archaea; cytoskeleton; halophile; motility; protein localization; tubulin superfamily.


Conflict of interest statement

The authors declare that the research was conducted in the absence of any commercial or financial relationships that could be construed as a potential conflict of interest. The author(s) declared that they were an editorial board member of Frontiers, at the time of submission. This had no impact on the peer review process and the final decision.

Figures

Figure 1
Figure 1
MinD2 and MinD4 have roles in motility without influencing shape. (A) H26 wildtype and minD deletion mutant backgrounds, carrying an empty pTA962 vector, were used to inoculate the center of a soft agar plate. (B) The diameter of their motility halos was measured across six independent liquid starter culture replicates (represented by individual points), each determined from the mean of at least two replicate agar plates. Mean and standard error is shown. (C) Phase-contrast microscopy of cells grown in Hv-Cab liquid medium with 1 mM L-tryptophan, sampled at OD600 ~0.1. Scale bars = 5 μm. (D) Cell circularity distributions, quantified from phase-contrast images as a proxy for cell elongation. Large data points represent mean circularity of one culture replicate, small data points represent individual cells from all culture replicates for the indicated strain. Mean and standard error of culture replicate means are shown (bars). The number of individual cells measured from pooled culture replicates were as follows: WT + pTA962, n = 996; ΔminD2 + pTA962, n = 247; ΔminD4 + pTA962, n = 217; ΔminD2/4 + pTA962, n = 223; ΔminD1/2/3/4 + pTA962, n = 279. In (B, D), one-way ANOVA was used as a statistical test, and only significant and/or relevant comparisons are shown. ****p < 0.00005, ns, not significant.
Figure 2
Figure 2
MinD2 controls polar positioning of CetZ1. H26 wildtype and minD deletion strains containing pHVID135 (for expression of CetZ1-mTq2) were grown in Hv-Cab with 1 mM L-Tryptophan and sampled at an approximate OD600 of 0.1. (A) Epifluorescence images of CetZ1-mTq2 localization in the indicated minD knockout strains (scale bar 5 μm). (B) Heatmaps representing the position and number (heatmap density) of detected CetZ1-mTq2 fluorescence peak intensities (foci) along the long (vertical) and lateral (horizontal) axes of all cells combined. (C) The median fluorescence intensity of CetZ1-mTq2 along the normalized long axis of each cell was used to generate a plot of the mean (bold line) and standard deviation (shading) of the raw fluorescence intensity data from all cells (nc; combined from at least two replicate cultures). Cultures of the wildtype strain were repeated in parallel alongside each mutant independently. (D) The same intensity data were also normalized (0–100%) for each culture replicate and plotted as the mean (bold line) and standard error (shading) of all culture replicates (nr) to enable comparison of protein distributions amongst the various strains.
Figure 3
Figure 3
Subcellular structures of CetZ1-mTq2 in wildtype and minD mutant backgrounds, by 3D-SIM imaging. (A–C) Maximum intensity projections of CetZ1-mTq2 in H26 wildtype, ΔminD2, and ΔminD4 backgrounds, viewed along the imaging z-axis (i.e., XY-views). Scale bar in panel (C) is 1 μm and applies to panels (A–C). (D) XY-views of 3D rendered images, showing non-circular fluorescence foci of CetZ1-mTq2 at the cell poles in H26 wildtype background. Red boxes indicate zoomed area (bottom). (E) Examples of 3D-SIM slice sections of CetZ1-mTq2 in the indicated strains at approximate bottom, middle, and top z-positions of the cells (scale bar is 2 μm and applies to all images).
Figure 4
Figure 4
Chromosomal Walker mutants of minD2 perturb motility. (A) H26 wildtype, minD2WA*, and minD2WB* backgrounds containing pTA962, (B) and ΔminD2 containing pTA962 were compared to ΔminD2 containing pHJB63-65 for expression of minD2, minD2WA*, and minD2WB*, respectively, and inoculated onto Hv-Cab soft agar (0.25 % w/v) supplemented with 1 mM L-Tryptophan. (C) Halo diameters were quantified across four starter culture replicates with two technical replicates (motility agar plates) each (indicated by individual points). Mean and standard error are shown. One-way ANOVA was used as a statistical test, and only significant and relevant comparisons are shown. ****p < 0.00005.
Figure 5
Figure 5
Chromosomal Walker mutants of minD2 disrupt polar localization of CetZ1. H26 wildtype and minD2 walker mutant strains containing pHVID135 (for expression of CetZ1-mTq2) were grown in Hv-Cab with 1 mM L-Tryptophan and sampled at OD600 ~0.1. (A) Cells were imaged using epifluorescence to observe CetZ1-mTq2 localization. Scale bar 5 μm. (B) Heat map representations of detected foci of CetZ1-mTq2 and their localisations. Heatmaps are colored by density, referring to subcellular localization along the relative length of lateral and longitudinal axes only and do not fluorescence intensity. (C) Normalized median fluorescence intensity of CetZ1-mTq2 along the long axis of the cell, represented as the mean (bold line) and standard deviation (shading) of biological replicates (as in Figure 2D). Two biological replicates were carried out for the wildtype background, and four for each of minD2WA* and minD2WB*, and data for H26 wildtype is included on both graphs for reference. The number of culture replicates (nr) and number of cells (nc) measured from pooled replicates are indicated in the key of panel (C).
Figure 6
Figure 6
Schematic model for assembly of motility proteins at cell poles. (A) MinD4 oscillates between cell poles and forms cap-like localisations at cell poles in an ATPase dependent manner (Nußbaum et al., 2020). (B) MinD4 (Nußbaum et al., 2020) and MinD2 direct protein constituents of the archaellum (“Arl”) and chemosensory arrays (“Che”) such as ArlD and CheW, respectively, to cell poles (Patro et al., 2024). CetZ1 is also directed to cell poles, likely by both MinD paralogs, but more dominantly by MinD2. (C) At cell poles, CetZ1 is hypothesized to assemble as a sheet or disc-like structure, (D) where it may contribute to assembly and positioning of motility structures via an unknown mechanism (Brown et al., 2024).

Similar articles

References

    1. Abdul Halim M. F., Pfeiffer F., Zou J., Frisch A., Haft D., Wu S., et al. . (2013). Haloferax volcanii archaeosortase is required for motility, mating, and C-terminal processing of the S-layer glycoprotein. Mol. Microbiol. 88, 1164–1175. 10.1111/mmi.12248 - DOI - PubMed
    1. Abdul Halim M. F., Schulze S., DiLucido A., Pfeiffer F., Bisson Filho A. W., Pohlschroder M., et al. . (2020). Lipid anchoring of archaeosortase substrates and midcell growth in haloarchaea. MBio 11:e00349-20. 10.1128/mBio.00349-20 - DOI - PMC - PubMed
    1. Allers T., Barak S., Liddell S., Wardell K., Mevarech M. (2010). Improved strains and plasmid vectors for conditional overexpression of His-tagged proteins in Haloferax volcanii. Appl. Environ. Microbiol. 76, 1759–1769. 10.1128/AEM.02670-09 - DOI - PMC - PubMed
    1. Allers T., Ngo H.-P., Mevarech M., Lloyd R. G. (2004). Development of additional selectable markers for the halophilic archaeon Haloferax volcanii based on the leuB and trpA genes. Appl. Environ. Microbiol. 70, 943–953. 10.1128/AEM.70.2.943-953.2004 - DOI - PMC - PubMed
    1. Aylett C. H., Duggin I. G. (2017). “The tubulin superfamily in archaea,” in Prokaryotic Cytoskeletons, eds. J. Löwe, and L. Amos (Cham: Springer; ), 393–417. 10.1007/978-3-319-53047-5_14 - DOI - PubMed

LinkOut - more resources