. 2024 Nov 22:15:1456331.
doi: 10.3389/fphys.2024.1456331. eCollection 2024.

Peak systolic blood pressure during preparticipation exercise testing in 12,083 athletes: age, sex, and workload-indexed values and predictors

Affiliations

Peak systolic blood pressure during preparticipation exercise testing in 12,083 athletes: age, sex, and workload-indexed values and predictors

Petra Pesova et al. Front Physiol. .

Abstract

Aim: Assessment of blood pressure during exercise is routine in athletes, but normal values remain equivocal. This study examines the response of systolic blood pressure (SBP) to exercise in a large cohort of athletes and establishes normative values by sex and age.

Methods: Competitive athletes free of cardiovascular disease underwent pre-participation exercise testing on a bicycle ergometer. Resting (SBPrest) and peak blood pressure (SBPpeak), heart rate (HRrest and HRpeak), and power output (WR) were recorded. Workload indexed values were calculated.

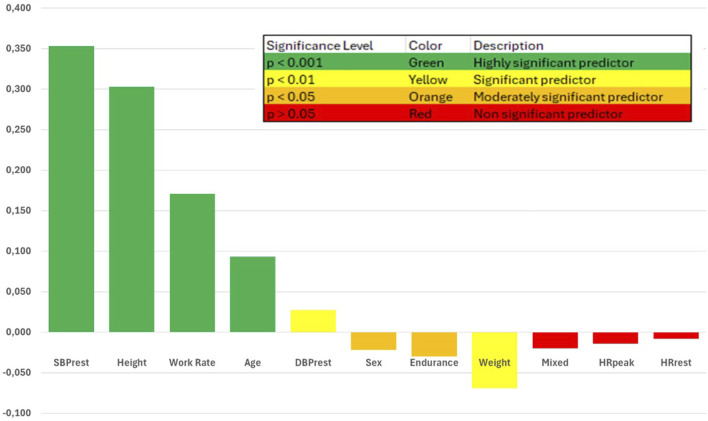
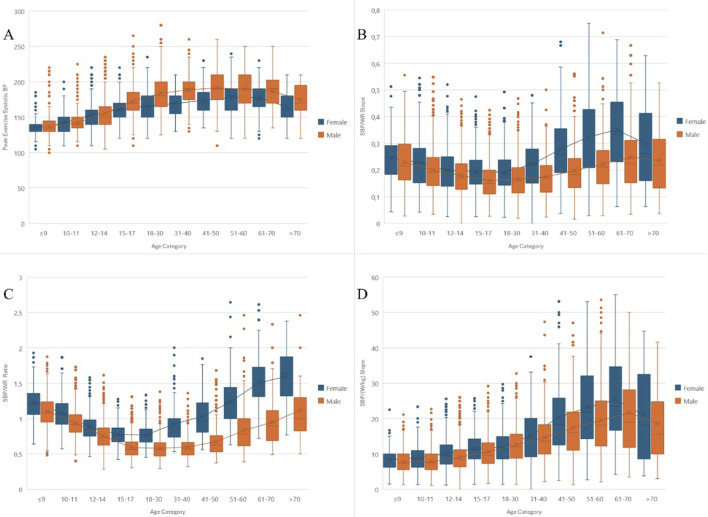
Results: The cohort included 12,083 athletes (median age 15 years, 26.9% female). Median peak exercise SBP was similar between sexes, but WR-indexed measures including SBP/WR ratio and SBP/(WR/kg) slope were higher in females (0.9 vs. 0.7, p < 0.001; 10.94 vs. 9.52, p < 0.001). Univariate analyses revealed significant associations between SBPpeak and several predictors, including sex, age, weight, height, SBPrest, DBPrest, HRrest, HRpeak, and WR (all p < .001). Multivariate analysis showed that SBPrest (beta = 0.353, 95% CI [0.541, 0.609], p < 0.001), height (beta = 0.303, 95% CI [0.360, 0.447], p < 0.001), WR (beta = 0.171, 95% CI [0.029, 0.045], p < 0.001), and age (beta = 0.093, 95% CI [0.162, 0.241], p < 0.001) were the strongest predictors of SBPpeak.

Conclusion: This study provides reference values for the interpretation of SBP responses to exercise in athletes. Multivariate analyses highlight the complex interplay of factors influencing peak SBP, including SBPrest, height, WR, age, DBPrest, sex, endurance sport category, and weight. In future studies, these findings may inform the development of personalised training strategies and risk stratification models in athletic populations.

Keywords: SBP/WR ratio; SBP/WR slope; athletes; blood pressure; exercise testing.


Conflict of interest statement

The authors declare that the research was conducted in the absence of any commercial or financial relationships that could be construed as a potential conflict of interest.

Figures

FIGURE 1
FIGURE 1
Participant Flow Diagram legend. This flow diagram illustrates the selection process and distribution of participants in the study. From an initial cohort of 13,670 athletes, 1,587 were excluded based on specific criteria. The remaining 12,083 eligible participants underwent either a stress test (n = 9,236) or a cardiopulmonary exercise test (n = 2,847). All 12,083 participants were included in the final analysis. This diagram provides a clear overview of the study population from initial recruitment to final data analysis.
FIGURE 2
FIGURE 2
Standardized Coefficients of Predictors of Peak Systolic Blood Pressure in Athletes. legend This figure displays the standardized coefficients (β) from a multivariate regression analysis examining the relationship between peak systolic blood pressure (SBPpeak) and several demographic and resting parameters in a cohort of athletes undergoing preparticipation testing. The standardized coefficients represent the relative strength and direction of each predictor’s association with SBPpeak, with larger absolute values indicating a stronger relationship. Green bars indicate highly significant positive predictors (p < .001), yellow bars indicate significant positive predictors (p < 0.01 and p < 0.05), and red bars indicate non-significant predictors (p > 0.05). Resting systolic blood pressure, height, workrate, and age were the strongest predictors of SBPpeak in this athlete cohort.
FIGURE 3
FIGURE 3
Comprehensive Analysis of Systolic Blood Pressure Responses Across Age and Sex in Athletes During Exercise. General Legend for All Panels: Each panel displays clustered box plots of raw or indexed systolic blood pressure (SBP) responses, categorized by age and sex. Within each box plot, the “X” marks the mean, while the median is represented by a line. Outliers are shown as individual dots. Linear trends connecting the means for both sexes across age categories illustrate changes in SBP response patterns. Specific Legends for Each Panel: Panel (A) Shows the peak exercise systolic blood pressure (SBPpeak) across different age groups, separated by sex, highlighting how cardiovascular responses vary during exercise. Panel (B) Illustrates the SBP/WR slope, indicating the rate of change in SBP relative to workload increases. It shows a steeper increase in SBP with increasing workload, particularly in females across all age groups. Panel (C) Focuses on the SBP/WR ratio, which quantifies the normalized systolic blood pressure response to workload. This panel points to higher values in females across all age groups, suggesting a more pronounced response. Panel (D) Presents the SBP/(W/kg) slope, showing SBP response per unit change in workload indexed to body weight. Differences are noted between sexes and across age categories, with a trend of increasing slope in older age groups.

Similar articles

References

    1. Albouaini K., Egred M., Alahmar A., Wright D. J. (2007). Cardiopulmonary exercise testing and its application. Postgrad. Med. J. List. 83 (985), 675–682. 10.1136/hrt.2007.121558 - DOI - PMC - PubMed
    1. Bauer P., Kraushaar L., Dörr O., Nef H., Hamm C. W., Most A. (2020). Workload-indexed blood pressure response to a maximum exercise test among professional indoor athletes. Eur. J. Prev. Cardiol. 7, 1487–1494. květen. 10.1177/2047487320922043 - DOI - PubMed
    1. Bauer P., Kraushaar L., Dörr O., Nef H., Hamm C. W., Most A. (2021). Sex differences in workload-indexed blood pressure response and vascular function among professional athletes and their utility for clinical exercise testing. Eur. J. Appl. Physiol. červenec 121 (7), 1859–1869. 10.1007/s00421-021-04656-x - DOI - PMC - PubMed
    1. Berge H. M., Isern C. B., Berge E. (2015). Blood pressure and hypertension in athletes: a systematic review. Br. J. Sports Med. 49 (11), 716–723. 10.1136/bjsports-2014-093976 - DOI - PubMed
    1. Biffi A., Gallo G., Fernando F., Sirico F., Signorello M. G., De Martino L., et al. (2022). Relationship between cardiorespiratory fitness, baseline blood pressure and hypertensive response to exercise in the ferrari corporate population. High. Blood Press Cardiovasc Prev. Off. J. Ital. Soc. Hypertens. leden 29 (1), 81–88. 10.1007/s40292-021-00491-5 - DOI - PubMed

LinkOut - more resources