. 2024 Dec 9:12:RP88671.
doi: 10.7554/eLife.88671.

Unified bursting strategies in ectopic and endogenous even-skipped expression patterns

Affiliations

Unified bursting strategies in ectopic and endogenous even-skipped expression patterns

Augusto Berrocal et al. Elife. .

Abstract

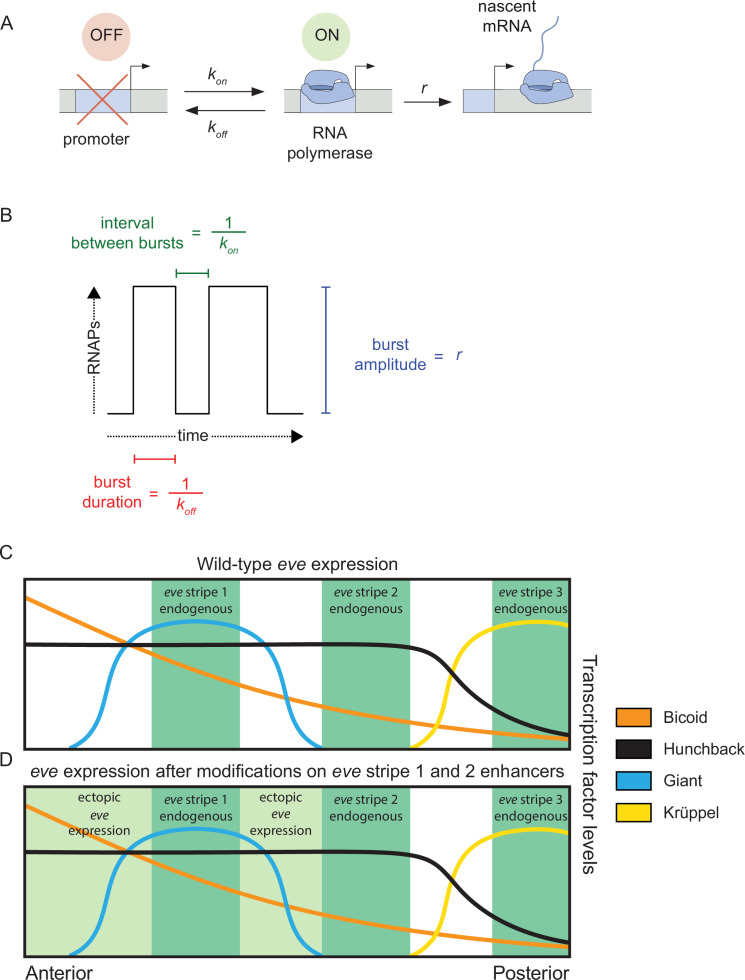
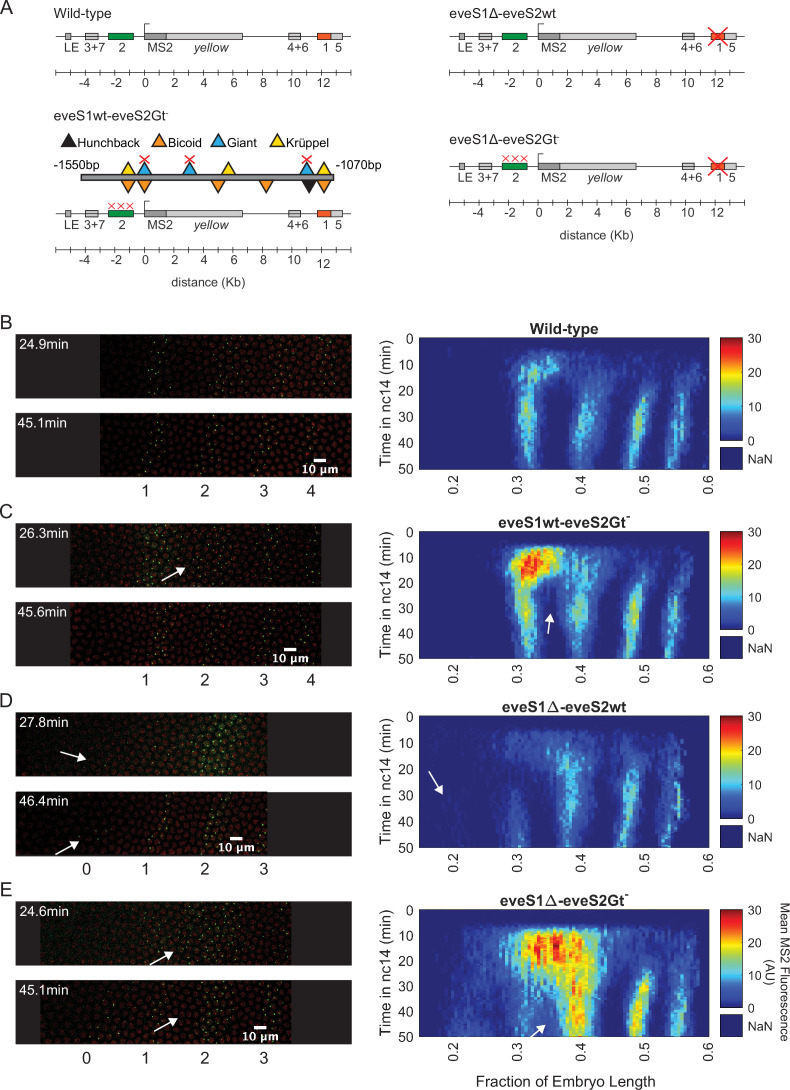
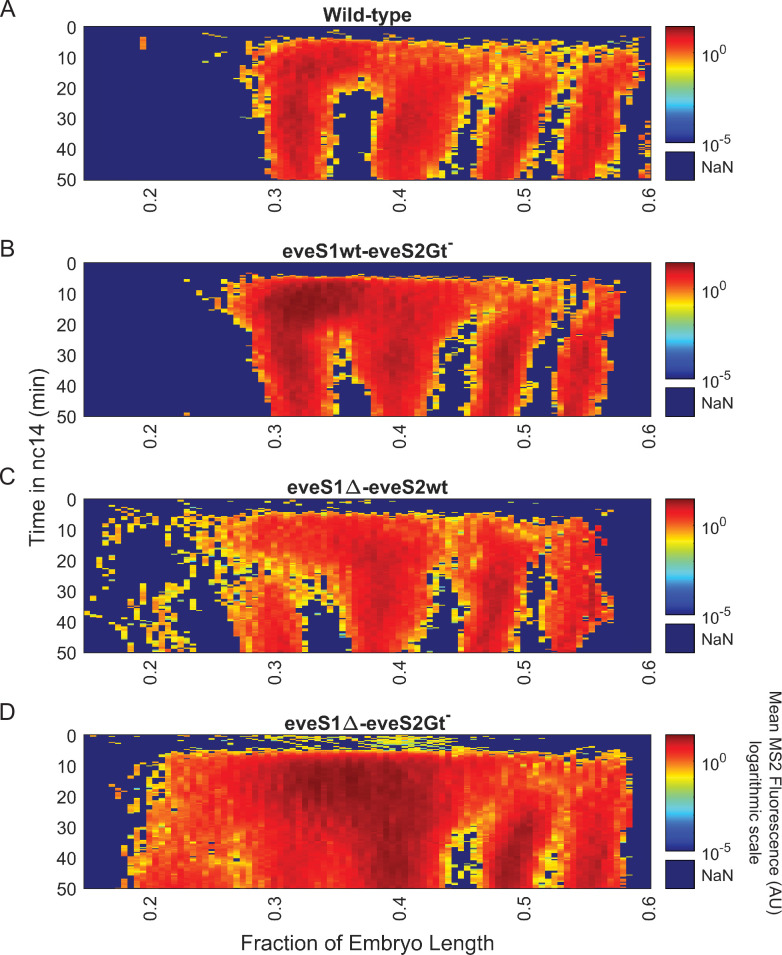
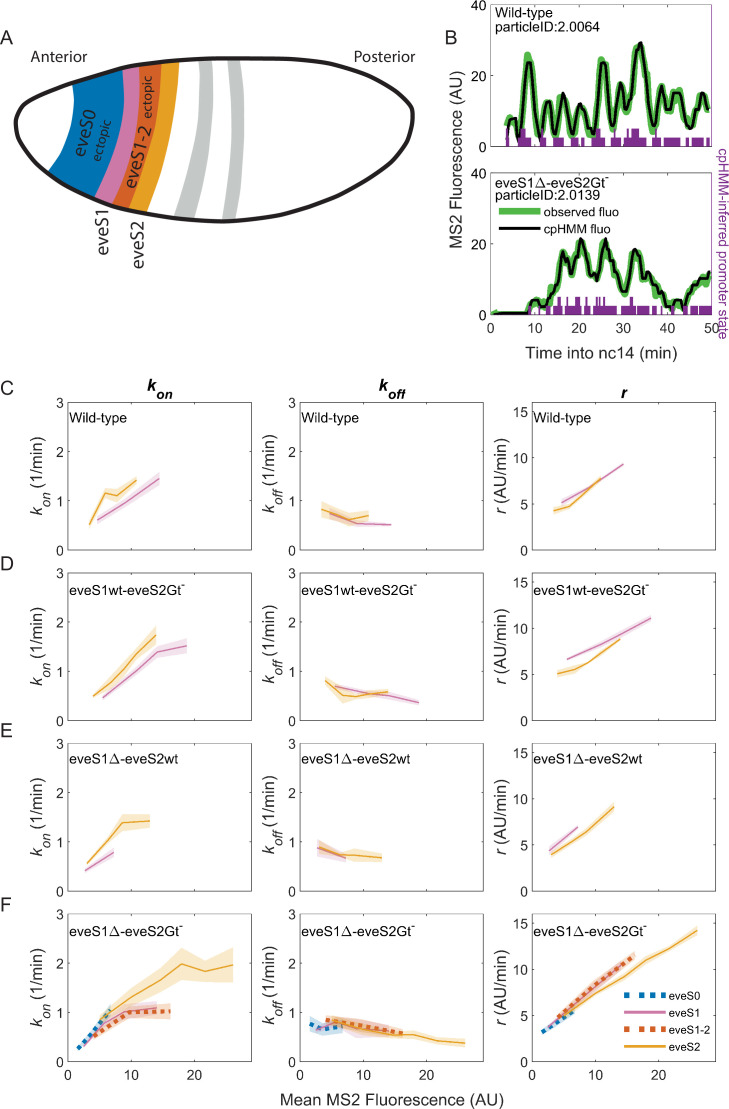
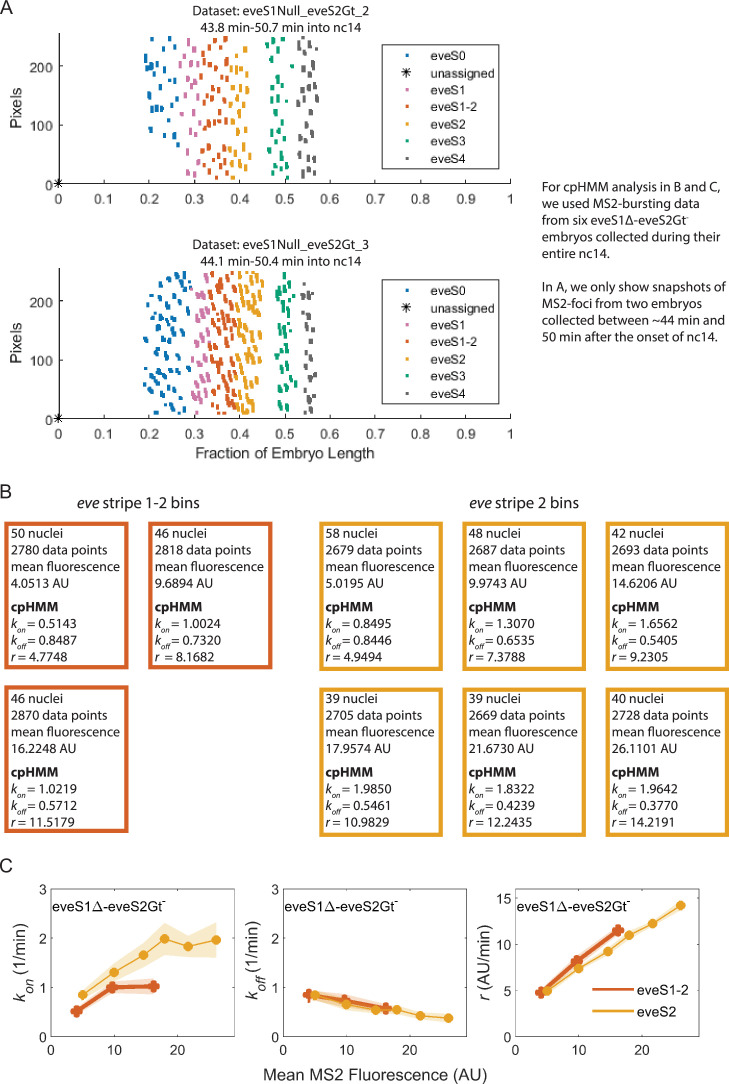
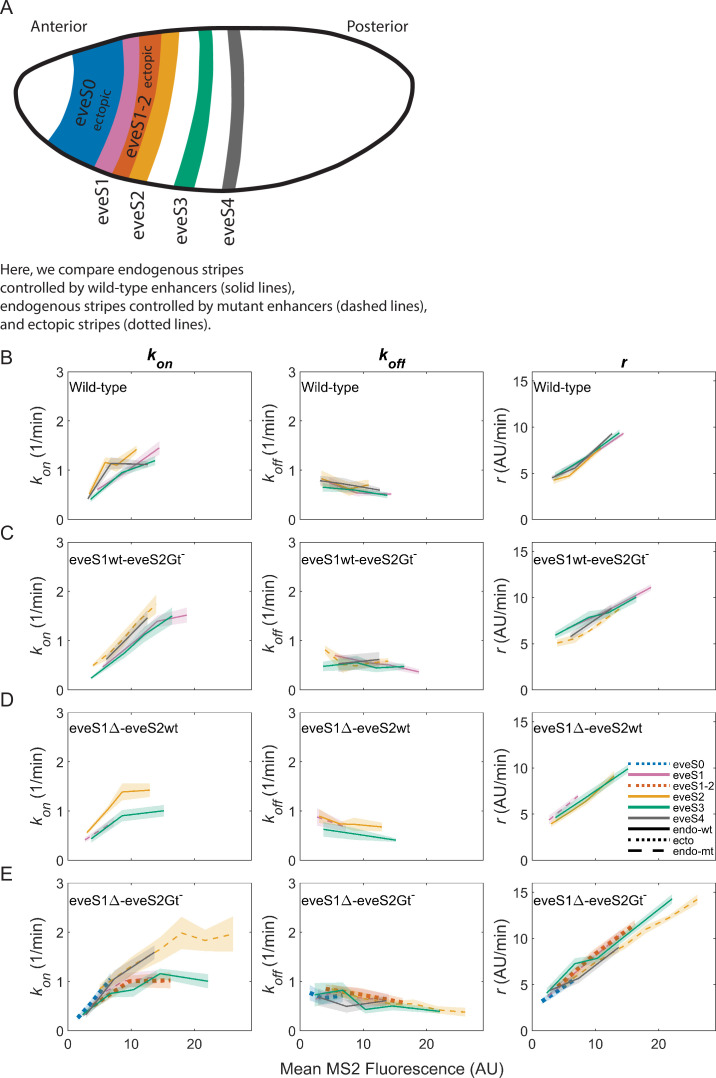
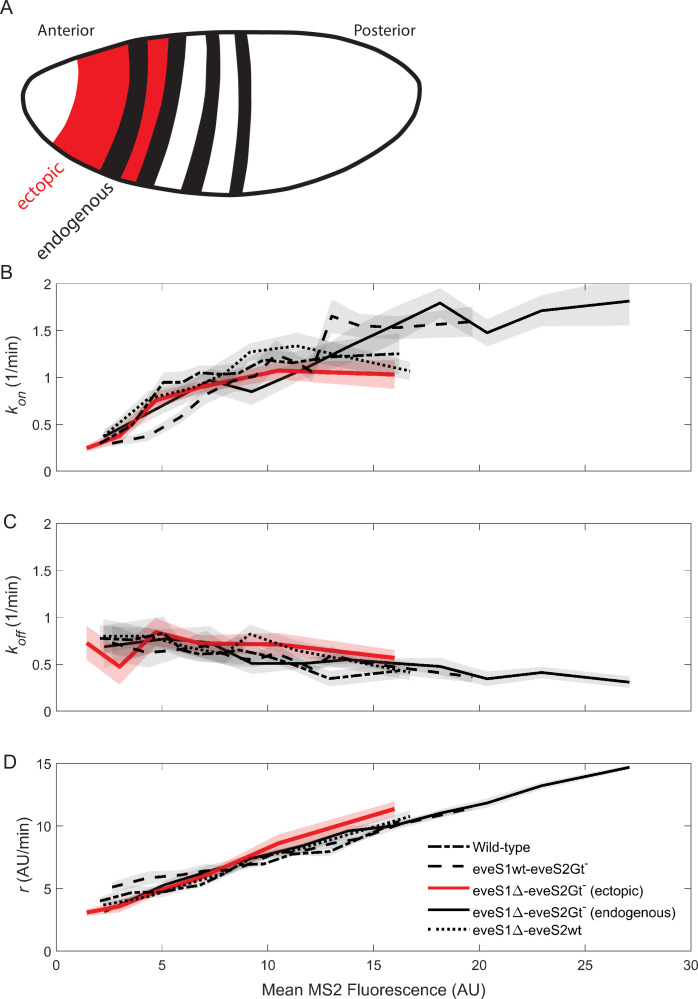
Transcription often occurs in bursts as gene promoters switch stochastically between active and inactive states. Enhancers can dictate transcriptional activity in animal development through the modulation of burst frequency, duration, or amplitude. Previous studies observed that different enhancers can achieve a wide range of transcriptional outputs through the same strategies of bursting control. For example, in Berrocal et al., 2020, we showed that despite responding to different transcription factors, all even-skipped enhancers increase transcription by upregulating burst frequency and amplitude while burst duration remains largely constant. These shared bursting strategies suggest that a unified molecular mechanism constraints how enhancers modulate transcriptional output. Alternatively, different enhancers could have converged on the same bursting control strategy because of natural selection favoring one of these particular strategies. To distinguish between these two scenarios, we compared transcriptional bursting between endogenous and ectopic gene expression patterns. Because enhancers act under different regulatory inputs in ectopic patterns, dissimilar bursting control strategies between endogenous and ectopic patterns would suggest that enhancers adapted their bursting strategies to their trans-regulatory environment. Here, we generated ectopic even-skipped transcription patterns in fruit fly embryos and discovered that bursting strategies remain consistent in endogenous and ectopic even-skipped expression. These results provide evidence for a unified molecular mechanism shaping even-skipped bursting strategies and serve as a starting point to uncover the realm of strategies employed by other enhancers.

Keywords: D. melanogaster; chromosomes; development; developmental biology; enhancers; gene expression; imaging; patterning; transcription.


Conflict of interest statement

AB, NL, HG No competing interests declared, ME Michael B Eisen is former Editor-in-Chief of eLife

Figures

Figure 1.
Figure 1.. Promoter activity in endogenous and ectopic regions of eve expression.
(A) According to the two-state model of promoter activity a gene promoter switches from the OFF (inactive) state to the ON (active) state at a rate kon. When ON, the promoter loads RNA Pol II molecules and synthesizes mRNA at a rate r. The promoter stochastically switches back to the OFF state at a rate koff. (B) The kon, koff, and r parameters define the average interval between bursts, average burst duration, and average burst amplitude, respectively. (C) eve stripes result from the interplay of various activators and repressors, for instance, wild-type eve stripe 2 is expressed through the interplay of the activators Bicoid and Hunchback with the repressors Giant and Krüppel. The latter define the anterior and posterior boundaries of eve stripe 2, respectively. (D) Here, we coupled the disruption of the eve stripe 1 enhancer with the disruption of the anterior repression of eve stripe 2 exerted by the gap repressor Giant to drive ectopic eve expression anteriorly and compare bursting parameters between endogenous and ectopic expression patterns. (C and D) are based on Levine, 2013 and Peel et al., 2005.
Figure 2.
Figure 2.. Transcriptional dynamics of eveMS2-BAC variants.
(A) eveMS2 reporter construct variants used in this work. Boxes represent enhancers (e.g. eve stripe 2 enhancer is labeled as 2). LE is the eve late element. eveMS2-BAC is a reporter of wild-type eve expression. The eveS1wt-eveS2Gt- carries a deletion of three Giant binding sites within the eve stripe 2 minimal regulatory element (eveS2-MRE; Small et al., 1992), as indicated by the three red crosses over the eve stripe 2 enhancer, and as shown in the detail of eveS2-MRE; where triangles represent transcription factor-binding sites. The eveS1∆-eveS2wt carries a deletion of the eve stripe 1 enhancer. Finally, eveS1∆-eveS2Gt- combines the Giant binding site deletions from eveS1wt-eveS2Gt- with the eve stripe 1 enhancer deletion of eveS1∆-eveS2wt. (B) Left. Stills from a representative wild-type embryo at ~25 min and ~45 min into nuclear cycle 14 (nc14). Nuclei are labeled in red and transcription sites are labeled in green. Right. Kymograph of eve expression averaged over 5 eveMS2-BAC (wild-type) embryos. Time resolution along the y-axis is 20 seconds. The position of nuclei along the x-axis was calculated from various datasets, based on the inferred position of stripe centers, as described in the SI section: Generation of heatmaps in Figure 2 and Figure 2—figure supplement 1 in Materials and methods. MS2 fluorescence in arbitrary units (AU) along the x-axis was averaged from nuclei located within bins of 0.5% embryo length. (C) Left. eveS1wt-eveS2Gt- embryo at ~25 min and ~45 min into nc14. Right. Average eve-MS2 fluorescence from 6 eveS1wt-eveS2Gt- embryos. At ~25 min, some transcriptionally active nuclei in the inter-stripe region between eve stripe 1 and eve stripe 2 can still be detected (white arrows), while, in wild-type embryos, eve stripe 1 and 2 are completely separated by ~20 min into nc14. (D) Left. eveS1∆-eveS2wt embryo at ~25 min and ~45 min into nc14. Right. Average eve-MS2 fluorescence from 5 eveS1∆-eveS2wt embryos. eve stripe 1 is almost absent at ~25 min, but appears later, probably driven by activity of the eve late element. A dim eve stripe 0 is apparent (white arrows). (E) Left. eveS1∆-eveS2Gt- embryo at ~25 min and ~45 min into nc14. Right. Average eve-MS2 fluorescence from 6 eveS1∆-eveS2Gt- embryos. At ~25 min, there is a strong ectopic expression in the inter-stripe region between eve stripe 1 and eve stripe 2 (white arrow). At ~45 min, this ectopic inter-stripe expression has dimmed (white arrows), while eve stripe 0 becomes apparent.
Figure 2—figure supplement 1.
Figure 2—figure supplement 1.. Spatiotemporal dynamics of eve expression across wild-type and mutant embryos in logarithmic scale.
Heatmaps in Figure 2(B, C, D and E) rescaled to logarithmic values. (A) Kymograph of average eve-MS2 fluorescence drawn from 5 eveMS2-BAC (wild-type) embryos. (B) Average eve-MS2 fluorescence from 6 eveS1wt-eveS2Gt- embryos. Inter-stripe transcription between eve stripe 1 and eve stripe 2 lasts for longer than in wild-type embryos. (C) Average eve-MS2 fluorescence from 5 eveS1∆-eveS2wt embryos. Mild expression of eve stripe 1 (0.3 fraction of embryo length) and eve stripe 0 (0.2 fraction of embryo length) is more apparent on this logarithmic scale. (D) Average eve-MS2 fluorescence from 6 eveS1∆-eveS2Gt- embryos. An almost continuous area of eve expression expands from eve stripe 2 (0.4 fraction of embryo length) to eve stripe 0 (0.2 fraction of embryo length).
Figure 3.
Figure 3.. Bursting parameter control is almost identical in endogenous and ectopic gene expression regions.
kon (left panels), koff,(middle panels) and r (right panels) trends across stripes, estimated from nuclei binned by their mean MS2 fluorescence. (A) Position and color code of endogenous and ectopic stripes in the fruit fly embryo. Only eve stripe 0, 1, 1–2, and 2 are shown for clarity. Figure 3—figure supplement 2 includes eve stripe 3, and 4. (B) MS2 fluorescent traces (green) from embryos of different genotypes and cpHMM fit (black). Transcription in Drosophila embryos occurs after DNA replication. Since replicated sister chromatids remain paired, each eve locus contains two promoters, and every one of them can be ON or OFF. Purple bars show cpHMM-inferred promoter state corresponding to the two sister chromatids within a transcription spot (Lammers et al., 2020). Absence of bars represents both sister promoters OFF; shorter bars represent 1 sister promoter ON; longer bars represent 2 sister promoters ON. We aggregated the active state of 1 and 2 sister promoters into a single ON state, which leads to an effective two-state model of promoter activity (see SI section: Inference of Bursting Parameters in Materials and methods). Each point in the plots below was computed from ~40 fluorescent traces. (C) As previously observed in eve-MS2 wild-type embryos (Berrocal et al., 2020), nuclei in all stripes follow the same trends in bursting parameters. kon, the average rate at which the promoter switches from OFF to ON increases with increasing transcriptional initiation as reported by MS2 fluorescence. koff, the average rate at which a promoter switches from ON to OFF remains largely constant, and has a slight decrease in nuclei with the highest MS2 fluorescence values. r, the average rate at which active promoters increase their fluorescence, is higher in brighter nuclei. All stripes from (D) eveS1wt-eveS2Gt- and (E) eveS1∆-eveS2wt share the same bursting strategy. (F) The same trends occur in endogenous (eveS1 and eveS2; solid lines) and ectopic stripes (eveS0 and eveS1-2; dotted lines) of eveS1∆-eveS2Gt- embryos.
Figure 3—figure supplement 1.
Figure 3—figure supplement 1.. Pipeline for the quantification of eve bursting parameters (kon, koff, r) in nuclei grouped by stripe and binned by mean MS2 fluorescence (Figure 3).
(A) Nuclei in embryos of the same genotype were assigned to a stripe as described in the main text. Here, as an illustrative example, we will follow the analysis of inter stripe 1–2 (vermillion) and eve stripe 2 (yellow) in eveS1∆-eveS2Gt- embryos. (B) Nuclei in eve interstripe 1–2 were sorted in three bins of 46–50 nuclei and ~2,800 data points according to their mean MS2 fluorescence (4.05, 9.68, and 16.22 AU). Nuclei in eve stripe 2 were sorted in six bins of 39–58 nuclei and ~2,700 data points according to their mean MS2 fluorescence (5.01, 9.97, 14.62, 17.95, 21.67, and 26.11 AU). Bursting parameters (kon, koff, and r) were calculated for each bin using the cpHMM by Lammers et al., 2020. This analysis was performed with data from six eveS1∆-eveS2Gt- embryos. (C) Our analysis makes it possible to plot bursting parameters (y-axis) against the mean MS2 fluorescence (x-axis) of each bin.
Figure 3—figure supplement 2.
Figure 3—figure supplement 2.. Bursting parameter inference for all stripes recorded in our data.
We followed the analysis pipeline described in Figure 3—figure supplement 1. kon (left panels), koff (middle panels), and r (right panels) trends are similar in all endogenous and ectopic stripes in our dataset. (A) Position and color code of endogenous and ectopic stripes on a fruit fly embryo. (B) As previously observed in eve-MS2 wild-type embryos (Berrocal et al., 2020), nuclei in all stripes follow the same trends in bursting parameters. All stripes in wild-type embryos are endogenous and are controlled by wild-type enhancers. (C) The same trend is observed in all endogenous stripes from eveS1wt-eveS2Gt-, regardless of whether they are controlled by wild-type enhancers (eveS1, eveS3, eveS4); or by mutant enhancers (eveS2). (D) Endogenous stripes from eveS1∆-eveS2wt embryos controlled by wild-type (eveS2, eveS3, eveS4) and mutant (eveS1) enhancers display the same trend. (E) All endogenous stripes controlled by wild-type (eveS3, eveS4) and mutant (eveS1, eveS2) enhancers, and ectopic stripes (eveS0, eveS1-2) from eveS1∆-eveS2Gt- embryos share the same bursting strategy.
Figure 3—figure supplement 3.
Figure 3—figure supplement 3.. Comparison of bursting parameters between endogenous and ectopic eve expression regions.
We followed the cpHMM-based analysis pipeline (as described in Figure 3—figure supplement 1) on nuclei grouped in two categories: endogenous (eveS1, eveS2, eveS3, and eveS4) and ectopic (eveS0 and eveS1-2); instead of grouping nuclei by stripes. kon, koff, and r parameters of ectopic (red) and endogenous (black) regions, estimated from nuclei binned by their mean MS2 fluorescence. Ectopic regions (red solid line) from eveS1∆-eveS2Gt- embryos follow the same bursting strategies as the endogenous regions from all other genotypes: wild-type (black dash-dot line), eveS1∆-eveS2Gt- (black solid line), eveS1wt-eveS2Gt- (black dashed line), eveS1∆-eveS2wt (black dotted line). (A) Regions where data points were analyzed together under the category endogenous (black) or ectopic (red). (B) Average kon values increase in brighter eve-active nuclei. (C) Average koff values remain constant and have a slight decrease in highly eve-active nuclei. (D) Average r values increase in brighter eve-active nuclei.

Update of

Similar articles

Cited by

References

    1. Akam ME. The location of Ultrabithorax transcripts in Drosophila tissue sections. The EMBO Journal. 1983;2:2075–2084. doi: 10.1002/j.1460-2075.1983.tb01703.x. - DOI - PMC - PubMed
    1. Banerji J, Rusconi S, Schaffner W. Expression of a beta-globin gene is enhanced by remote SV40 DNA sequences. Cell. 1981;27:299–308. doi: 10.1016/0092-8674(81)90413-x. - DOI - PubMed
    1. Banerji J, Olson L, Schaffner W. A lymphocyte-specific cellular enhancer is located downstream of the joining region in immunoglobulin heavy chain genes. Cell. 1983;33:729–740. doi: 10.1016/0092-8674(83)90015-6. - DOI - PubMed
    1. Berrocal A, Lammers NC, Garcia HG, Eisen MB. Kinetic sculpting of the seven stripes of the gene. eLife. 2020;9:e1635. doi: 10.7554/eLife.61635. - DOI - PMC - PubMed
    1. Berrocal A, Lammers NC, Garcia HG, Eisen MB. Unified bursting strategies in ectopic and endogenous even-skipped expression patterns - supplemental data. Zenodo. 2023 doi: 10.5281/zenodo.7204096. - DOI - PMC - PubMed

MeSH terms

Associated data

LinkOut - more resources