. 2025 Jan 6;224(1):e202312043.
doi: 10.1083/jcb.202312043. Epub 2024 Dec 9.

Astrocyte-dependent local neurite pruning in Beat-Va neurons

Affiliations

Astrocyte-dependent local neurite pruning in Beat-Va neurons

Katherine S Lehmann et al. J Cell Biol. .

Abstract

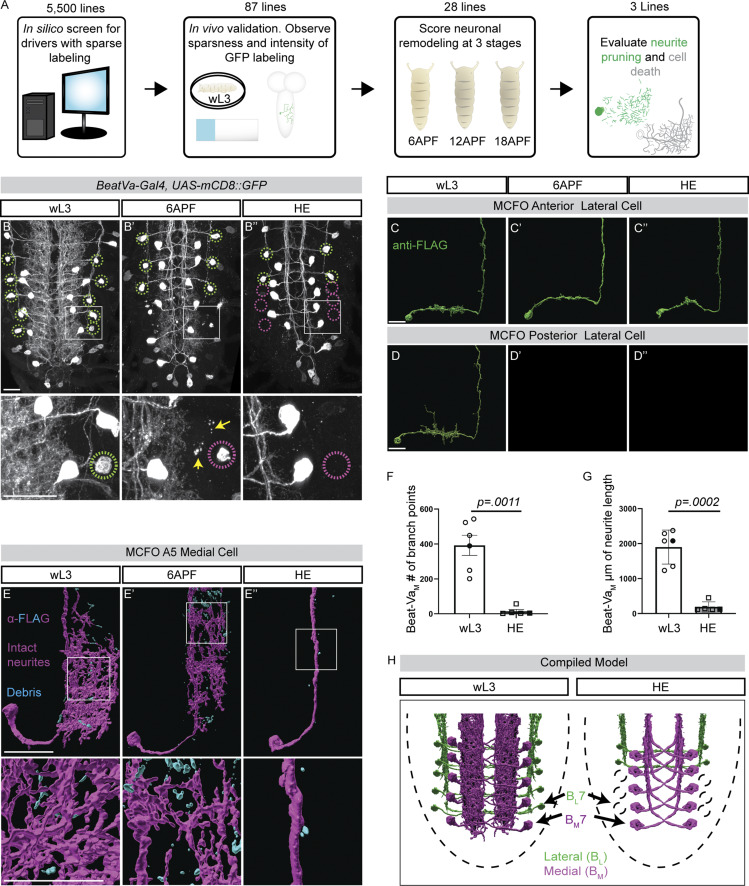
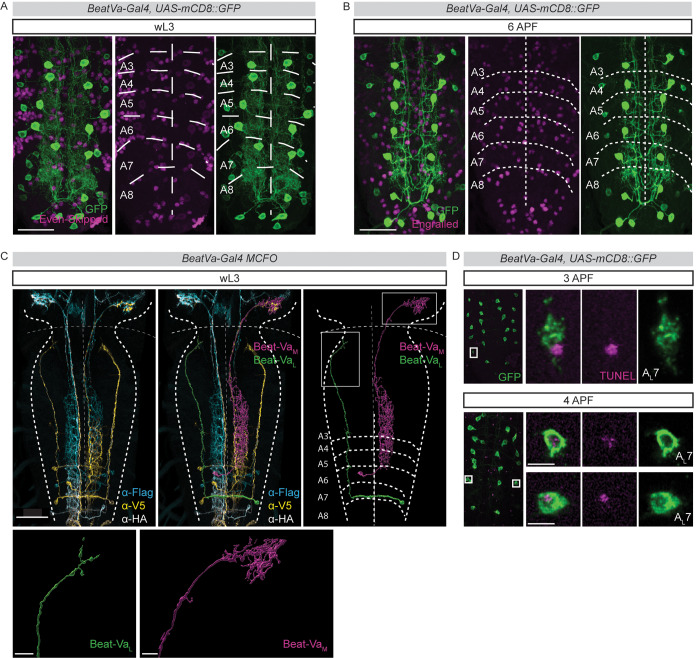
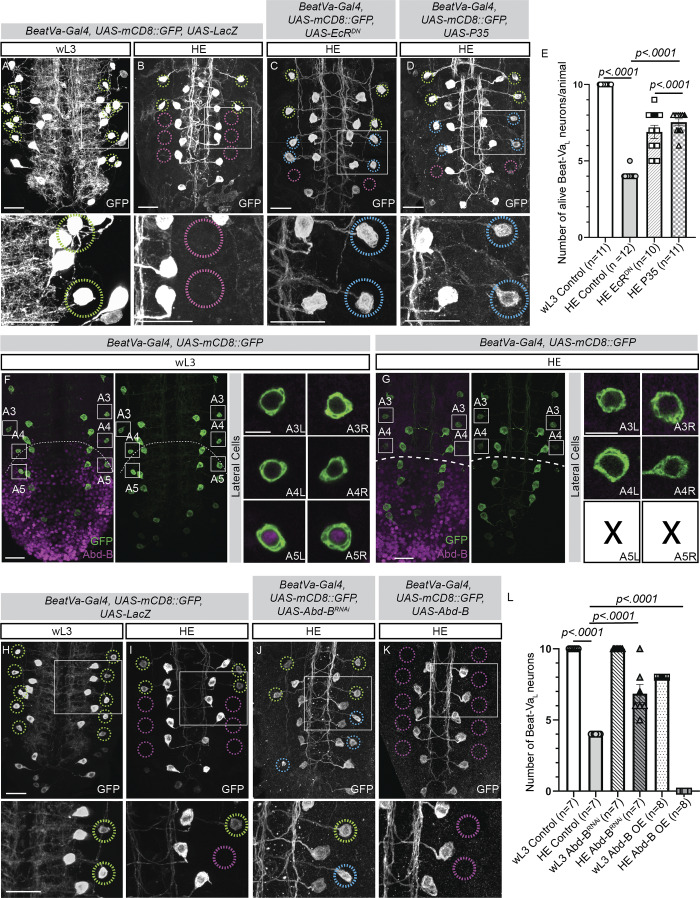
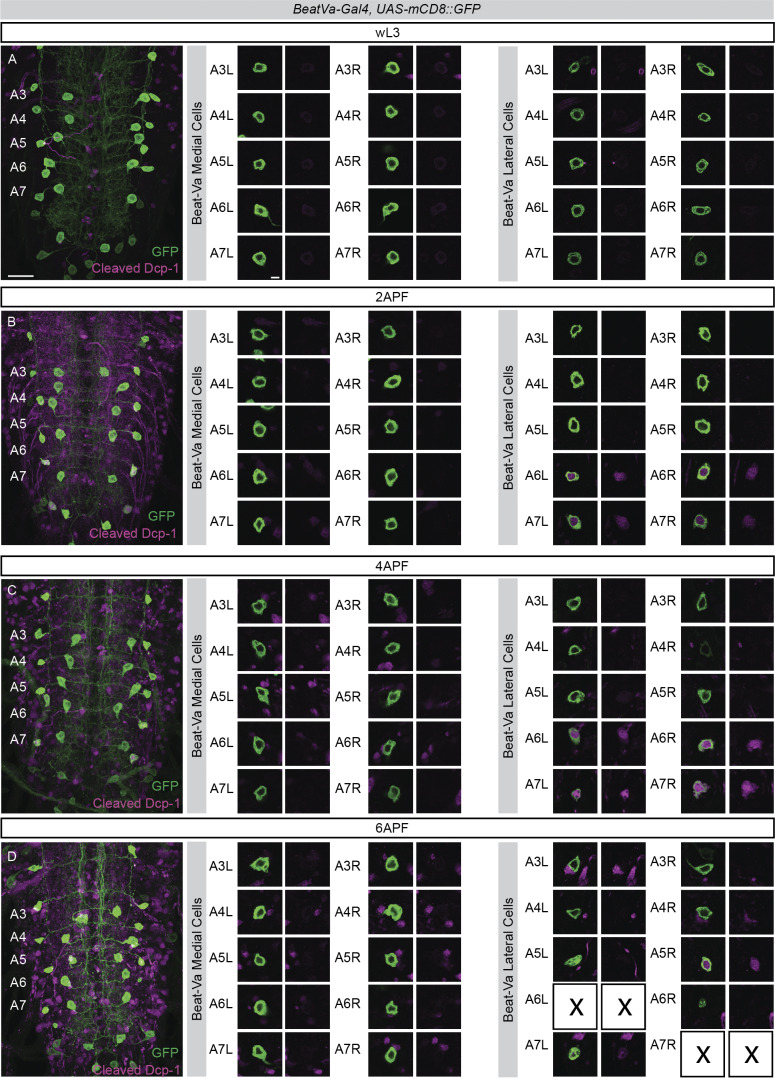
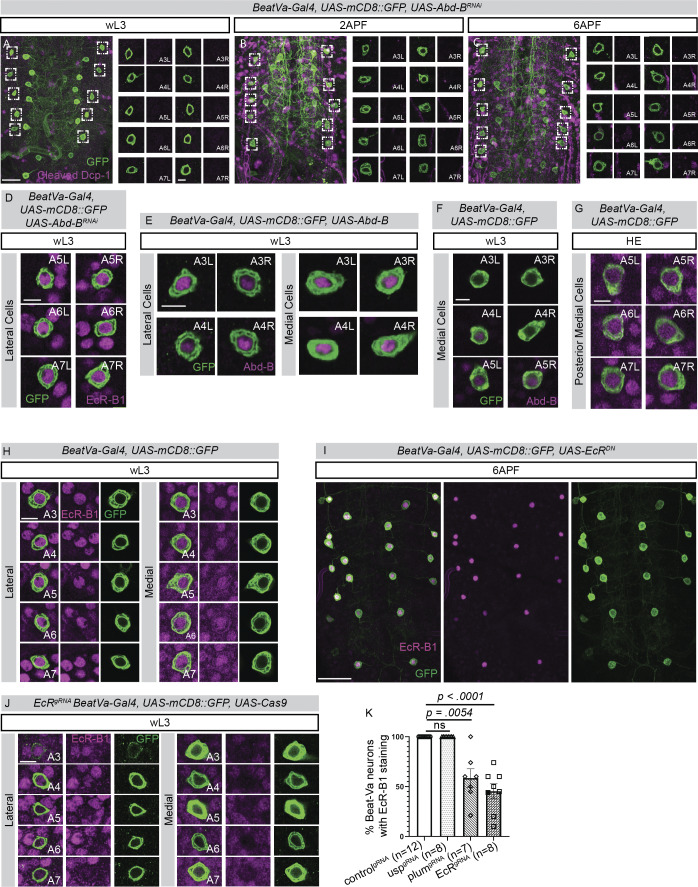
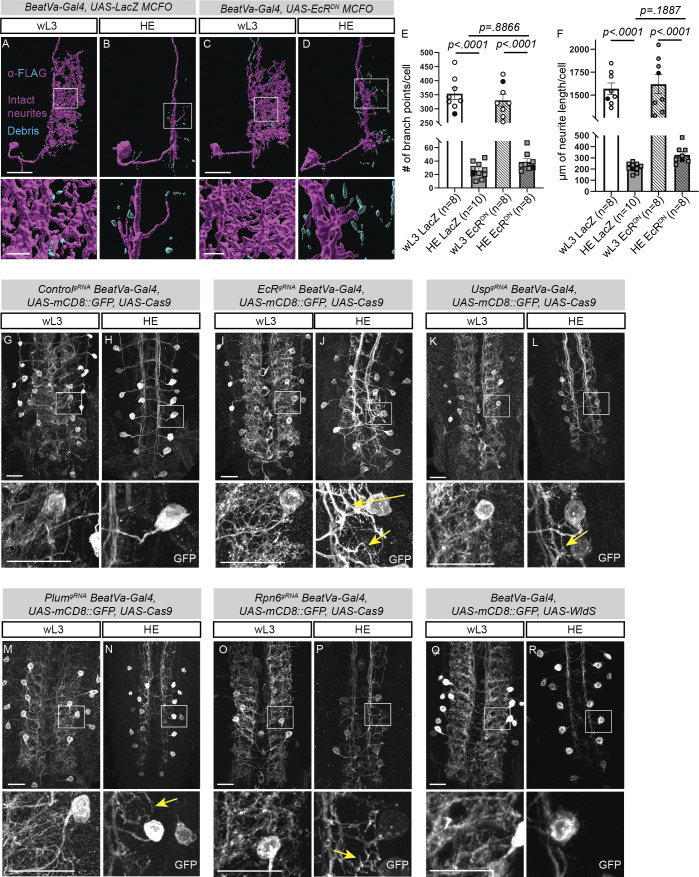
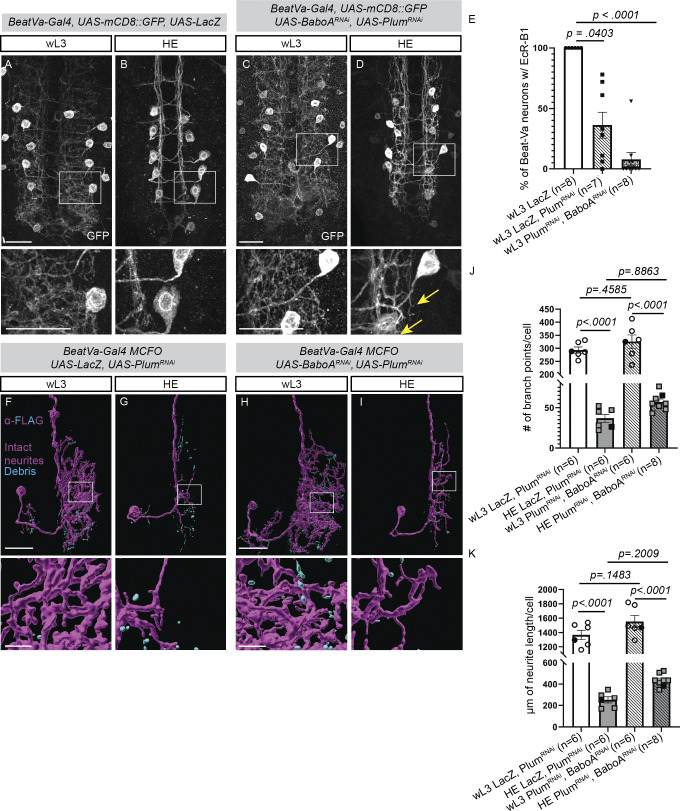
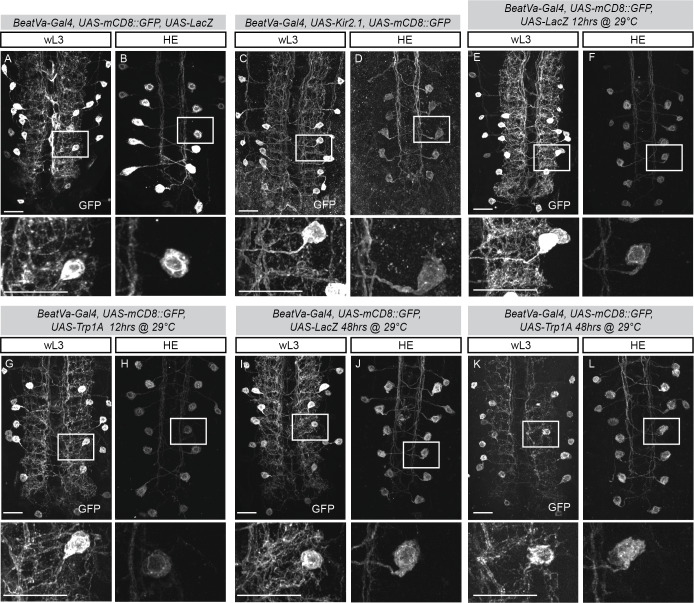
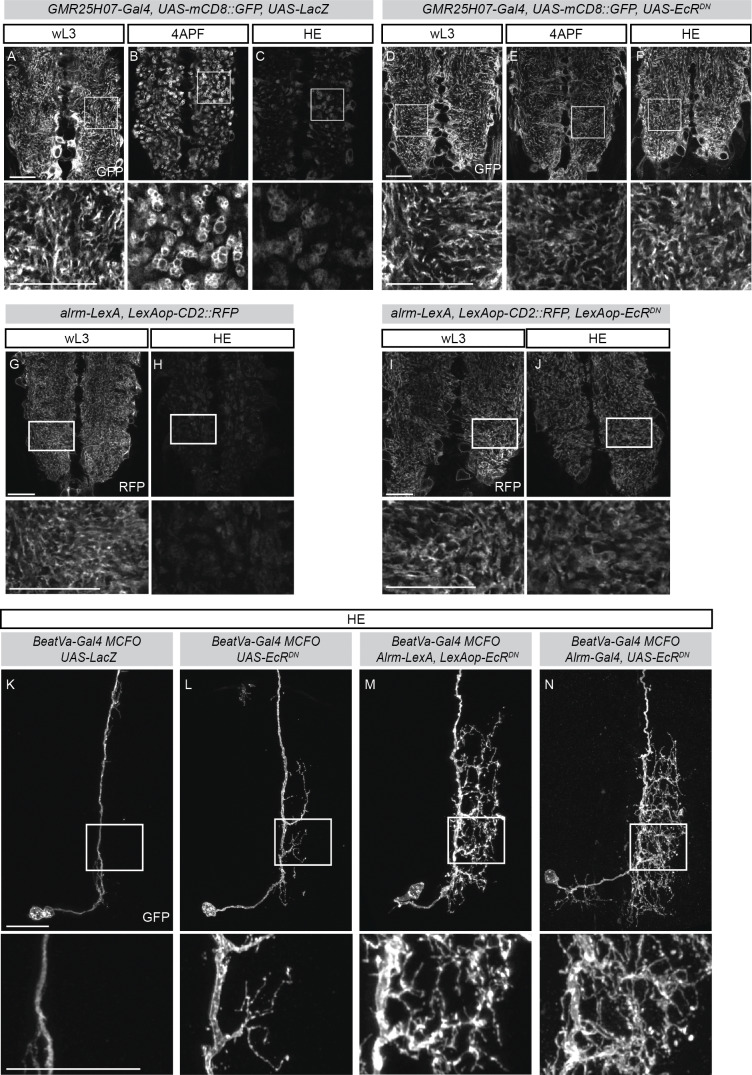
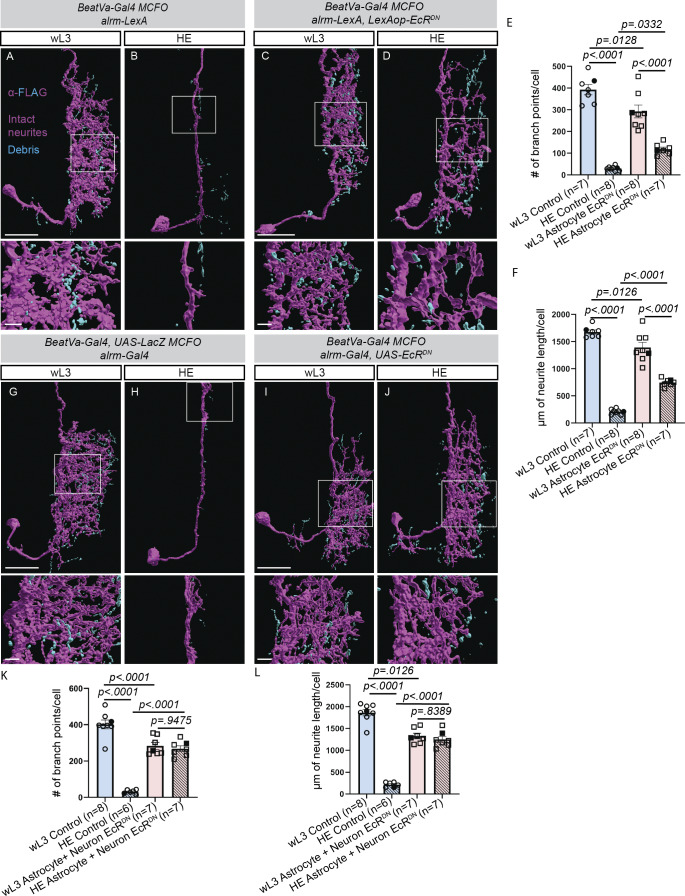
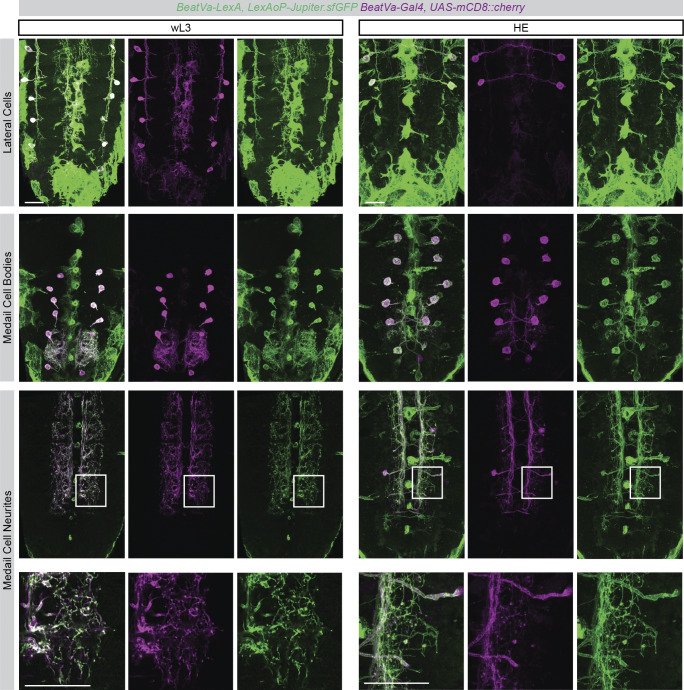
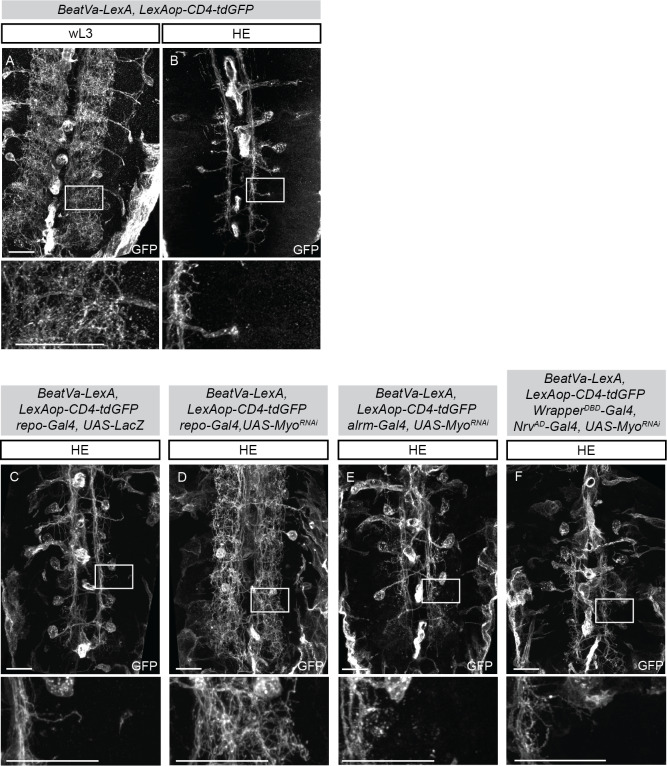
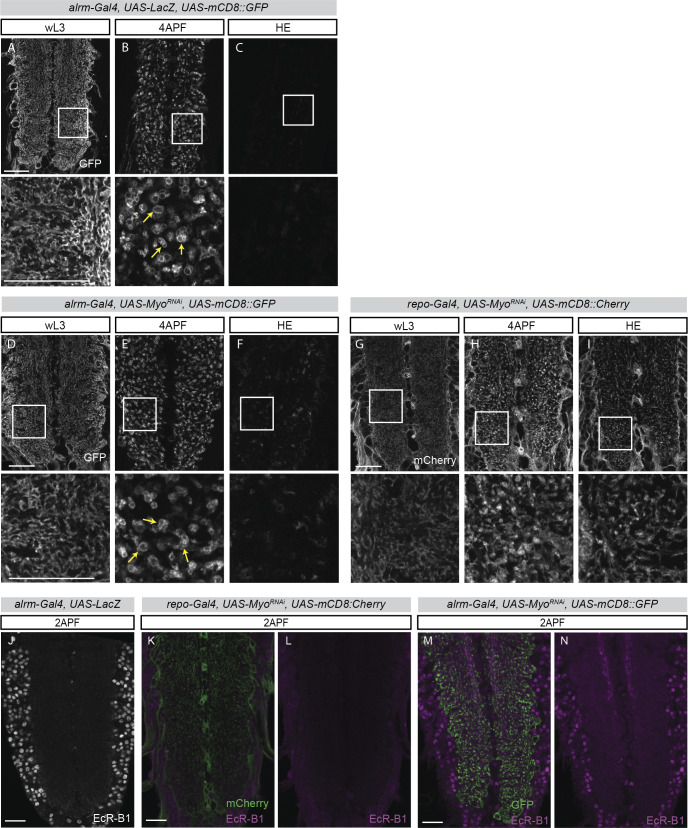
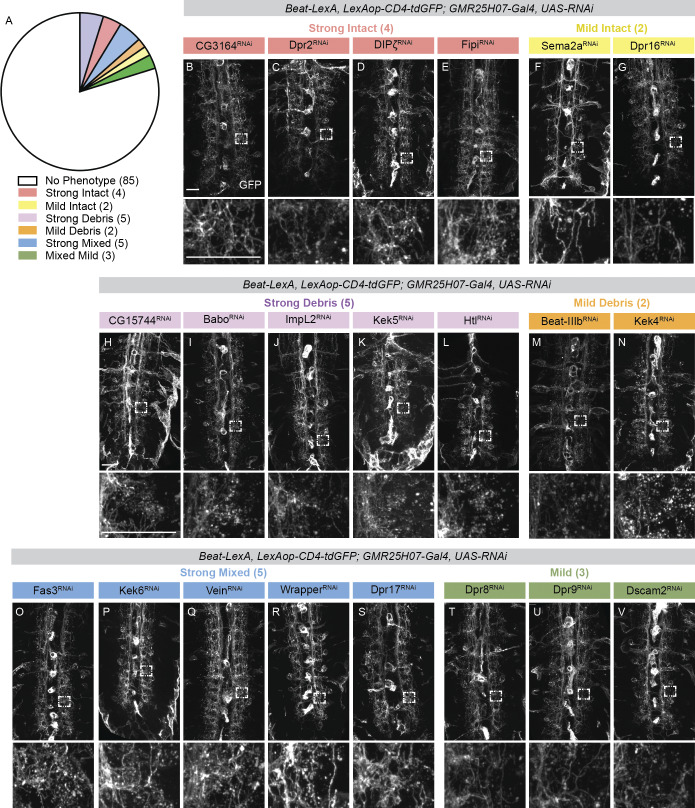
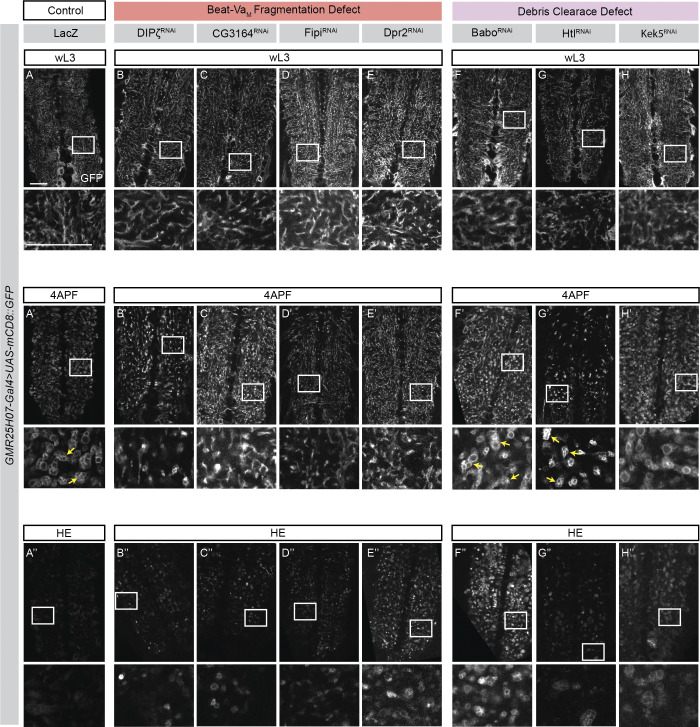
Developmental neuronal remodeling is extensive and mechanistically diverse across the nervous system. We sought to identify Drosophila pupal neurons that underwent mechanistically new types of neuronal remodeling and describe remodeling Beat-VaM and Beat-VaL neurons. We show that Beat-VaM neurons produce highly branched neurites in the CNS during larval stages that undergo extensive local pruning. Surprisingly, although the ecdysone receptor (EcR) is essential for pruning in all other cell types studied, Beat-VaM neurons remodel their branches extensively despite cell autonomous blockade EcR or caspase signaling. Proper execution of local remodeling in Beat-VaM neurons instead depends on extrinsic signaling from astrocytes converging with intrinsic and less dominant EcR-regulated mechanisms. In contrast, Beat-VaL neurons undergo steroid hormone-dependent, apoptotic cell death, which we show relies on the segment-specific expression of the Hox gene Abd-B. Our work provides new cell types in which to study neuronal remodeling, highlights an important role for astrocytes in activating local pruning in Drosophila independent of steroid signaling, and defines a Hox gene-mediated mechanism for segment-specific cell elimination.


Conflict of interest statement

Disclosures: The authors declare no competing interests exist.

Figures

Figure 1.
Figure 1.
Beat-Va neurons undergo local neurite pruning or cell death. (A) Gal4 lines generated by Janelia were screened in silico, 87 drivers that label sparse populations were verified for consistency and driver strength and 28 of those were chosen for further evaluation at 6 h APF, 12 h APF (HE), and 18 h APF. (B–B″) Z-projection of ventral nerve cords labeled by BeatVa-Gal4 driving an UAS-mCD8::GFP transgene at wL3 (B), 6 h APF (B′), and HE (B″). Surviving lateral neurons are noted by green circles, and dead or dying lateral neurons are pink. Yellow arrows denote neurite debris. (C–C″) Surface rendering of single-cell morphology of the anterior Beat-Va lateral cell (Beat-VaL) at wL3 (C), 6 h APF (C′), and (C″) HE. (D–D″) Surface rendering of posterior lateral cells at wL3 (D), 6 h APF (D′), and HE (D″). (E–E″) Surface rendering of Beat-Va medial cells (Beat-VaM) at wL3 (E), 6APF (E′), and HE (E″). Intact neurites in magenta and fragmented neurites in cyan. (F) Quantification of the number of branch points in Beat-VaM cells. Error bars are SEM. (G) Quantification of the total combined length of all filaments in Beat-VaM cells. Error bars are SEM. (H) Composite model of both Beat-VaL and Beat-VaM neurons. (F and G) Each data point represents one cell. wL3 cells were imaged from five animals. HE cells were imaged from three animals. Comparisons by Student’s t test. Scale bar is 20 µm. The boxed region is magnified below each panel. Colored data points correspond to the representative image shown in the figure.
Figure S1.
Figure S1.
Segmental characterization of Beat-Va M and Beat-Va L neurons. (A) VNC at wL3 with genetic mCD8::GFP labeling of Beat-Va neurons (green) and anti-Even-Skipped staining (magenta) to label the segments of the ventral nerve cord. Segments A3–A8 are denoted by tracing the Even-Skipped staining and then superimposed onto Beat-Va neurons to define segmental positions. Scale bar is 20 µm. (B) VNC at 6 h APF with genetic GFP labeling of Beat-Va neurons (green) and anti-Engrailed staining (magenta) to label the segments of the VNC, showing the segmental positions persist into metamorphosis. Scale bars are 20 µm. (C) Using segmental information and MCFO we can render single cells in Imaris and overlay positional information. Boxed areas are Beat-VaL and Beat-VaM termini and are displayed in high magnification (scale bars are 10 µm). CNS is outlined and boundary between VNC and brain lobes is marked with a dashed line. (D) Z-projection of ventral nerve cords with Beat-Va neurons labeled genetically with mCD8::GFP (green) and then subjected to TUNEL staining (magenta) to detect cells undergoing apoptotic cell death at 3 h APF and 4 h APF. Boxed areas containing TUNEL-positive lateral cells are magnified and segmental position is noted. Scale bar is 5 µm.
Figure 2.
Figure 2.
Beat-Va L neurons undergo hormone-dependent, caspase-activated, Hox gene–mediated apoptosis. (A and B) Beat-Va neurons at wL3 (A) and HE (B) were genetically labeled with mCD8::GFP expressing UAS-LacZ (control). (C and D) Beat-Va neurons at HE expressing mCD8::GFP with EcRDN (C) or UAS-P35 (D). Lime green circles indicate normal lateral cells before remodeling. Pink circles indicate the position of dead lateral cells. Blue circles indicate lateral cells surviving beyond the normal time point. Scale bars, 20 µm. (E) Quantification of the number of lateral cells at wL3, or HE in controls, or animals expressing EcRDN or P35. Two-way ANOVA, Sidak multiple comparison test. N = number of animals. (F and G) Beat-Va neurons at (F) wL3 or (G) HE labeled with mCD8::GFP stained with Abdominal-B antibody (magenta). White dashed line denotes the boundary of the Abd-B expression. (H and I) Beat-Va neurons at wL3 (H) or HE (I) genetically labeled with mCD8::GFP crossed to UAS-LacZ as a control. Green circles indicate Beat-VaL neurons. Magenta circles, the position of dead cells. (J) Expression of UAS-Abd-BRNAi in Beat-Va neurons. Blue circles, cells that survive ectopically. (K) Expression of Abd-B in all lateral cells by HE leads to cell death. (L) Quantification of E–H. Two-way ANOVA, Sidak test for multiple comparisons. n = number of animals. (A–G) Scale bars are 20 µm in population images and 5 µm in the magnified view. (H–K) Scale bars are 20 µm. Colored data points correspond to the representative image shown in the figure. All error bars are SEM.
Figure S2.
Figure S2.
Beat-Va L but not Beat-Va M neurons display caspase activation during metamorphosis. (A–D) Beat-Va neurons genetically labeled with mCD8::GFP and stained for cleaved Dcp-1 at wL3 (A), 2 h APF (B), 4 h APF (C), or 6 h APF (D). Right, A3–A7 lateral and medial cells from each hemisegment (L = left and R = right hemisegment) are magnified and shown as a single plane image on the right of each full VNC image. Scale bars are 20 µm in population images and 5 µm in the magnified view.
Figure S3.
Figure S3.
Abd-B and EcR signaling drive Beat-Va L cell death but not Beat-Va M remodeling. (A–C) Beat-Va neurons genetically labeled with mCD8::GFP and driving a UAS-Abd-BRNAi at wL3 (A), 2 h APF (B), and 6 h APF (C) stained for cleaved Dcp-1. Magnified views of A3–A7 lateral cells from the right and left are shown as a single plane image on the right of each image. (D) Beat-Va neurons labeled with mCD8::GFP and driving UAS-Abd-BRNAi at wL3 stained with the EcR-B1 showing the continued colocalization of EcR-B1 in the absence of Abd-B. (E) Beat-Va neurons at wL3 genetically labeled with mCD8::GFP and crossed to UAS-Abd-B and stained with anti-Abd-B. The two most anterior lateral and medial cell bodies are magnified and show Abd-B expression, which is not usually present in these cells, confirming overexpression was successful. (F) The three most anterior medial Beat-Va neurons at wL3 labeled with CD8::GFP and stained with Abd-B shows Abd-B is present in some medial cells even though they do not undergo cell death. (G) Beat-VaM neurons at HE genetically labeled with mCD8::GFP and stained with anti-Abd-B. The A5–7 medial cells continue to express Abd-B at HE. Left and right hemisegment denoted by “L” and “R.” (H) Beat-Va neurons at wL3 genetically labeled CD8::GFP (green) stained with the EcR-B1 Receptor (magenta) showing all lateral and medial cell bodies express the receptor. (I) Beat-Va neurons at 6 h APF genetically labeled with CD8::GFP (green), expressing a UAS regulated EcRDN, and stained with the EcR-B1 Receptor (magenta) to identify cells that express UAS-EcRDN. There are typically no EcR-B1 positive cells at this time. (J) Beat-Va neurons at wL3 genetically labeled CD8::GFP (green) and expressing UAS-Cas9 and EcR-targeting gRNA ubiquitously. Stained with the EcR-B1 Receptor (magenta) to evaluate if cells lose EcR-B1 expression. (K) Quantification of gRNA against usp, plum, EcR on Beat-Va EcR-B1 expression when compared with control. One-way ANOVA, Kruskal–Wallis test for multiple comparisons. n = number of animals. Colored data points correspond to the representative image shown in the figure. All error bars are SEM. Scale bar is 5 µm in all images with a single cell body and 20 µm in all other images.
Figure 3.
Figure 3.
Beat-Va M neurons remodel when neuronal EcR signaling or expression is inhibited. (A and B) Surface rendering of control Beat-VaM neuron driving UAS-LacZ using the MCFO technique at wL3 (A) and HE (B). Intact neurites, magenta; fragmented neurites, cyan. Boxed area is shown in high magnification below each image. (C and D) Beat-VaM neuron expressing EcRDN labeled with the MCFO technique at wL3 (C) and HE (D). (E) Quantification of Beat-VaM branch point number at HE in EcRDN background. (F) Quantification of Beat-VaM total neurite length in EcRDN background. (G and H) Beat-Va neurons genetically labeled with mCD8::GFP and expressing Cas9 under UAS control. gRNAs are expressed ubiquitously. Cell-specific knockout of control gRNAs at wL3 (G) and HE (H). (I and J) Targeting EcR with gRNAs in BeatM neurons at wL3 (I) or at HE (J). Fine neurites, yellow arrow. Boxed areas are displayed in high magnification below each image. (K and L)usp gRNAs in BeatM neurons at wL3 (K) or HE (L). Fine neurites, yellow arrow. (M and N) Expression of plum gRNAs in wL3 neurons (M) and HE (N). Fine neurites, yellow arrow. (O and P) Expression of Rpn6 gRNAs in wL3 neurons (O) and HE (P). Fine neurites, yellow arrow. (Q and R) Expression of UAS-WldS in wL3 neurons (Q) and HE (R) does not change Beat-VaM neurite pruning. Comparisons with two-way ANOVA and Sidak test for multiple comparisons. (G–R) Scale bars are 20 µm. (A–D) Scale bars are 20 µm in single cell images and 5 µm in the magnified view. (E and F) Each data point represents one cell. For wL3 LacZ cells were imaged from seven animals, for HE LacZ cells were imaged from five animals, for wL3 EcRDN cells were imaged from eight animals, for HE EcRDN cells were imaged from five animals. (G–R) At least seven animals were examined per genotype and timepoint. Colored data points correspond to the representative image shown in the figure. All error bars are SEM.
Figure 4.
Figure 4.
Genetic depletion of EcR by targeting upstream regulators does not block Beat-Va M neuron remodeling. (A and B) Beat-Va neurons labeled with mCD8::GFP at wL3 (A) or HE (B) while driving a UAS-LacZ as a control construct. Boxed area shown at higher magnification below. (C and D) Beat-Va neurons expressing UAS-PlumRNAi and UAS-BaboARNAi to suppress EcR-B1 expression at wL3 (C) and HE (D). Remaining projections, yellow arrow. Scale bars are 20 µm. (E) Dual expression of UAS-BaboARNAi and UAS-PlumRNAi resulted in substantial loss of EcR protein by antibody staining. One-way ANOVA, Kruskal-Wallis test for multiple comparisons. Each dot represents one animal. (F and G) Beat-VaM neurons driving UAS-LacZ and UAS-PlumRNAi labeled using MCFO at wL3 (F) and HE (G). (H and I) Beat-VaM neurons driving UAS-BaboARNAi and UAS-PlumRNAi labeled using MCFO at wL3 (H) and HE (I). Intact neurites, magenta; fragmented neurites, cyan. Boxed areas are shown in high magnification below the image. (J and K) Quantification of branch point number (J) and (K) neurite length for F–I. Comparison with two-way ANOVA and Sidak test for multiple comparisons. (A–D) Scale bars are 20 µm. (F–I) Surface renderings. Scale bars are 20 µm in single cell images and 5 µm in the magnified view. (J and K) Each data point represents one cell. For wL3, LacZ Plum cells were imaged from four animals, for HE, LacZ Plum cells were imaged from five animals, for wL3 Plum, BaboA cells were imaged from four animals, and for HE Plum, BaboA cells were imaged from five animals. Colored data points correspond to the representative image shown in the figure. All error bars are SEM.
Figure 5.
Figure 5.
Cell specific neuronal activity manipulation does not change Beat-Va M pruning. (A and B) Beat-Va neurons genetically labeled with mCD8::GFP and expressing UAS-LacZ at wL3 (A) and HE (B). (C and D) Beat-Va neurons genetically labeled with mCD8::GFP and constitutively expressing Kir2.1 under UAS control at wL3 (C) and HE (D). (E and F) Beat-Va neurons expressing LacZ under UAS control when at wL3 (E) and HE (F). The HE condition underwent metamorphosis at 29°C. (G and H) Beat-Va neurons expressing Trp1A, a temperature-sensitive cation channel, under UAS control at wL3 (G) and HE (H). The HE condition underwent metamorphosis at 29°C. (I and J) Beat-Va neurons expressing LacZ under UAS control at wL3 (I) and HE (J). All animals spent the 48 h prior to collection at 29°C. (K and L) Beat-Va neurons expressing Trp1A, under UAS control at wL3 (K) and HE (L). All animals spent the 48 h prior to collection at 29°C. All scale bars are 20 µm.
Figure S4.
Figure S4.
Cell autonomous expression of EcR DN blocks astrocyte transformation and has additive effects in Beat-Va neurite pruning. (A–C) Astrocytes genetically manipulated with GMR25H07-Gal4 (a strong astrocyte Gal4 line) crossed to UAS-CD8::GFP (A) show a “wispy” morphology at wL3, (B) display many phagolysomes at 4 h APF (Yunsik et al., 2023, Preprint), and (C) are normally only faintly detectable by HE. (D–F) Astrocytes expressing a UAS-EcRDN, labeled with mCD8::GFP at wL3 (D) showing their “wispy” morphology, which is retained at (E) 4 h APF, and (F) HE, indicating a failure to transform. (G and H)arm-LexA, LexAop-mCD8::RFP at (G) wL3 where normal astrocyte morphology is apparent, and (H) HE when astrocytes are no longer visible. (I and J) (I) When alrm-LexA drives a LexAop-EcRDN in addition to LexAop-mCD8::RFP, astrocytes appear normal at wL3, (J) but then fail to transform at HE. Scale bars are 20 µm. (K–N) (K) Micrograph of a single cell MFCO clones at HE in the control condition, (L) when EcRDN is expressed only in Beat-Va neurons, (M) when astrocyte transformation is blocked via astrocytic expression of EcR, and (N) when both neuronal and astrocytic EcR signaling is blocked. All scale bars are 20 µm.
Figure 6.
Figure 6.
Astrocyte-derived signals converge with intrinsic BeatVa M neuron EcR signaling to execute local pruning. (A and B) Beat-VaM neurons labeled with MCFO in an alrm-LexA background (control) at wL3 (A) or HE (B). (C and D)alrm-LexA, LexAOp-EcRDN background labeled with the MCFO technique at wL3 (C) or HE (D). (E and F) Quantification of branch point number (E) or total neurite length (F) of A–D. (G and H) Beat-VaM neurons in an alrm-Gal4 background (control) at wL3 (G) or HE (H). (I and J) Beat-VaM neurons in an alrm-Gal4, UAS-EcRDN background at wL3 (I) or HE (J). (K and L) Quantification of branch point number (K) or total neurite length (L) of G–J. (E and F) Each data point represents one cell. wL3 control cells were imaged from six animals, HE control cells were imaged from six animals, wL3 astrocyte+neuron EcRDN cells were imaged from six animals, and HE astrocyte EcRDN cells were imaged from six animals. (J and K) Each data point represents one cell. wL3 control cells were imaged from six animals, HE control cells were imaged from five animals, wL3 astrocyte EcRDN cells were imaged from seven animals, HE astrocyte EcRDN cells were imaged from six animals. All comparisons are done with two-way ANOVA with the Sidak test for multiple comparisons. (A–D and G–J) Surface renderings. Intact neurites, magenta; fragmented neurites, cyan. Scale bars are 20 µm for whole neuron images and 5 µm for magnified images. Colored data points correspond to the representative image shown in the figure. All error bars are SEM.
Figure S5.
Figure S5.
Verification of newly constructed BeatVa-LexA line. Animals carrying the BeatVa-LexA construct were crossed to animals carrying a LexAop-Jupiter.sfGFP (a GFP construct that localizes to microtubule networks and has been reported to label neurite processes well [Karpova et al., 2006]) to genetically label any cells where the BeatVa-LexA line was expressed. These animals were then crossed to an existing stock that carried both the original BeatVa-Gal4 construct and a UAS-mCD8::cherry. Good signal overlap between the GFP and Cherry fluorophores indicates the BeatVa-LexA and BeatVa-Gal4 lines labeled the same population of neurons in addtion to labeling a second population of non-neuronal cells (likely surface glia). Scale bars are 20 µm.
Figure 7.
Figure 7.
Pan glial, but not astrocyte or cortex glia specific depletion of Myo, drives Beat-Va M neurite fragmentation. (A and B) Beat-Va neurons labeled with a LexAop driven, CD4-tdGFP at wL3 (A) or HE (B). (C) Beat-VaM neurons at HE with repo-Gal4 and UAS-LacZ (control) in the background. (D) Myo knocked down in all glia with repo-Gal4. (E) Myo knocked down only in astrocytes with alrm-Gal4. (F) Myo knocked down only in cortex glia with wrapperDBD-Gal4, Nrv-Gal4AD. Eight animals were checked for each time point and genotype shown in this figure, and the morphology and phenotypes shown are representative of what was observed. All scale bars are 20 µm.
Figure 8.
Figure 8.
Pan-glial Myo induces phagocytic astrocyte transformation. (A–C) Astrocytes labeled with a membrane targeted GFP (UAS-mCD8::GFP) at wL3 (A), 4APF (B), and HE (C), showing the typical tranformation from circuit support cells with “wispy” processes at wL3 to phagocytic cells with vesicles (yellow arrows) at 4 h APF, to largely absent from the neuropil at HE. (D–F) Myo knocked down only in astrocytes with alrm-Gal4. Astrocytes look morphologically normal at wL3 (D), continue to transform into phagocytes by 4 h APF (E) with vesicles (yellow arrows), and then largely disappear from the neuropil by HE (F). (G–I) Visualization of astrocytes using a UAS-mCD8::Cherry when Myo is knocked down in all glia. Astrocytes look morphologically normal at wL3 (G) but fail to transform into phagocytes with vesicles at 4 h APF (H) and continue to persist, albeit without phagocytic vesicles, to HE (I). (J) EcR-B1 staining in a alrm-Gal4, UAS-LacZ (control) animal. (K and L) Expression of UAS-MyoRNAi in all glia, EcR-B1 staining (magenta). Astrocyte membranes, green. (M and N) Expression of UAS-MyoRNAi in astrocytes, EcR-B1 staining, magenta. Astrocyte membranes, green. Six to eight animals were checked for each time point and genotype shown in this figure, and the morphology and phenotypes shown are representative of what was observed. All scale bars are 20 µm.
Figure 9.
Figure 9.
Small scale genetic screen identifies astrocytic cues that drive Beat-Va M remodeling. (A) Pie chart summarizing the results of the screen, indicating the number of lines per phenotypic category. Astrocyte knockdown of candidate molecules was achieved by UAS-driven RNAi’s, and Beat-Va neurons were visualized with Beat-LexA–driven CD4-tdGFP. (B–V) Show Beat-VaM neurons, grouped by phenotype and color-coded to match the pie chart in A, with the gene which the RNAi targeted indicated above the corresponding image. Scale bar is 20 µm. Five animals were examined per condition, and phenotypes shown are representative of what was observed.
Figure 10.
Figure 10.
Astrocyte transformation correlates strongly with Beat-VaM neurite fragmentation. (A–A″) Astrocytes expressing a UAS-LacZ (control) labeled with a membrane-targeted GFP (UAS-mCD8::GFP) at wL3 (A), 4 h APF (A′), and HE (A″). (B–E″) Astrocytes expressing UAS-DIPζRNAi (B–B″), UAS-CG3164RNAi (C–C″), UAS-FipiRNAi (D–D″), UAS-Dpr2RNAi (E–E″) labeled with a membrane-targeted GFP (UAS-mCD8::GFP) at wL3, 4APF, and HE. All manipulations show a stark lack of transformation of astrocytes into phagocytes at 4 h APF, as evidenced by lack of vesicles (B′–E′). (F–H″) Astrocytes expressing UAS-BaboRNAi (F–F″), UAS-HtlRNAi (G–G″), UAS-Kek5RNAi (H–H″). Knockdown of these genes do not noticeably disrupt the transformation of astrocytes into phagocytes, as all 4 h APF animals (F′–H′) still exhibit vesicle formation. Scale bars are 20 µm. Yellow arrows denote correctly formed phagocytic veiscles.

Similar articles

References

    1. Atz, M.E., Rollins B., and Vawter M.P.. 2007. NCAM1 association study of bipolar disorder and schizophrenia: Polymorphisms and alternatively spliced isoforms lead to similarities and differences. Psychiatr. Genet. 17:55–67. 10.1097/YPG.0b013e328012d850 - DOI - PMC - PubMed
    1. Awasaki, T., Huang Y., O’Connor M.B., and Lee T.. 2011. Glia instruct developmental neuronal remodeling through TGF-β signaling. Nat. Neurosci. 14:821–823. 10.1038/nn.2833 - DOI - PMC - PubMed
    1. Baines, R.A., Uhler J.P., Thompson A., Sweeney S.T., and Bate M.. 2001. Altered electrical properties in Drosophila neurons developing without synaptic transmission. J. Neurosci. 21:1523–1531. 10.1523/JNEUROSCI.21-05-01523.2001 - DOI - PMC - PubMed
    1. Bakshi, A., Sipani R., Ghosh N., and Joshi R.. 2020. Sequential activation of Notch and Grainyhead gives apoptotic competence to Abdominal-B expressing larval neuroblasts in Drosophila Central nervous system. PLoS Genet. 16:e1008976. 10.1371/journal.pgen.1008976 - DOI - PMC - PubMed
    1. Bornstein, B., Meltzer H., Adler R., Alyagor I., Berkun V., Cummings G., Reh F., Keren-Shaul H., David E., Riemensperger T., and Schuldiner O.. 2021. Transneuronal Dpr12/DIP-δ interactions facilitate compartmentalized dopaminergic innervation of Drosophila mushroom body axons. EMBO J. 40:e105763. 10.15252/embj.2020105763 - DOI - PMC - PubMed

MeSH terms

LinkOut - more resources