. 2025 May 8;25(7):1491-1507.
doi: 10.17305/bb.2024.10802.

Enhancing clinical decision-making in closed pelvic fractures with machine learning models

Affiliations

Enhancing clinical decision-making in closed pelvic fractures with machine learning models

Dian Wang et al. Biomol Biomed. .

Abstract

Closed pelvic fractures can lead to severe complications, including hemodynamic instability (HI) and mortality. Accurate prediction of these risks is crucial for effective clinical management. This study aimed to utilize various machine learning (ML) algorithms to predict HI and death in patients with closed pelvic fractures and identify relevant risk factors. The retrospective study included 208 patients diagnosed with pelvic fractures and admitted to Suning Traditional Chinese Medicine Hospital between 2019 and 2023. Among these, 133 cases were identified as closed PFs. Patients with closed fractures were divided into a training set (n = 115) and a test set (n = 18). The training set was further stratified into two groups based on hemodynamic stability: Group A (patients with HI) and Group B (patients with hemodynamic stability). A total of 40 clinical variables were collected, and multiple machine learning algorithms were employed to develop predictive models, including logistic regression (LR), C5.0 Decision Tree (DT), Naive Bayes (NB), support vector machine (SVM), K-nearest neighbors (KNN), random Forest (RF), and artificial neural network (ANN). Additionally, factor analysis was performed to assess the interrelationships between variables. The RF and LR algorithms outperformed traditional methods-such as central venous pressure (CVP) and intra-abdominal pressure (IAP) measurements-in predicting HI. The RF model achieved an average under the ROC (AUC) of 0.92, with an accuracy of 0.86, precision of 0.81, and an F1 score of 0.87. The LR model had an average AUC of 0.82 but shared the same accuracy, precision, and F1 score as the RF model. Key risk factors identified included TILE grade, heart rate (HR), creatinine (CR), white blood cell count (WBC), fibrinogen (FIB), and lactic acid (LAC), with LAC levels >3.7 and an injury severity score (ISS) >13 as significant predictors of HI and mortality. In conclusion, the RF and LR algorithms are effective in predicting HI and mortality risk in patients with closed PFs, enhancing clinical decision-making and improving patient outcomes.


Conflict of interest statement

Conflicts of interest: Authors declare no conflicts of interest.

Figures

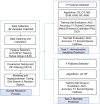
Figure 1.
Figure 1.
Research design and grouping process. CVP: Central venous pressure; IAP: Intra-abdominal pressure.
Figure 2.
Figure 2.
Flowchart of the research methods. LR: Logistic regression; C5.0: C5.0 decision tree algorithm; NB: Naive Bayes; SVM: Support vector machine; KNN: K-nearest neighbors; RF: Random forest; ANN: Artificial neural network; VIF: Variance in ation factor; AUC: Area under the ROC curve; DT: Decision tree.
Figure 3.
Figure 3.
Performance evaluation of the HI prediction model on the test set. (A) Spearman correlation analysis was conducted on clinical data from 115 patients in the training set, including HI, HR, SBP, DBP, WBC, Tile classification, FIB, CR, pH, pCO2, pO2, and lactate (LAC) to assess correlations among clinical characteristics; (B) Spearman correlation analysis was conducted on the ISS, GCS, TRISS, and APACHE II in Group A of the training subset to analyze correlations among these variables for predicting mortality in HI patients. HI: Hemodynamic instability; WBC: White blood cell count; HR: Heart rate; SBP: Systolic blood pressure; DBP: Diastolic blood pressure; FIB: Fibrinogen; CR: Creatinine; pCO2: Partial pressure of carbon dioxide; pO2: Partial pressure of oxygen; LAC: Lactic acid; GCS: Glasgow Coma Scale; ISS: Injury Severity Score; TRISS: Trauma and Injury Severity Score; APACHE II: Acute Physiology and Chronic Health Evaluation; RTS: Revised Trauma Score.
Figure 4.
Figure 4.
Training and test results of the HI prediction model. (A) Performance metrics of the training set for the HI prediction model constructed using seven machine learning algorithms; (B) ROC curve of the HI prediction model on the training set; (C) Performance metrics of the test set for the HI prediction model constructed using seven MLalgorithms; (D) ROC curve of the HI prediction model on the test set; (E) Flowchart comparing and selecting algorithms, providing a comprehensive overview of the performance of ML models based on training and test sets. The reasons for selecting the RF and LR models are highlighted, as these two models demonstrated superior performance on key metrics. LR: Logistic regression; DT: Decision tree; RF: Random forest; NB: Naive Bayes; SVM: Support vector machine; KNN: K-nearest neighbors; ANN: Artificial neural network; CVP: Central venous pressure; IAP: Intra-abdominal pressure; HI: Hemodynamic instability; ROC: Receiver operating characteristic; ML: Machine learning.
Figure 5.
Figure 5.
Confusion matrix results of two different machine learning models on the training set. (A) Confusion matrix of the RF model. The horizontal axis represents the predicted labels, and the vertical axis represents the actual labels. HI denotes hemodynamically unstable patients, and HS denotes hemodynamically stable patients. The model’s prediction accuracy for HI and HS is 0.96 and 0.93, respectively. (B) Confusion matrix of the LR model, with the same horizontal and vertical axes as above. The model’s prediction accuracy for HI and HS is 0.86 and 0.82, respectively. LR: Logistic regression; RF: Random forest; HI: Hemodynamic instability.
Figure 6.
Figure 6.
Key factors closely associated with HIidentified by the RF model. This heatmap displays key factors identified by the RF model closely associated with hemodynamic instability (HI vs HS). The values represent the average levels of different clinical indicators under two conditions (hemodynamically unstable vs stable), with color intensity reflecting the magnitude of these values. Red areas highlight significantly elevated lactate levels (LAC) and WBC in hemodynamically unstable patients, indicating their importance as risk factors. The clinical indicators include HR, SBP, DBP, WBC, Tile Classification (Tile), FIB, CR, pH, pCO2, pO2, and LAC. RF: Random forest; HI: Hemodynamic instability; WBC: White blood cell count; HR: Heart rate; SBP: Systolic blood pressure; DBP: Diastolic blood pressure; FIB: Fibrinogen; CR: Creatinine; pH: Hydrogen ion concentration; pCO2: Partial pressure of carbon dioxide; pO2: Partial pressure of oxygen; LAC: Lactic acid.
Figure 7.
Figure 7.
Performance analysis of mortality prediction models built with RF and LR algorithms. (A) Comparison of performance metrics, including AUC, accuracy, precision, and F1 score, for mortality risk prediction models for HI patients developed using training subset Group A; (B) ROC curves for RF and LR models, illustrating the relationship between true positive rate and false positive rate at various thresholds; (C) Confusion matrix for mortality prediction in the RF model on training subset Group A; (D) Confusion matrix for mortality prediction in the LR model on training subset Group A. RF: Random forest; LR: Logistic regression; HI: Hemodynamic instability; AUC: Area under the ROC curve; ROC: Receiver operating characteristic.
Figure 8.
Figure 8.
Key factors closely associated with mortality risk in HI patients analyzed using the RF model. This figure displays the importance of four main factors related to mortality risk in HI patients within the RF model: TRISS, ISS, GCS, and APACHE II. Each cell represents the weight of a specific factor in predicting mortality (red bars) or survival (blue bars). The factors include the ISS, GCS, TRISS, and APACHE II. HI: Hemodynamic instability; GCS: Glasgow Coma Scale; ISS: Injury Severity Score; TRISS: Trauma and Injury Severity Score; APACHE II: Acute Physiology and Chronic Health Evaluation; RF: Random forest.
Figure 9.
Figure 9.
Research mechanisms for predictive models of hemodynamic instability and mortality risk. SVM: Support vectormachine; KNN: K-nearest neighbors; RF: Random forest; ANN: Arti cial neural network; VIF: Variance in ation factor; AUC: Area under the ROC curve; DT: Decision tree; LR: Logistic regression.
Figure S1.
Figure S1.
Calibration and DCA of the RF model on the training set. (A) The calibration plot shows the consistency between the predicted probabilities of the RF model and the actual observed probabilities. The diagonal line represents perfect calibration; the closer the models curve is to this line, the more consistent its predictions are with actual outcomes. In this study, the model demonstrates good calibration across most probability ranges, especially in the medium- to high-risk ranges. (B) The decision curve illustrates the net benefit of the RF model at different thresholds. DCA evaluates the model’s net benefit across various threshold values. The blue curve represents the model’s net benefit, the red dashed line represents the “treat all” strategy, and the green dashed line represents the “treat none” strategy. RF: Random forest; DCA: Decision curve analysis.

Similar articles

References

    1. Mandell JC, Khurana B. Musculoskeletal trauma and infection. Magn Reson Imaging Clin N Am. 2022;30(3):441–54. https://doi.org/10.1016/j.mric.2022.04.007. - PubMed
    1. Rondanelli AM, Gómez-Sierra MA, Ossa AA, Hernández RD, Torres M. Damage control in orthopaedical and traumatology. Colomb Med (Cali) 2021;52(2):e4184802. 2021 Jun 30. https://doi.org/10.25100/cm.v52i2.4802. - PMC - PubMed
    1. Graber M, Marino DV, Johnson DE. Anterior hip dislocation. In: StatPearls. Treasure Island (FL): StatPearls Publishing; 2023 Jul 25. - PubMed
    1. Kleweno CP, Scolaro J, Sciadini MF, McAlister I, Shannon SF, Chip Routt ML. Management of pelvic fractures. Instr Course Lect. 2020;69:489–506. PMID: 32017748. - PubMed
    1. Atif M, Hasan O, Baloch N, Umer M. A comprehensive basic understanding of pelvis and acetabular fractures after high-energy trauma with associated injuries: narrative review of targeted literature. J Pak Med Assoc. 2020;70(Suppl_1):S70–75. PMID: 31981340. - PubMed