

Aquaphotomics study of fresh cannabis inflorescence: near infrared spectral analysis of water matrix structures
- PMID: 39652218
- PMCID: PMC11772404
- DOI: 10.1007/s00216-024-05685-z
Aquaphotomics study of fresh cannabis inflorescence: near infrared spectral analysis of water matrix structures
Abstract
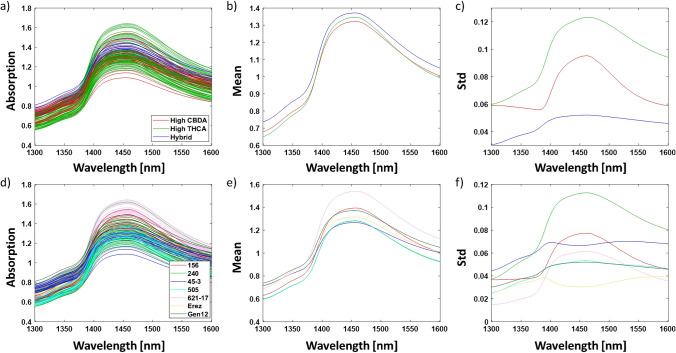
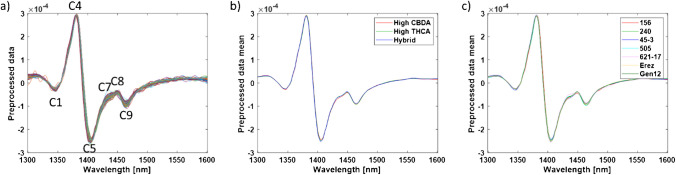
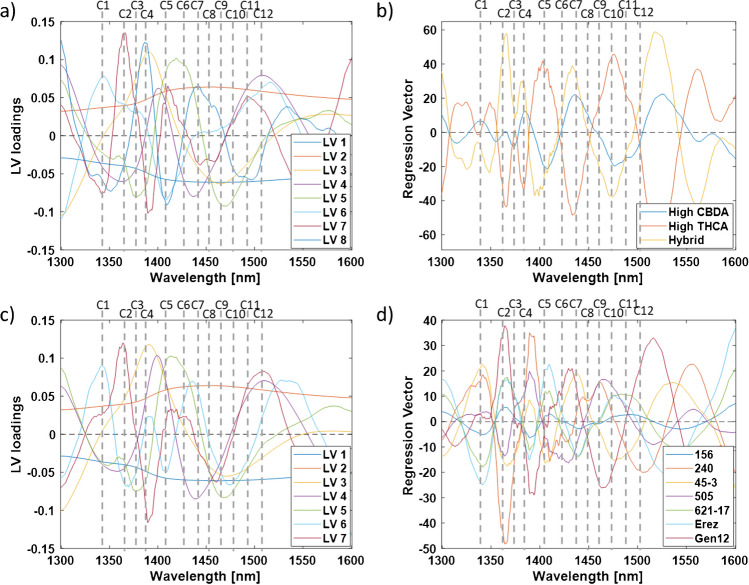
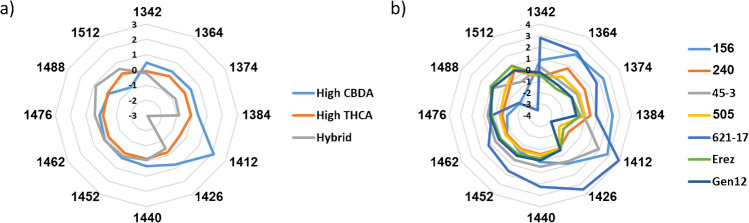
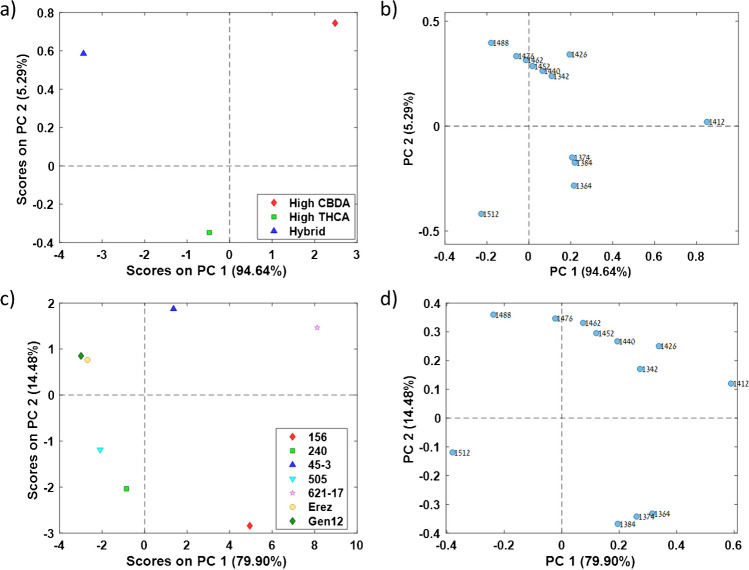
Aquaphotomics is an approach that describes the water-light interactions in aqueous solutions or biological systems and retrieves information about the nature of the underlying water-related interactions. We evaluated the water spectral pattern (WASP) and water matrix structure of freshly harvested cannabis inflorescence from seven different chemovars using near-infrared (NIR) spectral data coupled with chemometric models. Six activated water bands-1342, 1364, 1384, 1412, 1440, and 1462 nm, occurred consistently in all of the spectrum exploration steps as well as in the partial least squares-discriminant analysis (PLS-DA) steps. However, according to major class and chemovar aquagram values, the largest spectral variation was associated with the following bands: 1412, 1364, 1374, 1384, 1488, and 1512 nm. A strong positive correlation between 1364, 1374, and 1384 nm aquagram values and a strong negative correlation between 1412 and 1512 nm aquagram values were observed through all aquagram analysis steps. These water activated bands were found to serve as good discriminators and classifiers according to either major class or chemovar. Furthermore, significant differences in the water matrix structure of different cannabis chemovars were observed, with the highest variations associated with the presence of free water molecules, small molecule solvation shells, extent of strongly bound water, and the number of hydrogen bonds per water molecule. Minor cannabinoids and terpenes such as cannabigerolic acid and (-)-guaiol displayed relatively high correlations with these bands. The results of this study suggest that the most accurate way to explore the cannabis inflorescence water matrix spectral pattern is by chemovars and not by major classes.
Keywords: Aquaphotomics; Fourier transform near-infrared spectroscopy (FT-NIR); Water spectral pattern (WASP); Wet Cannabis sativa L. inflorescence.
© 2024. The Author(s).
Conflict of interest statement
Declarations. Conflict of interest: The authors declare no competing interests.
Figures
Similar articles
-
Comparative chemometric modeling of fresh and dry cannabis inflorescences using FT-NIR spectroscopy: Quantification and classification insights.Phytochem Anal. 2025 Apr;36(3):537-555. doi: 10.1002/pca.3449. Epub 2024 Sep 10. Phytochem Anal. 2025. PMID: 39254142
-
Rapid screening of esophageal squamous cell carcinoma by near-infrared spectroscopy combined with aquaphotomics.Talanta. 2025 Apr 1;285:127399. doi: 10.1016/j.talanta.2024.127399. Epub 2024 Dec 16. Talanta. 2025. PMID: 39708567
-
Multivariate classification of cannabis chemovars based on their terpene and cannabinoid profiles.Phytochemistry. 2022 Aug;200:113215. doi: 10.1016/j.phytochem.2022.113215. Epub 2022 Apr 26. Phytochemistry. 2022. PMID: 35483556
-
Aquaphotomics: Near Infrared Spectroscopy and Water States in Biological Systems.Subcell Biochem. 2015;71:189-211. doi: 10.1007/978-3-319-19060-0_8. Subcell Biochem. 2015. PMID: 26438266 Review.
-
Pitfalls in the analysis of phytocannabinoids in cannabis inflorescence.Anal Bioanal Chem. 2020 Jul;412(17):4009-4022. doi: 10.1007/s00216-020-02554-3. Epub 2020 Apr 14. Anal Bioanal Chem. 2020. PMID: 32285185 Review.
References
-
- Chandra S, Lata H, Khan IA, ElSohly MA. The role of biotechnology in Cannabis sativa propagation for the production of phytocannabinoids. Biotechnology for Medicinal Plants. Springer, Berlin; 2013. p. 123–48. 10.1007/978-3-642-29974-2_5.
-
- Upton R, ElSohly M. Cannabis inflorescence: Cannabis spp.; standards of identity, analysis, and quality control. American Herbal Pharmacopoeia, Scotts Valley; 2014
-
- Flores-Sanchez IJ, Verpoorte R. Secondary metabolism in Cannabis. Phytochem Rev. 2008;7(3):615–39. 10.1007/s11101-008-9094-4.
-
- Hussain SA, Zhou R, Jacobson C, Weng J, Cheng E, Lay J, et al. Perceived efficacy of cannabidiol-enriched Cannabis extracts for treatment of pediatric epilepsy: a potential role for infantile spasms and Lennox-Gastaut syndrome. Epilepsy Behav. 2015;47:138–41. 10.1016/j.yebeh.2015.04.009. - PubMed
-
- Stockings E, Zagic D, Campbell G, Weier M, Hall WD, Nielsen S, et al. Evidence for Cannabis and cannabinoids for epilepsy: a systematic review of controlled and observational evidence. J Neurol Neurosurg Psychiatry. 2018;89(7):741–53. 10.1136/jnnp-2017-317168. - PubMed
MeSH terms
Substances
Grants and funding
LinkOut - more resources
Full Text Sources
Miscellaneous
