

Long COVID Discourse in Canada, the United States, and Europe: Topic Modeling and Sentiment Analysis of Twitter Data
- PMID: 39652387
- PMCID: PMC11667136
- DOI: 10.2196/59425
Long COVID Discourse in Canada, the United States, and Europe: Topic Modeling and Sentiment Analysis of Twitter Data
Abstract
Background: Social media serves as a vast repository of data, offering insights into public perceptions and emotions surrounding significant societal issues. Amid the COVID-19 pandemic, long COVID (formally known as post-COVID-19 condition) has emerged as a chronic health condition, profoundly impacting numerous lives and livelihoods. Given the dynamic nature of long COVID and our evolving understanding of it, effectively capturing people's sentiments and perceptions through social media becomes increasingly crucial. By harnessing the wealth of data available on social platforms, we can better track the evolving narrative surrounding long COVID and the collective efforts to address this pressing issue.
Objective: This study aimed to investigate people's perceptions and sentiments around long COVID in Canada, the United States, and Europe, by analyzing English-language tweets from these regions using advanced topic modeling and sentiment analysis techniques. Understanding regional differences in public discourse can inform tailored public health strategies.
Methods: We analyzed long COVID-related tweets from 2021. Contextualized topic modeling was used to capture word meanings in context, providing coherent and semantically meaningful topics. Sentiment analysis was conducted in a zero-shot manner using Llama 2, a large language model, to classify tweets into positive, negative, or neutral sentiments. The results were interpreted in collaboration with public health experts, comparing the timelines of topics discussed across the 3 regions. This dual approach enabled a comprehensive understanding of the public discourse surrounding long COVID. We used metrics such as normalized pointwise mutual information for coherence and topic diversity for diversity to ensure robust topic modeling results.
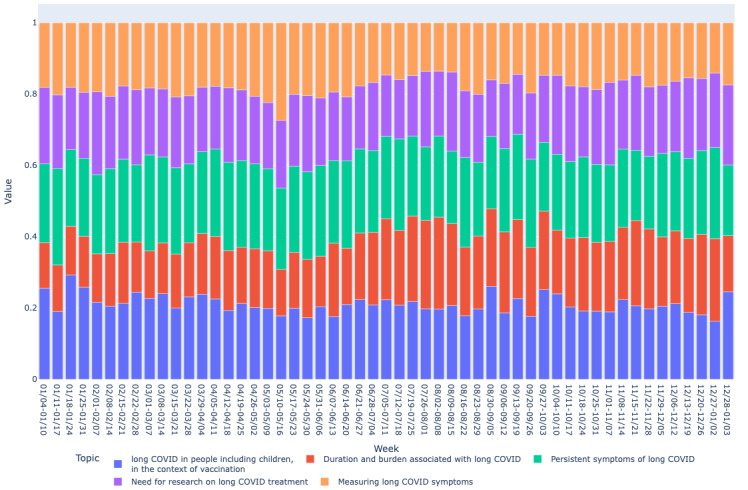
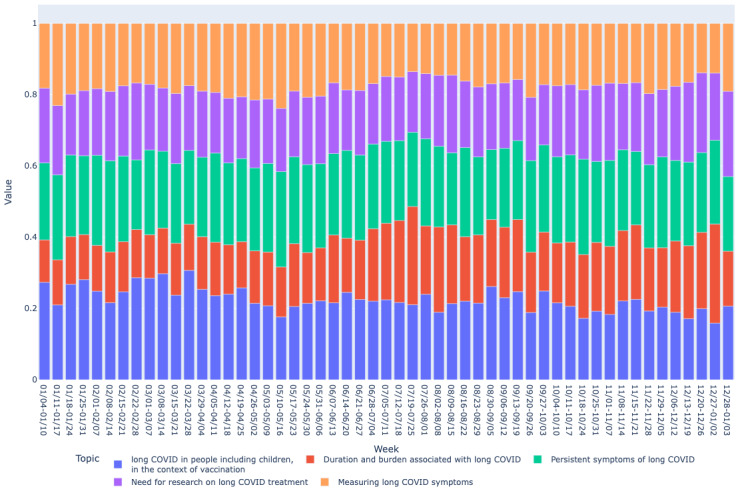
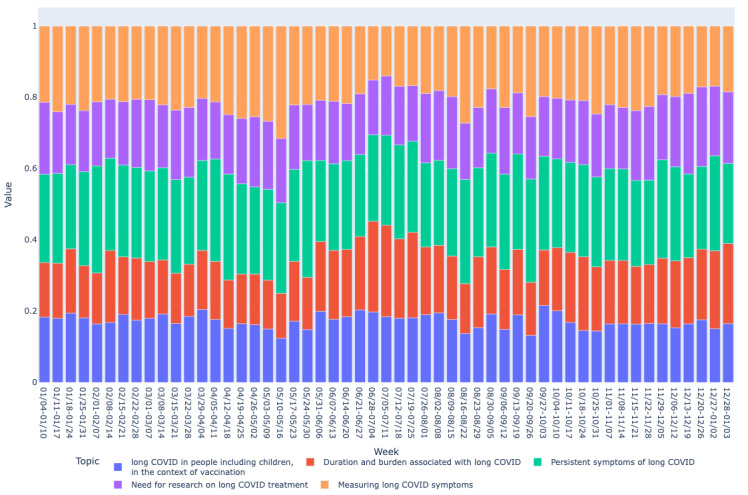
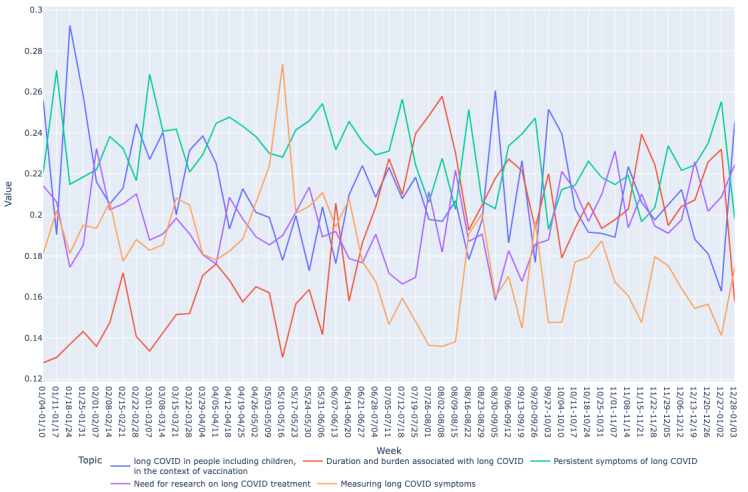
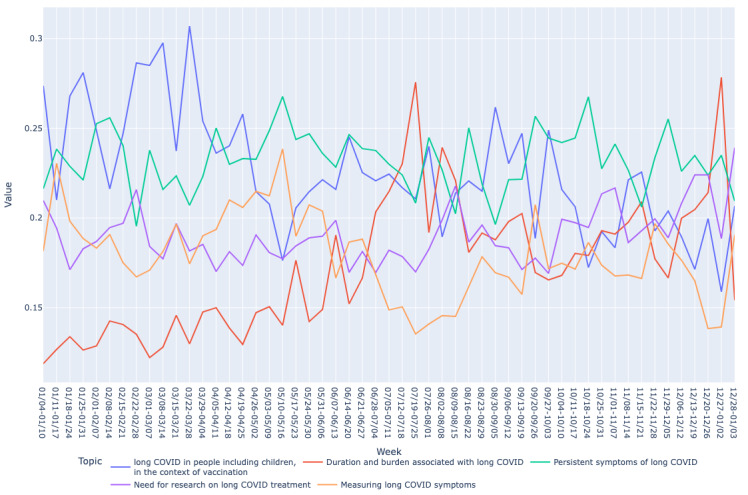
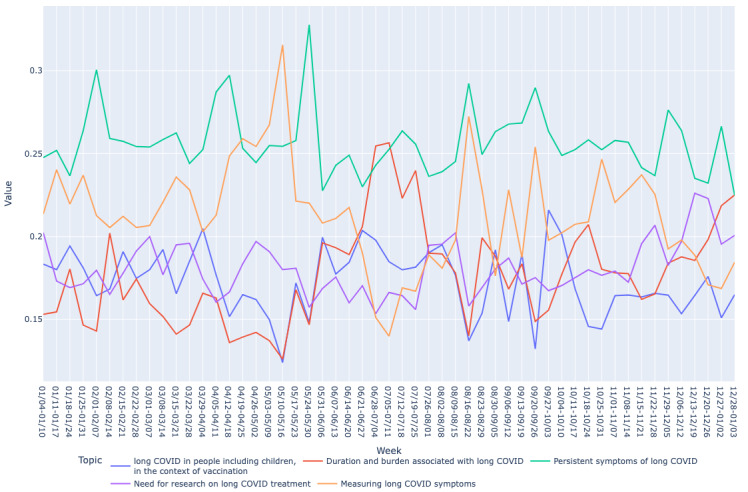
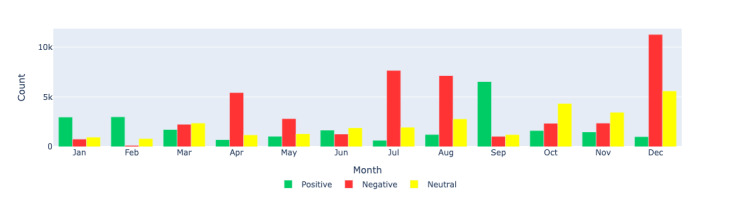
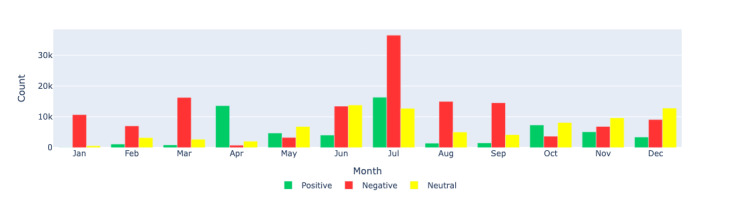
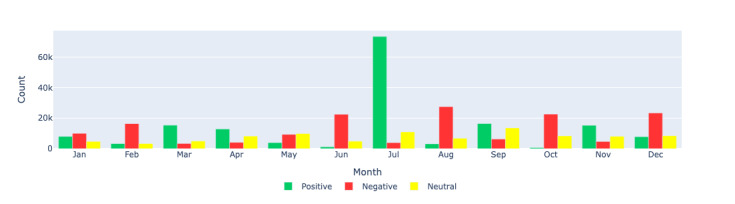
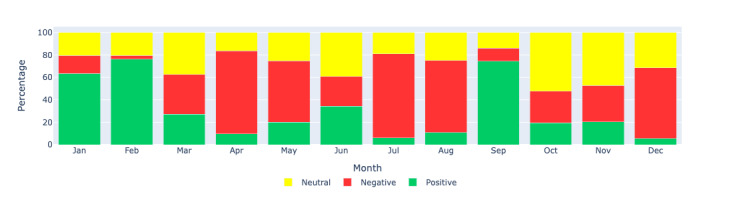
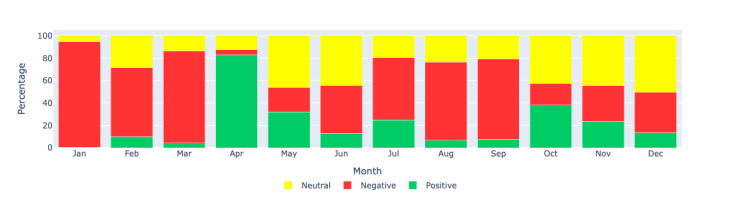
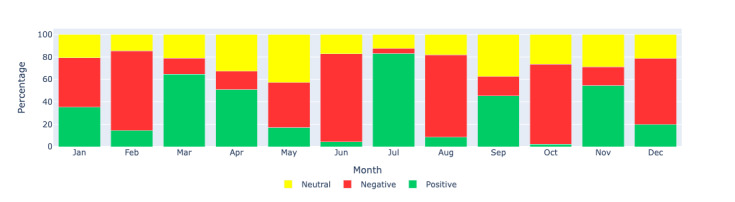
Results: Topic modeling identified five main topics: (1) long COVID in people including children in the context of vaccination, (2) duration and suffering associated with long COVID, (3) persistent symptoms of long COVID, (4) the need for research on long COVID treatment, and (5) measuring long COVID symptoms. Significant concern was noted across all regions about the duration and suffering associated with long COVID, along with consistent discussions on persistent symptoms and calls for more research and better treatments. In particular, the topic of persistent symptoms was highly prevalent, reflecting ongoing challenges faced by individuals with long COVID. Sentiment analysis showed a mix of positive and negative sentiments, fluctuating with significant events and news related to long COVID.
Conclusions: Our study combines natural language processing techniques, including contextualized topic modeling and sentiment analysis, along with domain expert input, to provide detailed insights into public health monitoring and intervention. These findings highlight the importance of tracking public discourse on long COVID to inform public health strategies, address misinformation, and provide support to affected individuals. The use of social media analysis in understanding public health issues is underscored, emphasizing the role of emerging technologies in enhancing public health responses.
Keywords: Twitter; long COVID; public health; public perception; sentiment analysis; social media analysis; topic modeling.
©Ahmed Ghassan Tawfiq AbuRaed, Emil Azuma Prikryl, Giuseppe Carenini, Naveed Zafar Janjua. Originally published in the Journal of Medical Internet Research (https://www.jmir.org), 09.12.2024.
Conflict of interest statement
Conflicts of Interest: NZJ participated in advisory boards and has spoken for AbbVie and Gilead, not related to this work.
Figures

Similar articles
-
Tracking COVID-19 Discourse on Twitter in North America: Infodemiology Study Using Topic Modeling and Aspect-Based Sentiment Analysis.J Med Internet Res. 2021 Feb 10;23(2):e25431. doi: 10.2196/25431. J Med Internet Res. 2021. PMID: 33497352 Free PMC article.
-
Unveiling Topics and Emotions in Arabic Tweets Surrounding the COVID-19 Pandemic: Topic Modeling and Sentiment Analysis Approach.JMIR Infodemiology. 2025 Feb 10;5:e53434. doi: 10.2196/53434. JMIR Infodemiology. 2025. PMID: 39928401 Free PMC article.
-
Unveiling public perceptions at the beginning of lockdown: an application of structural topic modeling and sentiment analysis in the UK and India.BMC Public Health. 2024 Oct 15;24(1):2832. doi: 10.1186/s12889-024-20160-1. BMC Public Health. 2024. PMID: 39407148 Free PMC article.
-
The Utilization of Natural Language Processing for Analyzing Social Media Data in Nursing Research: A Scoping Review.J Nurs Manag. 2024 Dec 30;2024:2857497. doi: 10.1155/jonm/2857497. eCollection 2024. J Nurs Manag. 2024. PMID: 40224767 Free PMC article.
-
Assessment of psychosocial aspects in adults in post-COVID-19 condition: the EURONET-SOMA recommendations on core outcome domains for clinical and research use.BMC Med. 2025 Feb 11;23(1):81. doi: 10.1186/s12916-025-03927-0. BMC Med. 2025. PMID: 39934846 Free PMC article. Review.
Cited by
-
Impact of the COVID-19 Pandemic and the 2021 National Institute for Health and Care Excellence Guidelines on Public Perspectives Toward Myalgic Encephalomyelitis/Chronic Fatigue Syndrome: Thematic and Sentiment Analysis on Twitter (Rebranded as X).J Med Internet Res. 2025 May 21;27:e65087. doi: 10.2196/65087. J Med Internet Res. 2025. PMID: 40397934 Free PMC article.
References
-
- Coronavirus (COVID-19) dashboard. World Health Organization. [2024-06-30]. https://covid19.who.int .
-
- Binka M, Klaver B, Cua G, Wong AW, Fibke C, Velásquez García HA, Adu P, Levin A, Mishra S, Sander B, Sbihi H, Janjua NZ. An elastic net regression model for identifying long COVID patients using health administrative data: a population-based study. Open Forum Infect Dis. 2022;9(12):ofac640. doi: 10.1093/ofid/ofac640.ofac640 - DOI - PMC - PubMed
-
- Long-term effects of COVID-19. Centers for Disease Control and Prevention. [2024-06-30]. https://www.cdc.gov/coronavirus/2019-ncov/long-term-effects/index.html#:... .
-
- Natarajan A, Shetty A, Delanerolle G, Zeng Y, Zhang Y, Raymont V, Rathod S, Halabi S, Elliot K, Shi JQ, Phiri P. A systematic review and meta-analysis of long COVID symptoms. Syst Rev. 2023;12(1):88. doi: 10.1186/s13643-023-02250-0. https://systematicreviewsjournal.biomedcentral.com/articles/10.1186/s136... 10.1186/s13643-023-02250-0 - DOI - DOI - PMC - PubMed
MeSH terms
LinkOut - more resources
Full Text Sources
Medical
