. 2025 Jan 6;222(1):e20240765.
doi: 10.1084/jem.20240765. Epub 2024 Dec 9.

A STAG2-PAXIP1/PAGR1 axis suppresses lung tumorigenesis

Affiliations

A STAG2-PAXIP1/PAGR1 axis suppresses lung tumorigenesis

Emily L Ashkin et al. J Exp Med. .

Abstract

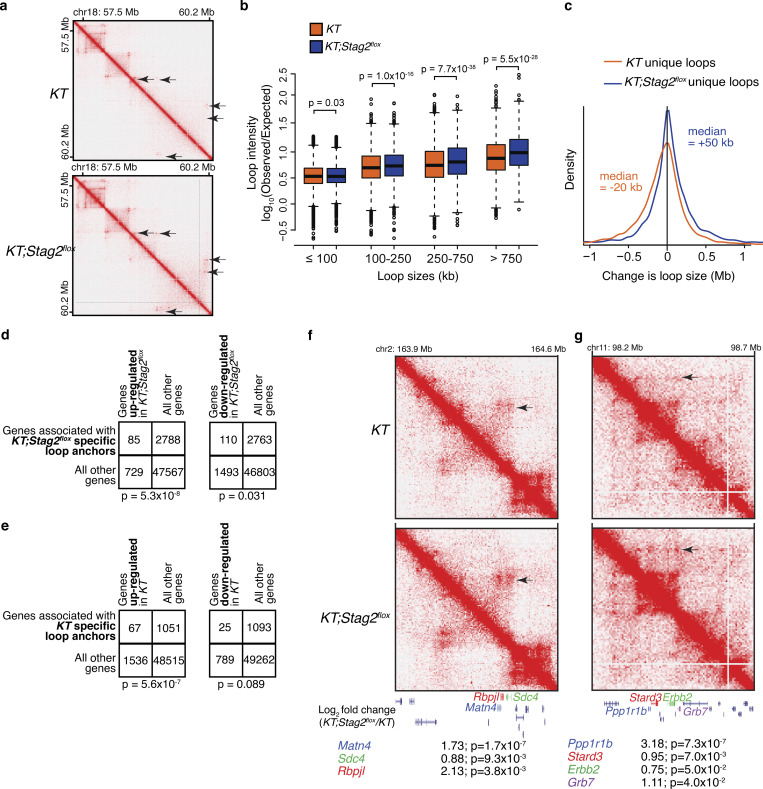
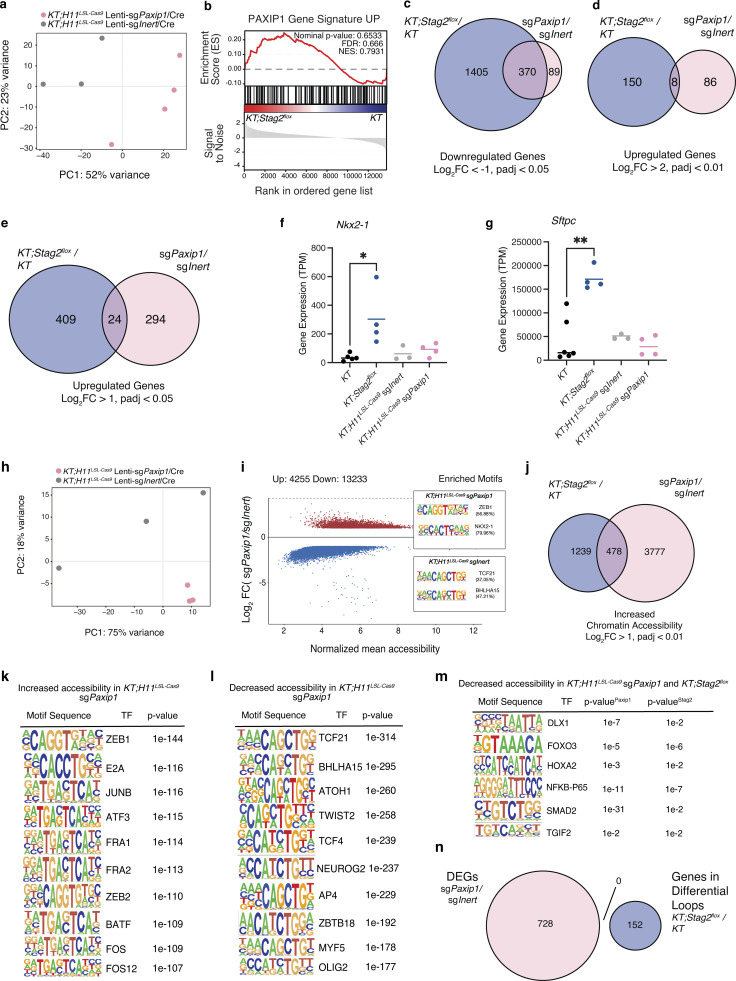
The cohesin complex is a critical regulator of gene expression. STAG2 is the most frequently mutated cohesin subunit across several cancer types and is a key tumor suppressor in lung cancer. Here, we coupled somatic CRISPR-Cas9 genome editing and tumor barcoding with an autochthonous oncogenic KRAS-driven lung cancer model and showed that STAG2 is uniquely tumor-suppressive among all core and auxiliary cohesin components. The heterodimeric complex components PAXIP1 and PAGR1 have highly correlated effects with STAG2 in human lung cancer cell lines, are tumor suppressors in vivo, and are epistatic to STAG2 in oncogenic KRAS-driven lung tumorigenesis in vivo. STAG2 inactivation elicits changes in gene expression, chromatin accessibility, and 3D genome conformation that impact the cancer cell state. Gene expression and chromatin accessibility similarities between STAG2- and PAXIP1-deficient neoplastic cells further relate STAG2-cohesin to PAXIP1/PAGR1. These findings reveal a STAG2-PAXIP1/PAGR1 tumor-suppressive axis and uncover novel PAXIP1-dependent and PAXIP1-independent STAG2-cohesin-mediated mechanisms of lung tumor suppression.


Conflict of interest statement

Disclosures: H.Y. Chang is a co-founder of Accent Therapeutics, Boundless Bio, Cartography Biosciences, and Orbital Therapeutics, and an advisor of 10x Genomics, Arsenal Bio, Chroma Medicine, Exai Bio, and Spring Discovery. M.M. Winslow and D.A. Petrov reported grants from the NIH (R01-CA231253, R01-CA234349, and P30-CA124435) during the conduct of the study and are founders and equity holders in Guide Oncology Inc. No other disclosures were reported.

Figures

Figure 1.
Figure 1.
Inactivation of Stag2 and heterozygous inactivation of the cohesin subunit Smc3 uniquely increase lung tumor growth. (a) Schematic of the cohesin complex with subunits labeled. (b) Tumor initiation with a pool of Lenti-U6BCsgRNA/Cre vectors. Genotype and number of mice are indicated. Tuba-seqUltra was performed on each tumor-bearing lung 15 wk after tumor initiation, followed by analyses to quantify tumorigenesis. (c) Relative mean tumor size (normalized to sgInert). Mean ± 95% confidence intervals are shown. (d) Relative tumor number (normalized to KT and sgInert). Mean ± 95% confidence intervals are shown. (e) Relative tumor number (normalized to KT and sgInert) versus relative mean tumor size (normalized to sgInert). (f) Tumor initiation with Adeno-Spc-Cre in KT and KT;Smc3flox/+ mice. Mouse number is indicated. (g) Representative fluorescence and histology images of lung lobes from the indicated genotypes of mice. Top scale bars, 5 mm, and bottom scale bars, 1 mm. (h) Lung weights from KT and KT;Smc3flox/+ mice. Each dot represents a mouse and the bar is the mean. Data are representative of two independent experiments. (i) Percentage of Tomato-positive tumor area detected via histology. Each dot represents a mouse, and the bar is the mean. *P value <0.05, **P value <0.01, via unpaired t test. Raw values and significance of each effect are shown in Table S1.
Figure 2.
Figure 2.
STAG2, PAXIP1, and PAGR1 effects are highly correlated in human cancer cell lines and PAXIP1/PAGR1 are tumor suppressive in KRAS-driven lung tumors in vivo. (a) Genes with the most correlated effects with STAG2 inactivation from the DepMap. Cell lines with STAG2 mutations were excluded. PAXIP1 and PAGR1 are colored bars. Core cohesin complex genes are white bars. (b and c) Gene effects for PAXIP1 and STAG2 inactivation (b) and for PAGR1 and STAG2 inactivation (c). Each dot represents a cell line with an oncogenic mutation at codons 12 or 13 of KRAS. Cell lines with STAG2 mutations were excluded. Lung adenocarcinoma (LUAD) cell lines are shown as black dots. Spearman’s r and Pearson rho for all cell lines and for LUAD cell lines are indicated. (d) Tumor initiation with a pool of barcoded Lenti-U6BCsgRNA/Cre Tuba-seqUltra vectors. Genotype and number of mice are indicated. Tuba-seqUltra was performed on each tumor-bearing lung 15 wk after tumor initiation, followed by analyses to quantify tumorigenesis. (e) Relative mean tumor size (normalized to sgInert). Mean ± 95% confidence intervals are shown. Dotted line indicates no effect. (f) Tumor sizes at the indicated percentiles for tumors with sgRNA targeting Stag2, Paxip1, or Pagr1 (normalized to sgInert) in KT;H11LSL-Cas9 mice. Each gene was targeted with three sgRNAs. Error bars indicate 95% confidence intervals. Dotted line indicates no effect. Data represents one replicate of two independent experiments. (g) Tumor initiation with the indicated Lenti-sgRNA/Cre vectors in separate cohorts of KT and KT;H11LSL-Cas9 mice. Number of mice in each group is indicated. Tumor burden was quantified 15 wk after tumor initiation. (h) Representative brightfield and fluorescence images of lung lobes and histology from the indicated groups of mice. Top scale bars and middle scale bars, 5 mm. Lower scale bars, 500 μm. (i) Lung weights of mice in each group. Each dot represents a mouse and the bar is the mean. ****P value <0.0001 by unpaired t test. Data represent one replicate of two independent experiments. Raw values and significance of each effect are shown in Table S2.
Figure S1.
Figure S1.
The effect of STAG2 inactivation is highly correlated with that of PAXIP1 and PAGR1 inactivation in human cancer cell lines, and genetic interactions with STAG2 are robust to different measures of tumorigenesis and tumor growth in oncogenic Kras lung cancer in vivo. (a and b) Gene knockout effects for PAXIP1 and STAG2 inactivation (a) and for PAGR1 and STAG2 inactivation (b). Each dot represents a cell line. Cell lines with STAG2 mutation were excluded. Spearman’s r and Pearson rho are indicated. (c) Bell curve showing the frequency of Spearman’s correlations across all pairwise comparisons in DepMap. STAG2-PAGR1 and STAG2-PAXIP1 correlations are indicated. (d and e) Genes with the highest Spearman’s correlation with the effect of STAG2 inactivation from DepMap. Data from cell lines with oncogenic mutations at codons 12 or 13 of KRAS (d) and lung adenocarcinoma cell lines with oncogenic mutations at codons 12 or 13 of KRAS (e). Cell lines with STAG2 mutation were excluded. PAXIP1 and PAGR1 are colored bars. Core cohesin complex genes are white bars. (f and g) Gene effects for PAXIP1 and STAG2 inactivation (f) and for PAGR1 and STAG2 inactivation (g) in AML. Each dot represents a cell line. Cell lines with STAG2 mutations were excluded. Spearman’s r and Pearson rho are indicated. (h and i) Tables indicating Spearman’s r and Pearson rho for PAXIP1 gene effect (h) and for PAGR1 gene effect (i) in bladder cancer and Ewing’s sarcoma. Cell lines with STAG2 mutations were excluded. (j) Relative tumor number (normalized to KT and sgInert). Mean ± 95% confidence intervals are shown. Dotted line indicates no effect. Raw values and significance of each effect are shown in Table S2 (j). (k) Western blot on sorted neoplastic cells from KT;H11LSL-Cas9 mice with tumors initiated with the indicated Lenti-sgRNA/Cre vectors. Data represents one replicate of three independent experiments. (l) Tumor sizes at the indicated percentiles for tumors with sgRNA targeting Setd2, Stk11, or Tsc1 (normalized to sgInert) in KT;H11LSL-Cas9 and KT;H11LSL-Cas9;Stag2flox mice. Each gene was targeted with three sgRNAs. Error bars indicate 95% confidence intervals. Dotted line indicates no effect. (m) Tumor sizes at the indicated percentiles for tumors with sgRNA targeting Paxip1 or Pagr1 (normalized to sgInert) in KT;H11LSL-Cas9 and KT;H11LSL-Cas9;Stag2flox mice. Each gene was targeted with three and six sgRNAs, respectively. Error bars indicate 95% confidence intervals. Dotted line indicates no effect. (n) Comparison of relative tumor number for tumors with sgRNAs targeting for Stag1, Stag2, or Pole2 in KT;H11LSL-Cas9 mice compared to KT;H11LSL-Cas9;Stag2flox mice. Mean ± 95% confidence intervals are shown. Raw values and significance of each effect are shown in Table S4 (l–n). Source data are available for this figure: SourceData FS1.
Figure 3.
Figure 3.
Genetic interactions with STAG2 include modification of overall tumor suppression and functional dependency with PAXIP1 and PAGR1. (a) List of candidate gene criteria for a pool of 468 barcoded Lenti-sgRNA/Cre vectors. (b) Tumor initiation with Lenti-U6BC-sgRNA/Cre vectors in KT;H11LSL-Cas9, KT;H11LSL-Cas9;Stag2flox, and KT mice. Number of mice in each group is indicated. Sequencing was performed on each tumor-bearing lung 14 wk after tumor initiation, followed by analysis to quantify tumorigenesis. (c) Bar plot with percent of genes in each candidate category with differential effects between KT;H11LSL-Cas9 and KT;H11LSL-Cas9;Stag2flox. (d) Relative mean tumor size of tumors with sgRNAs targeting Stag2 (normalized to sgInert) in KT;H11LSL-Cas9 mice compared to KT;H11LSL-Cas9;Stag2flox mice. Mean ± 95% confidence intervals are shown. (e) Relative mean tumor size of tumors with sgRNAs targeting Setd2, Stk11, or Tsc1 (normalized to sgInert) in KT;H11LSL-Cas9 mice compared with KT;H11LSL-Cas9;Stag2flox mice. Mean ± 95% confidence intervals are shown. (f) Relative mean tumor size of tumors with sgRNAs targeting Paxip1 or Pagr1 (normalized to sgInert) in KT;H11LSL-Cas9 mice compared with KT;H11LSL-Cas9;Stag2flox mice. Mean ± 95% confidence intervals are shown. (g) Comparison of average relative tumor number for sgRNAs targeting Stag1, Stag2, Pole2 (essential gene), or Inerts in KT;H11LSL-Cas9 mice and KT;H11LSL-Cas9;Stag2flox mice. Mean ± 95% confidence intervals are shown. Raw values and significance of each effect are shown in Table S4. Data for KT;H11LSL-Cas9 and KT mice represent one replicate of two independent experiments.
Figure 4.
Figure 4.
STAG2 inactivation increases tumor-related metabolic processes and cell differentiation. (a) Schematic of tumor initiation in KT and KT;Stag2flox mice. Mice grew tumors until 8 wk to represent large atypical adenomatous hyperplasia and small adenomas and 16 wk to represent larger solid adenomas and early adenocarcinomas (Marjanovic et al., 2020). Outline of tumor cell sorting and sample preparation for bulk RNA-seq and bulk ATAC-seq. (b) Upregulated and downregulated genes (n = 2,545 genes) in KT relative to KT;Stag2flox tumors (absolute value of log2 fold change (|log2FC|) > 1, FDR < 0.01). (c and d) GSEA pathways enriched in KT;Stag2flox relative to KT tumors (c) and enriched in KT relative to KT;Stag2flox tumors (d). (e and f) GO Term Gene Count Analysis with ClusterProfiler and EMBL-EBI GO:Term Category Analysis established pathways enriched from upregulated genes for KT;Stag2flox/KT mice (e) and from down-regulated genes for KT;Stag2flox/KT mice (f). (g and h) ES versus NKX2-1 gene expression (TPM) from single sample GSEA (ssGSEA) for KPT and KT samples (Chuang et al., 2017) for the gene sets from genes upregulated in KT;Stag2flox versus KT (g) and genes downregulated in KT;Stag2flox versus KT (h). (i) Rank correlation of chromatin accessibility across KT and KT;Stag2flox samples. Samples cluster into two distinct groups. (j) Differential accessibility across 3,576 significant peaks in KT and KT;Stag2flox mice (three mice/group). The x-axis represents the log2 mean accessibility per peak and the y-axis represents the log2 fold change in accessibility. Colored points are significant (|log2FC| > 1, FDR < 0.05). Red points are increased chromatin accessibility in KT;Stag2flox accompanied by transcription factor hypergeometric motif enrichment in KT;Stag2flox, and blue points are decreased chromatin accessibility in KT;Stag2flox accompanied by transcription factor hypergeometric motif enrichment in KT tumors. (k) ATAC-seq signal tracks for the Sftpd gene locus in neoplastic cells from KT and KT;Stag2flox mice. (l) Comparison of log2 fold change for KT and KT;Stag2flox mice for top genes from both bulk RNA-seq and bulk ATAC-seq. r = 0.311, P < 2.2 × 10⁻¹⁶.
Figure S2.
Figure S2.
Validation of STAG2 inactivation, clustering of KT and KT;Stag2 flox samples, gene expression of surfactant genes, and differential accessibility regulated by STAG2. (a) Schematic of tumor initiation with Adeno-Spc-Cre with different viral titers in KT and KT;Stag2flox mice to generate tumor samples to analyze at 8 and 16 wk after tumor initiation. (b) Lung weights of mice in each group. Each dot represents a mouse and the bar is the mean. (c) Number of DNA nucleotide counts at Chromosome X locus in Exon 8 of STAG2 in each group. Note that this region is within floxed exon. Mean ± SEM is shown. (d)Stag2 RNA expression in TPM via RNA-seq in each group. Bar is the standard error. Mean ± SEM is shown. (e) PCA of KT;Stag2flox and KT tumors processed with RNA-seq libraries at 8 and 16 wk clustered by genotype. (f and g) Gene expression (TPM) for Nkx2-1 (f) and Sftpc (g) for KT and KT;Stag2flox 8 and 16 wk. **P value <0.01, *P value <0.1 by unpaired t test. Each dot represents a mouse, and the bar is the mean. (h) Quantification of NKX2-1 expression in KT;Stag2flox (n = 2 mice) and KT (n = 2 mice) tumors at 8 wk after initiation. Tumor NKX2-1 expression quantified by comparison to NKX2-1 expression in adjacent normal tissue. Tumor number quantified labeled in graph. Mean ± SD is shown (P value <0.001 by ordinary one-way ANOVA). (i) PCA of KT and KT;Stag2flox tumors processed with ATAC-seq libraries at 16 wk clustered by genotype. (j) ATAC-seq signal tracks for the Myct1 gene locus in tumors from KT and KT;Stag2flox mice. (k) Motif sequences and corresponding P values for transcription factors with motif enrichment in regions with increased accessibility in cancer cells from KT;Stag2flox mice. (l) Motif sequences and corresponding P values for transcription factors with motif enrichment in regions with decreased accessibility in cancer cells from KT;Stag2flox mice.
Figure 5.
Figure 5.
Stag2 deficiency impacts overall chromatin looping with effects on gene expression. (a) Schematic of tumor initiation with Adeno-Spc-Cre in KT and KT;Stag2flox mice. Outline of tumor cell sorting, crosslinking, and sample preparation for Hi-C. (b) Venn diagram of loops in KT and KT;Stag2flox samples. (c) Venn diagram of loop anchors in KT and KT;Stag2flox samples. (d) Sizes for KT unique loops, common loops, and KT;Stag2flox unique loops. Boxes show median ± interquartile range. Whiskers show standard error. P values (Wilcoxon rank test) are shown. (e) Loops in KT and KT;Stag2flox samples were compared and sorted into indicated categories based on their unique and shared loop anchors. (f) Differences in chromatin looping and gene expression (from RNA-seq data, log2 fold change [KT;Stag2flox/KT]; P value) for Ereg and Fgfr2.
Figure S3.
Figure S3.
KT and KT;Stag2 flox samples contain both unique and common DNA loops and DNA anchors that correlate with gene expression but not chromatin accessibility. (a) Normalized contact matrices in KT (top) and KT;Stag2flox (bottom) neoplastic cells. Contact matrices were visualized in Juicebox with the same color scale. Arrows indicate novel or stronger loop contacts in KT;Stag2flox. (b) Comparison of loop intensity (log10[observed/expected]) of the indicated loop sizes between all loops in KT and KT;Stag2flox samples. Boxes show median ± interquartile range. Whiskers show standard error. P values (Wilcoxon rank test) are shown. (c) Change in loop size between the KT;Stag2flox unqiue loops and the common loops or KT unqiue loops with which they share one anchor (blue). Change in loop size between KT unique loops and the common loops or KT;Stag2flox unqiue loops with which they share one anchor (orange). (d) Number of genes associated with KT;Stag2flox unique loops that are upregulated (left) or downregulated (right) in KT;Stag2flox samples versus all other genes that are and are not associated with KT;Stag2flox unique loops. P value (chi-square test) is shown. (e) Number of genes associated with KT unique loops that are upregulated (left) or down-regulated (right) in KT samples versus all other genes that are and are not associated with KT unique loops. P value (chi-square test) is shown. (f and g) Differences in chromatin looping and gene expression (from RNA-seq data, log2 fold change [KT;Stag2flox/KT]; P value) of several differentially expressed genes proximal to unique anchor sites.
Figure 6.
Figure 6.
PAXIP1 and STAG2-cohesin mechanisms of tumor suppression are conserved. (a) Schematic of tumor initiation with Lenti-sgPaxip1/Cre or Lenti-sgInert/Cre in KT;H11LSL-Cas9 mice (three to four mice/group). Mice grew tumors for 15 wk. Outline of tumor cell sorting and sample preparation for bulk RNA-seq and bulk ATAC-seq. (b) Upregulated and downregulated genes (n = 540 genes) in KT;H11LSL-Cas9 sgInert relative to KT;H11LSL-Cas9 sgPaxip1 tumors (|log2FC| > 1, Padj < 0.01). (c) Positive correlation between KT;Stag2flox/KT (log2FC) and KT;H11LSL-Cas9 sgPaxip1/KT;H11LSL-Cas9 sgInert (log2FC). Each dot is a gene. Dots |log2FC| > 1, Padj < 0.05 in both are maroon, dots |log2FC| > 1, Padj < 0.05 in KT;H11LSL-Cas9 sgPaxip1/KT;H11LSL-Cas9 only are pink, and dots |log2FC| > 1, Padj < 0.05 in KT;Stag2flox/KT are dark blue. Dots |log2FC| > 1, Padj < 0.05 in neither are grey. (d) Downregulated PAXIP1 gene signature enrichment in rank-ordered gene list for KT versus KT;Stag2flox. (e) Venn diagram of shared downregulated genes (log2FC < −2, Padj < 0.01) between KT;Stag2flox/KT and KT;H11LSL-Cas9 sgPaxip1/KT;H11LSL-Cas9 sgInert. (f) GO term gene count analysis with ClusterProfiler and EMBL-EBI GO:term category analysis established from conserved downregulated pathways between KT;Stag2flox/KT and KT;H11LSL-Cas9 sgPaxip1/KT;H11LSL-Cas9 sgInert. (g) Venn diagram of shared regions of decreased chromatin accessibility (log2FC < −1, Padj < 0.01) between KT;Stag2flox/KT and KT;H11LSL-Cas9 sgPaxip1/KT;H11LSL-Cas9 sgInert. (h) Accessibility z-score for regions with significantly different accessibility in both KT;Stag2flox/KT and KT;H11LSL-Cas9 sgPaxip1/KT;H11LSL-Cas9 sgInert ATAC-seq samples (|log2 FC| > 1, Padj < 0.01) that are also associated with genes with significantly different expression in both KT;Stag2flox/KT and KT;H11LSL-Cas9 sgPaxip1/KT;H11LSL-Cas9 sgInert neoplastic cells (|log2 FC| > 1, Padj < 0.01). Each row is a differentially accessible region. (i) Enrichment for regions with significant decreased accessibility in KT;Stag2flox/KT (|log2FC| > 1, Padj < 0.01) samples associated with genes with significantly decreased expression in both KT;Stag2flox/KT and KT;H11LSL-Cas9 sgPaxip1/KT;H11LSL-Cas9 sgInert neoplastic cells (log2FC < −1, Padj < 0.01). Changes in accessibility and expression in KT;Stag2flox/KT is shown. Each dot is a differentially accessible region. (j) Model of lung tumor suppression regulated by STAG2-cohesin-PAXIP1/PAGR1 axis.
Figure S4.
Figure S4.
PAXIP1 and STAG2-cohesin regulation of gene expression and chromatin accessibility is conserved in downregulation but not upregulation of genes. (a) PCA of RNA-seq on KT;H11LSL-Cas9 sgInert and KT;H11LSL-Cas9 sgPaxip1 tumors. (b) Upregulated PAXIP1 gene signature enrichment in rank-ordered gene list for KT versus KT;Stag2flox. (c–e) Venn diagram of shared downregulated genes (log2FC < −1, Padj < 0.05) (c), shared upregulated genes (log2FC > 2, Padj < 0.01) (d), and shared upregulated genes (log2FC > 1, Padj < 0.05) (e) between KT;Stag2flox/KT and KT;H11LSL-Cas9 sgPaxip1/KT;H11LSL-Cas9 sgInert. (f and g) Gene expression (TPM) for Nkx2-1 (f) and Sftpc (g) in neoplastic cells from tumors from KT, KT;Stag2flox, KT;H11LSL-Cas9 sgInert, and KT;H11LSL-Cas9 sgPaxip1 in mice. Each dot is an RNA-seq sample, and the bar is the mean. **P value <0.01, *P value <0.1 by unpaired t test (KT and KT;Stag2flox data are same as Fig. S2). (h) PCA of KT;H11LSL-Cas9 sgInert and KT;H11LSL-Cas9 sgPaxip1 tumors processed with ATAC-seq libraries. (i) Differential accessibility across 17,488 significant peaks in KT;H11LSL-Cas9 sgInert and KT;H11LSL-Cas9 sgPaxip1 mice (three mice/group). The x-axis represents the log2mean accessibility per peak and the y-axis represents the log2FC in accessibility. Colored dots are significant (log2FC > |1|, FDR < 0.05). Red dots are increased chromatin accessibility in KT;H11LSL-Cas9 sgPaxip1 accompanied by transcription factor hypergeometric motif enrichment in KT;H11LSL-Cas9 sgPaxip1, and blue dots are decreased chromatin accessibility in KT;H11LSL-Cas9 sgPaxip1 accompanied by transcription factor hypergeometric motif enrichment in KT;H11LSL-Cas9 sgInert. (j) Venn diagram of shared regions of increased chromatin accessibility (log2FC > 1, Padj < 0.01) between KT;Stag2flox/KT and KT;H11LSL-Cas9 sgPaxip1/KT;H11LSL-Cas9 sgInert. (k and l) Motif sequences and corresponding P values for transcription factors with motif enrichment in regions with increased accessibility in KT;H11LSL-Cas9 sgPaxip1 (k) and with decreased accessibility in KT;H11LSL-Cas9 sgPaxip1 (l). (m) Motif sequences and corresponding P values for transcription factors with motif enrichment in regions with decreases accessibility in KT;H11LSL-Cas9 sgPaxip1 and KT;Stag2flox. (n) Venn diagram of differentially expressed genes regulated by KT;H11LSL-Cas9 sgPaxip1/KT;H11LSL-Cas9 sgInert (|log2 FC| >1, Padj < 0.05; RNA-seq) versus genes found in differential loops regulated by KT;Stag2flox/KT (HiC).
Figure S5.
Figure S5.
Summary of the in vivo genetic experiments as they related to the essential role of cohesin in general and the specific tumor suppressive function of STAG2-cohesin and PAXIP1/PAGR1, as well as a summary of the most parsimonious model of STAG2-cohesin and PAXIP1/PAGR1 mediated tumor suppression and mutations in PAXIP1 and PAGR1 and downregulation of PAXIP1 mRNA expression in a subset of AML s. (a) Interpretations of results from Figs. 1, 2, and 3 describing the distinct phenotypes controlled by STAG2- and STAG1-cohesin, homozygous and heterozygous inactivation of cohesin components, and the role of PAXIP1 on lung tumorigenesis in vivo. The lung tumor suppressive effect of Stag2 is well established in oncogenic KRAS-driven lung tumors (Cai et al., 2021; Blair et al., 2023), confirmed in the current study, and extended to lung cancer driven by other oncogenes (Blair et al., 2023). The compensation of STAG1 and STAG2 in the essential functions of cohesin, in general, is well established in cell lines (Arruda et al., 2020; van der Lelij et al., 2017; Canudas and Smith, 2009) and confirmed in lung cancer by our in vivo studies, including the genetic epistasis between Stag1 and Stag2. While homozygous inactivation of each core and auxiliary cohesin component greatly reduced lung tumorigenesis, heterozygous inactivation of Smc3 using a floxed allele increases tumorigenesis. This likely explains the mutations in cohesin components in human cancer and extends the importance of dysregulation of this complex to a much larger fraction of lung adenocarcinomas. Finally, while Paxip1 or Pagr1 inactivation increased lung tumorigenesis, inactivation of either gene did not reduce tumorigenesis of Stag2-deficient tumors, as would have been expected if Paxip1/Pagr1 were also involved in the essential cohesin function. (b) Multiple models could have explained how STAG2-cohesin and the PAXIP1/PAGR1 complex cooperate to suppress lung tumorigenesis. However, our genetic epistasis data (Fig. 3) and molecular analyses (Figs. 4 and 5) are most consistent with Model 3 in which the major role of PAXIP1/PAGR1 is to work with STAG2-cohesin to regulate a subset of genes that are controlled by STAG2-cohesin. (c) Oncoprint of AMLs from TCGA accessed through cBioPortal. 190 samples with mutation and copy number data. Mutation type is indicated. (d) mRNA expression of PAXIP1 in AMLs from TCGA accessed through cBioPortal. 165 samples with mutation, copy number, and gene expression data. Sample were split based on putative copy number of PAXIP1. Each dot is a sample. Note low expression in a subset of sample with likely unaltered DNA copy number (diploid samples). (e) Oncoprint of AMLs from DCFI-Oncopanel-3 samples from GENIE accessed through cBioPortal. 80 samples with mutation data. SMC1A and PAGR1 were not profiled. Mutation type is indicated.
Scheme 1.
Scheme 1.
Schematic of Tuba-seq Ultra vector design and tumor initiation. U6-integrated diverse BC (U6BC) contains a 21-nucleotide region at the 3′ end of the bovine U6 promoter immediately downstream of the TATA box. The sgRNA-Pool/Cre consists of barcoded lenti-sgRNA/Cre vectors that contain three sgRNAs targeting each gene of interest, safe cutting “inert” sgRNAs, and sgRNAs targeting an essential gene. KT;H11LSL-Cas9 are transduced with the lenti- U6BCsgRNA-Pool/Cre. 14–15 wk after tumor initiation, we extract DNA from bulk tumor-bearing lungs and used Tuba-seqUltra to quantify the impact of targeting each regulator on tumor growth, and tumor initiation for each tumor of each genotype.

Update of

References

    1. AACR Project GENIE Consortium . 2017. AACR Project GENIE: Powering precision medicine through an international consortium. Cancer Discov. 7:818–831. 10.1158/2159-8290.CD-17-0151 - DOI - PMC - PubMed
    1. Adane, B., Alexe G., Seong B.K.A., Lu D., Hwang E.E., Hnisz D., Lareau C.A., Ross L., Lin S., Dela Cruz F.S., et al. . 2021. STAG2 loss rewires oncogenic and developmental programs to promote metastasis in Ewing sarcoma. Cancer Cell. 39:827–844.e10. 10.1016/j.ccell.2021.05.007 - DOI - PMC - PubMed
    1. Alonso-Gil, D., and Losada A.. 2023. NIPBL and cohesin: New take on a classic tale. Trends Cell Biol. 33:860–871. 10.1016/j.tcb.2023.03.006 - DOI - PubMed
    1. Aquila, L., Ohm J., and Woloszynska-Read A.. 2018. The role of STAG2 in bladder cancer. Pharmacol. Res. 131:143–149. 10.1016/j.phrs.2018.02.025 - DOI - PubMed
    1. Arruda, N.L., Carico Z.M., Justice M., Liu Y.F., Zhou J., Stefan H.C., Dowen J.M., Lee J.T., and Joyce E.F.. 2020. Distinct and overlapping roles of STAG1 and STAG2 in cohesin localization and gene expression in embryonic stem cells. Epigenetics Chromatin. 13:32. 10.1186/s13072-020-00353-9 - DOI - PMC - PubMed