Through the fog: Systematic review and meta-analysis of the prevalence and associated factors of poor post-operative visual outcome of cataract surgery in Sub-Saharan Africa
- PMID: 39652539
- PMCID: PMC11627423
- DOI: 10.1371/journal.pone.0315263
Through the fog: Systematic review and meta-analysis of the prevalence and associated factors of poor post-operative visual outcome of cataract surgery in Sub-Saharan Africa
Abstract
Background: Cataract, despite being treatable, persists to have a devastating impact on people's health and livelihoods all over the world. In Sub-Saharan Africa (SSA), 1.7 million people are blind and 6.94 million are visually impaired due to cataract. Also, Cataract surgery outcomes remain below the World Health Organization (WHO) recommendations in SSA. Hence, this review aimed to estimate the pooled prevalence and associated factors of poor post-operative visual outcome in SSA.
Method: An intensive literature search was performed from PubMed, Google Scholar, EMBASE, HINARI, Scopus, and Web of Sciences. Data were extracted by using a pre-tested and standardized data extraction format and analyzed by using STATA 17 statistical software. I2 tests to appraise the heterogeneity across the included studies, a random-effect model to estimate the pooled prevalence, and a sub-group analysis to discern the viable source of heterogeneity were executed. Potential publication bias was also assessed by funnel plot, Egger's weighted correlation, and Begg's regression. The odds ratio with its 95% confidence was used to reckon the association between the prevalence and factors.
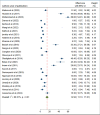
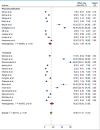
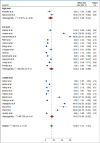
Result: From 201 identified studies, 25 articles were included. The pooled prevalence of poor post-operative visual outcome of cataract surgery in SSA was 14.56% (95% CI 11.31, 17.81). The presence of intra-operative complications (AOR = 2.99, 95% CI: 1.79, 4.98) and the presence of post-operative complications (AOR = 3.56, 95% CI: 2.86, 4.43) were statistically significant with the pooled poor post-operative visual outcome. According to the subgroup analysis, the pooled prevalence of poor post-operative visual outcome was found lower in phacoemulsification, with a sub-pooled prevalence of 12.32% (95% CI 7.89, 16.74) compared to incisional with a sub-pooled prevalence of 16.28% (95% CI 10.98, 21.59).
Conclusion: This meta-analysis revealed that a substantial proportion of cataract-operated patients had poor post-operative visual outcome. The presence of intra-operative complications and post-operative complications were independent predictors of poor post-operative visual outcome. Therefore, improvement of post-operative visual outcome through decreasing intra-operative complications, managing post-operative complications, and investing in specialized training and equipment for ophthalmic surgeons are pivotal and need significant emphasis.
Copyright: © 2024 Asmare et al. This is an open access article distributed under the terms of the Creative Commons Attribution License, which permits unrestricted use, distribution, and reproduction in any medium, provided the original author and source are credited.
Conflict of interest statement
The authors have declared that no competing interests exist.
Figures


References
-
- Ahmad KS. Vision loss, access to eye care and Quality of cataract surgery in a marginalised population: The Karachi Marine Fishing Communities Eye and General Health Survey.Doctoral dissertation, UNSW Sydney. 2013;110(9):25–35.
-
- Berhane Y, Worku A, Bejiga A, Adamu L, Alemayehu W, Bedri A, et al.. Prevalence and causes of blindness and low vision in Ethiopia. Ethiopian Journal of Health Development. 2007;21(3):204–10.
Publication types
MeSH terms
LinkOut - more resources
Full Text Sources
Medical
Research Materials

