

A longitudinal study of alcohol consumption among adults in Victoria, Australia during the COVID-19 pandemic
- PMID: 39652557
- PMCID: PMC11627359
- DOI: 10.1371/journal.pone.0313599
A longitudinal study of alcohol consumption among adults in Victoria, Australia during the COVID-19 pandemic
Abstract
Objectives: Whilst public health measures were effective in reducing COVID-19 transmission, unintended negative consequences may have occurred. This study aims to assess changes alcohol consumption and the heavy episodic drinking (HED) during the pandemic.
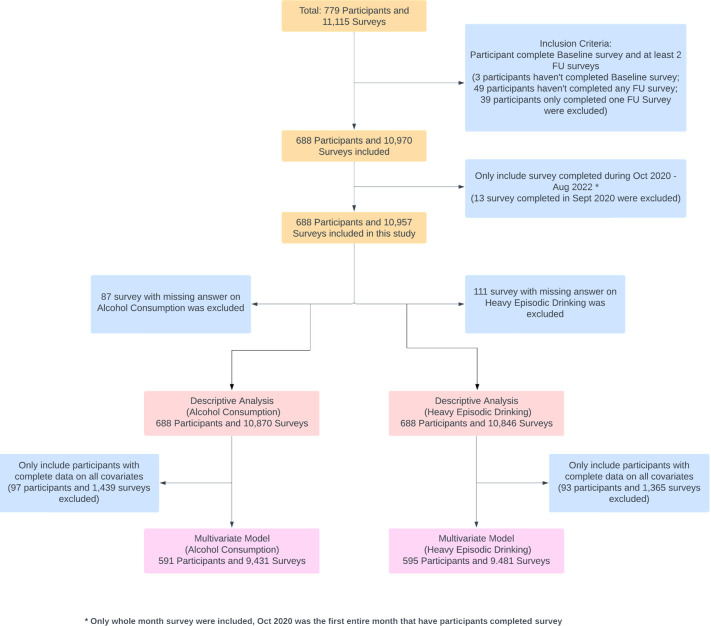
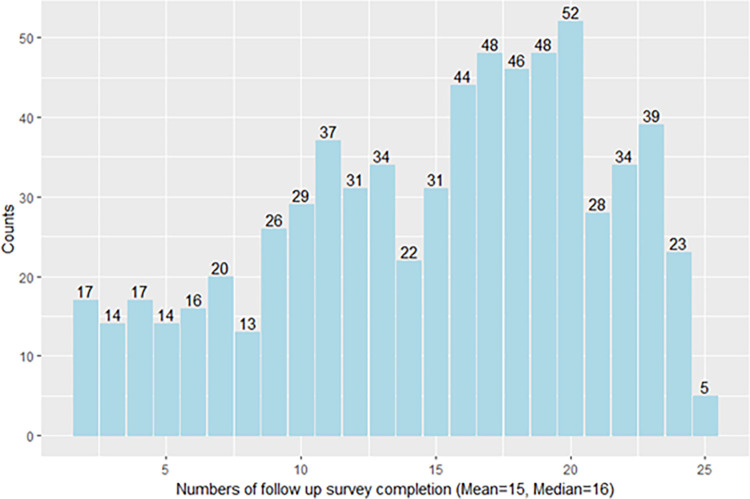
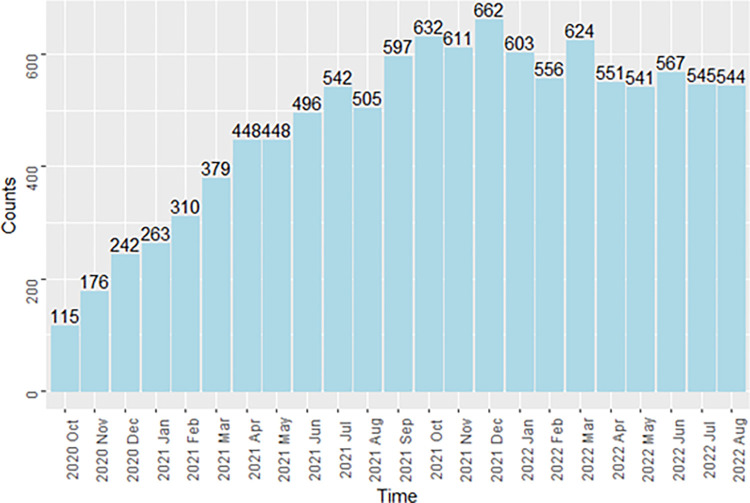
Methods: Data were from the Optimise Study, a longitudinal cohort of Australian adults September 2020-August 2022 that over-sampled priority populations at higher risk of contracting COVID-19, developing severe COVID-19 or experiencing adverse consequences of lockdowns. Frequency of alcohol consumption (mean number of days per week) and past-week HED were self-reported. Generalised linear models estimated the association between time and (1) the frequency of alcohol consumption and (2) heavy episodic drinking.
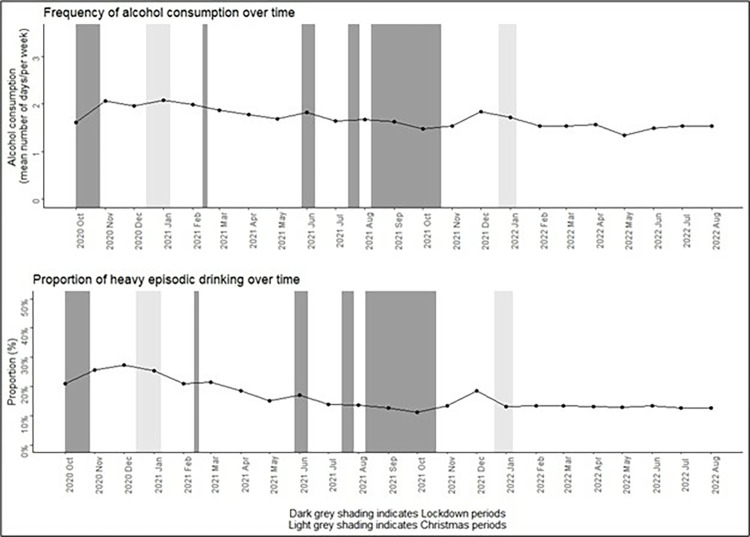
Results: Data from 688 participants (mean age: 44.7 years, SD:17.0; 72.7% female) and 10,957 surveys were included. Mean days of alcohol consumption per week decreased from 1.92 (SD: 1.92) in 2020 to 1.54 (SD:1.94) in 2022. The proportion of participants reporting HED decreased from 25.4% in 2020 to 13.1% in 2022. During two lockdown periods, known as "lockdown five", (OR:0.65, 95%CI [0.47,0.90]) and "lockdown six" (OR:0.76, 95%CI [0.67,0.87]), participants were less likely to report HED.
Conclusions: Participants alcohol drinking frequency and HED decreased during the pandemic. This study provides a strong description of alcohol consumption during the pandemic and suggests that lockdowns did not have the unintended consequences of increased alcohol consumption.
Copyright: © 2024 Ke et al. This is an open access article distributed under the terms of the Creative Commons Attribution License, which permits unrestricted use, distribution, and reproduction in any medium, provided the original author and source are credited.
Conflict of interest statement
The authors have declared that no competing interests exist.
Figures
References
-
- Mathieu E, Ritchie H, Rodés-Guirao H, Appel C, Giattino C, Hasell J, et al. Policy Responses to the Coronavirus Pandemic: Our World in Data; 2020. [Available from: https://ourworldindata.org/coronavirus.
-
- Nally A. How Victoria’s coronavirus lockdown across 10 Melbourne postcodes will work: ABC News; 2020. [Available from: https://www.abc.net.au/news/2020-06-30/victorias-coronavirus-outbreak-pr....
-
- Boaz J. Melbourne passes Buenos Aires’ world record for time spent in COVID-19 lockdown: ABC News; 2021. [Available from: https://www.abc.net.au/news/2021-10-03/melbourne-longest-lockdown/100510710.
-
- Miller M, Mojica-Perez Y, Callinan S, Livingston M. A timeline of alcohol-related restrictions during the COVID-19 pandemic: Centre for Alcohol Policy Research, La Trobe University, Melbourne, Australia; 2020. [Available from: https://www.latrobe.edu.au/__data/assets/pdf_file/0006/1324149/A-timelin....
MeSH terms
LinkOut - more resources
Full Text Sources
Medical
Miscellaneous
