Screening of potential regulatory genes in carotid atherosclerosis vascular immune microenvironment
- PMID: 39652562
- PMCID: PMC11627393
- DOI: 10.1371/journal.pone.0307904
Screening of potential regulatory genes in carotid atherosclerosis vascular immune microenvironment
Abstract
Background: Immune microenvironment is one of the essential characteristics of carotid atherosclerosis (CAS), which cannot be reversed by drug therapy alone. Thus, there is a pressing need to develop novel immunoregulatory strategies to delay this pathological process that drives cardiovascular-related diseases. This study aimed to detect changes in the immune microenvironment of vascular tissues at various stages of carotid atherosclerosis, as well as cluster and stratify vascular tissue samples based on the infiltration levels of immune cell subtypes to distinguish immune phenotypes and identify potential hub genes regulating the immune microenvironment of carotid atherosclerosis.
Materials and methods: RNA sequencing datasets for CAS vascular tissue and healthy vascular tissue (GSE43292 and GSE28829) were downloaded from the Gene Expression Omnibus (GEO) database. To begin, the immune cell subtype infiltration level of all samples in both GSE43292 and GSE28829 cohorts was assessed using the ssGSEA algorithm. Following this, consensus clustering was performed to stratify CAS samples into different clusters. Finally, hub genes were identified using the maximum neighborhood component algorithm based on the construction of interaction networks, and their diagnostic efficiency was evaluated.
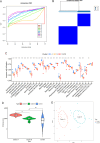
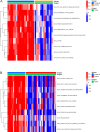
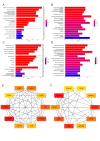
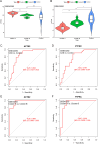
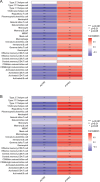
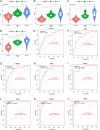
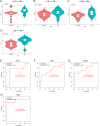
Results: Compared to the controls, a higher number of immune cell subtypes were enriched in CAS samples with higher immune scores in the GSE43292 cohort. Advanced CAS was characterized by high immune cell infiltration, whereas early CAS was characterized by low immune cell infiltration in the GSE28829 cohort. Moreover, CAS progression may be related to the immune response pathway. Biological processes associated with muscle cell development may impede the progression of CAS. Finally, the hub genes PTPRC, ACTN2, ACTC1, LDB3, MYOZ2, and TPM2 had satisfactory efficacy in the diagnosis and prediction of high and low immune cell infiltration in CAS and distinguishing between early and advanced CAS samples.
Conclusion: The enrichment of immune cells in vascular tissues is a primary factor driving pathological changes in CAS. Additionally, CAS progression may be related to the immune response pathway. Biological processes linked to muscle cell development may delay the progression of CAS. PTPRC, ACTN2, ACTC1, LDB3, MYOZ2, and TPM2 may regulate the immune microenvironment of CAS and participate in the occurrence and progression of the disease.
Copyright: © 2024 Zhang et al. This is an open access article distributed under the terms of the Creative Commons Attribution License, which permits unrestricted use, distribution, and reproduction in any medium, provided the original author and source are credited.
Conflict of interest statement
The authors declare that they have no competing interests.
Figures




Similar articles
-
Integrated analysis and exploration of potential shared gene signatures between carotid atherosclerosis and periodontitis.BMC Med Genomics. 2022 Oct 31;15(1):227. doi: 10.1186/s12920-022-01373-y. BMC Med Genomics. 2022. PMID: 36316672 Free PMC article.
-
Identification and validation of three diagnostic autophagy-related genes associated with advanced plaques and immune cell infiltration in carotid atherosclerosis based on integrated bioinformatics analyses.PeerJ. 2024 Nov 22;12:e18543. doi: 10.7717/peerj.18543. eCollection 2024. PeerJ. 2024. PMID: 39588003 Free PMC article.
-
Comprehensive analysis of autophagy-related gene expression profiles identified five gene biomarkers associated with immune infiltration and advanced plaques in carotid atherosclerosis.Orphanet J Rare Dis. 2023 Mar 23;18(1):66. doi: 10.1186/s13023-023-02660-2. Orphanet J Rare Dis. 2023. PMID: 36959587 Free PMC article.
-
Potential genes and pathways along with immune cells infiltration in the progression of atherosclerosis identified via microarray gene expression dataset re-analysis.Vascular. 2020 Oct;28(5):643-654. doi: 10.1177/1708538120922700. Epub 2020 May 7. Vascular. 2020. PMID: 32379583
-
Novel insights of disulfidptosis-mediated immune microenvironment regulation in atherosclerosis based on bioinformatics analyses.Sci Rep. 2024 Nov 9;14(1):27336. doi: 10.1038/s41598-024-78392-5. Sci Rep. 2024. PMID: 39521794 Free PMC article.
References
-
- Agabiti-Rosei E, Muiesan M L. Carotid atherosclerosis, arterial stiffness and stroke events[J]. Adv Cardiol, 2007,44:173–186. - PubMed
-
- Demirkol S, Balta S, Celik T, et al.. Carotid Intima Media Thickness and Its Association With Total Bilirubin Levels in Patients With Coronary Artery Ectasia[J]. Angiology, 2020,71(5):425–430. - PubMed
-
- Gui Y K, Li Q, Liu L, et al.. Plasma levels of ceramides relate to ischemic stroke risk and clinical severity[J]. Brain Res Bull, 2020,158:122–127. - PubMed
-
- Dossabhoy S, Arya S. Epidemiology of atherosclerotic carotid artery disease[J]. Semin Vasc Surg, 2021,34(1):3–9. - PubMed
-
- Moroni F, Ammirati E, Magnoni M, et al.. Carotid atherosclerosis, silent ischemic brain damage and brain atrophy: A systematic review and meta-analysis[J]. Int J Cardiol, 2016,223:681–687. - PubMed
MeSH terms
LinkOut - more resources
Full Text Sources
Medical
Research Materials
Miscellaneous

