. 2025 Mar 3;85(5):925-941.
doi: 10.1158/0008-5472.CAN-24-1611.

Targeting Arachidonic Acid Metabolism Enhances Immunotherapy Efficacy in ARID1A-Deficient Colorectal Cancer

Affiliations

Targeting Arachidonic Acid Metabolism Enhances Immunotherapy Efficacy in ARID1A-Deficient Colorectal Cancer

Luying Cui et al. Cancer Res. .

Abstract

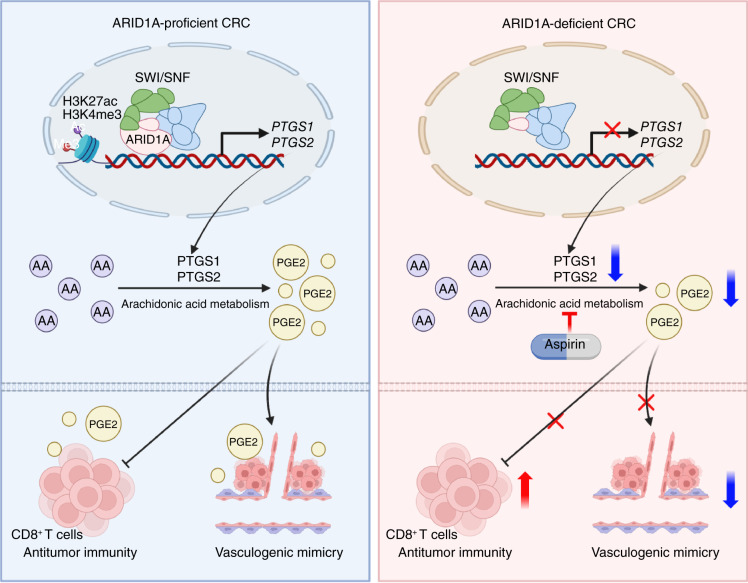
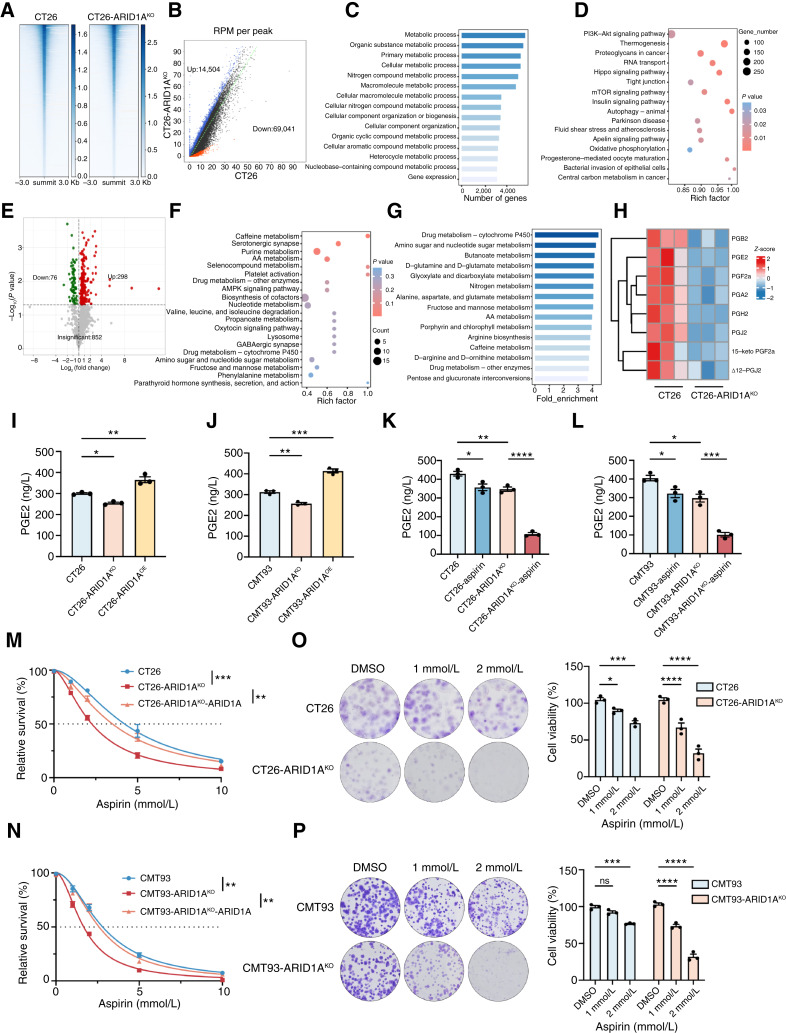
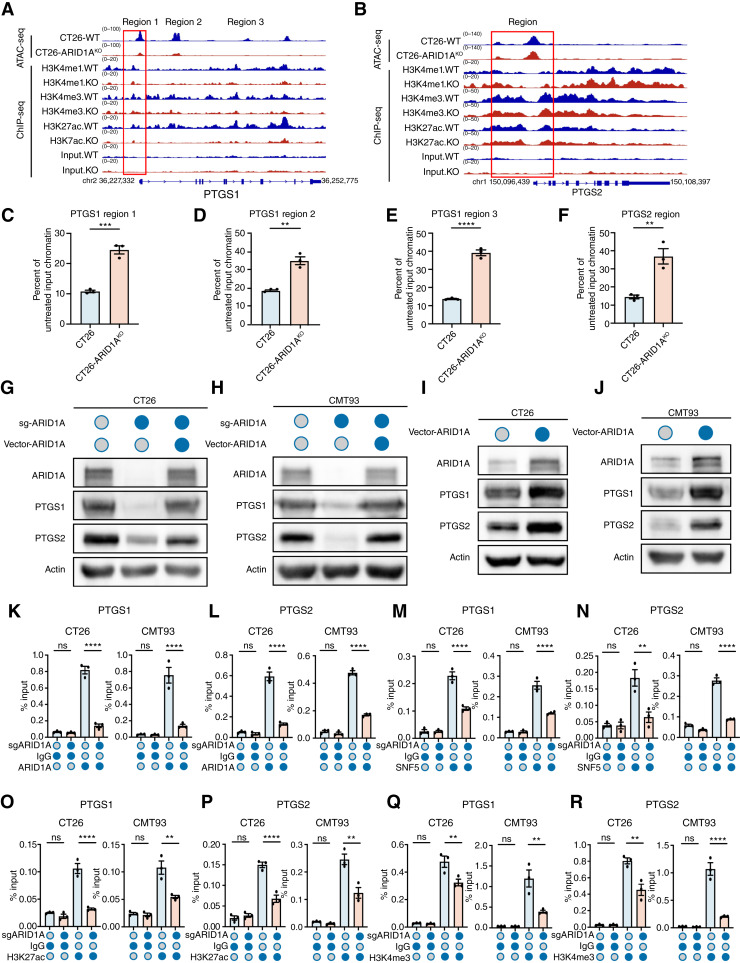
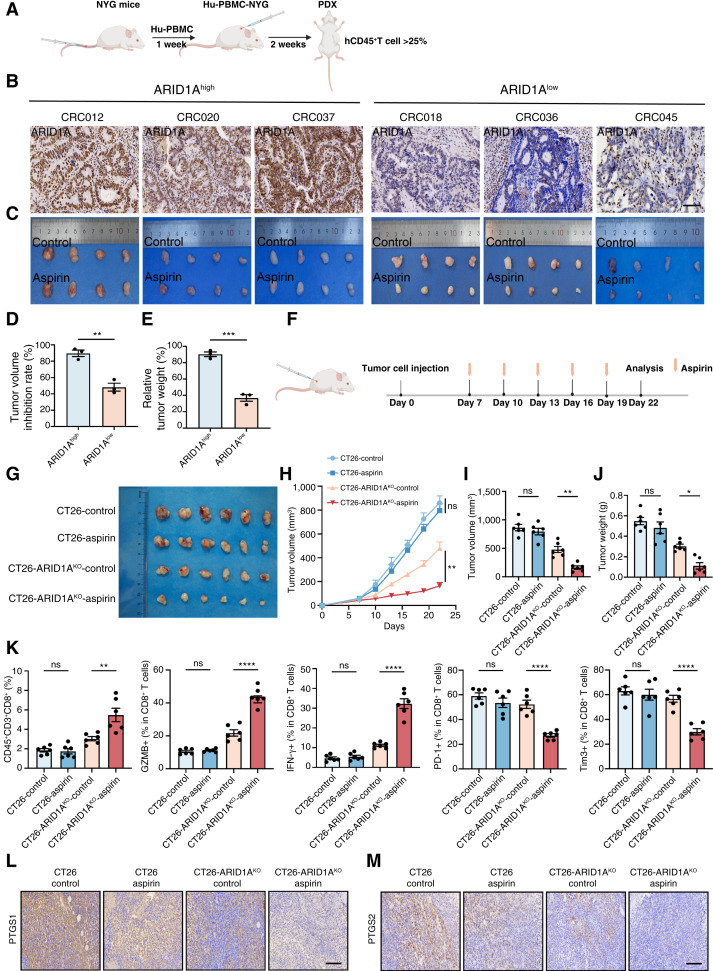
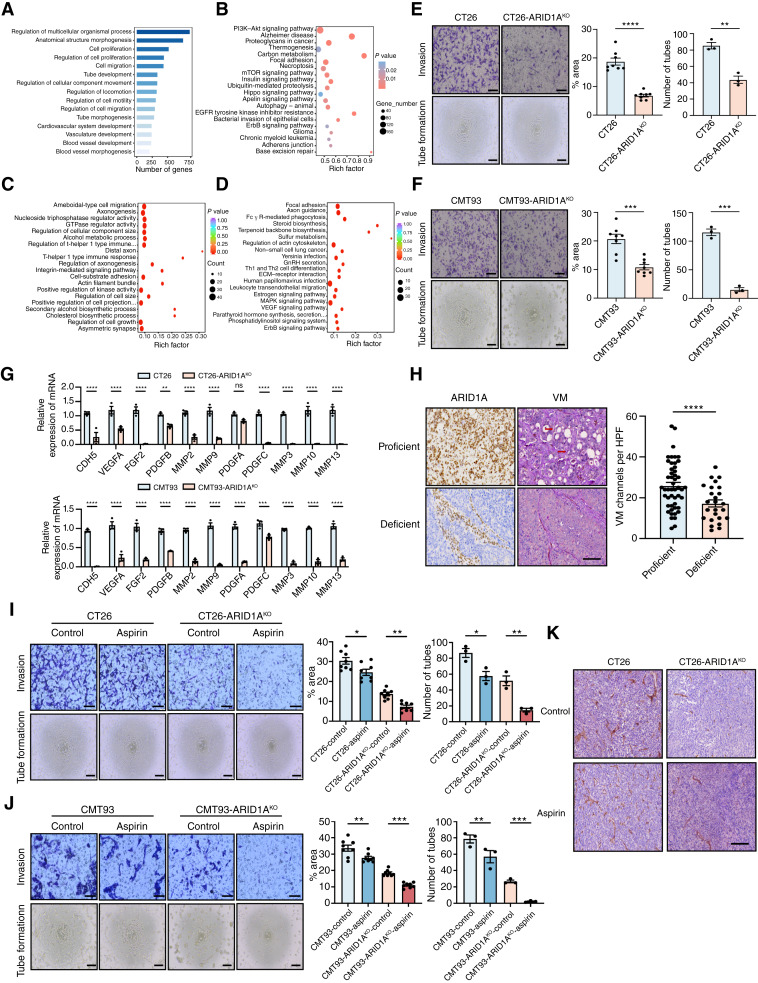
AT-rich interactive domain-containing protein 1A (ARID1A), a core constituent of the switch/sucrose nonfermentable (SWI/SNF) complex, is mutated in approximately 10% of colorectal cancers. Whereas ARID1A deficiency corresponds to heightened immune activity in colorectal cancer, immune checkpoint inhibitors (ICI) have shown limited efficacy in these tumors. The discovery of targetable vulnerabilities associated with ARID1A deficiency in colorectal cancer could expand treatment options for patients. In this study, we demonstrated that arachidonic acid (AA) metabolism inhibitors synergize with ICIs in ARID1A-deficient colorectal cancer by enhancing the activity of CD8+ T cells and inhibiting vasculogenic mimicry. Epigenetic analysis using ATAC-seq and ChIP-qPCR revealed that the lack of ARID1A results in reduced levels of PTGS1 and PTGS2, the key enzymes that control the AA pathway. Low PTGS1 and PTGS2 expression generated a reliance on the remaining functionality of the AA pathway in ARID1A-deficient cells. The AA pathway inhibitor aspirin selectively inhibited the growth of ARID1A-deficient colorectal cancer, and aspirin sensitized tumors lacking ARID1A to immunotherapy. Together, these findings suggest that blocking AA metabolism can enhance immune responses against tumors by activating CD8+ T cells and inhibiting vasculogenic mimicry, which synergizes with ICIs to improve treatment of ARID1A-deficient colorectal cancer. Significance: The arachidonic acid pathway is a metabolic vulnerability in ARID1A-deficient colorectal cancer that can be targeted with aspirin to suppress tumor growth and enhance sensitivity to immunotherapy, providing a promising therapeutic strategy.


Conflict of interest statement

No disclosures were reported.

Figures

None
Graphical abstract
Figure 1.
Figure 1.
ARID1A-deficient colorectal cancer cells have limited immunotherapy efficacy. A, Tables and histograms recapitulating the outcomes of patients with colorectal cancer in the ICI cohort. B, Representative CT images showing tumor change at the baseline and the best response after ICI therapy. Red circles, lesions. The ARID1A status and therapeutic evaluation are depicted. C, PFS and OS of patients with colorectal cancer who received ICI therapy. D, Tables and histograms recapitulating the outcomes of patients with colorectal cancer in the bevacizumab cohort. E, Representative CT images showing tumor change at the baseline and the best response after bevacizumab therapy. Red circles, lesions. The ARID1A status and therapeutic evaluation are depicted. F, PFS and OS of patients with colorectal cancer who received bevacizumab therapy. G, Tables and histograms recapitulating the outcomes of patients with colorectal cancer in the cetuximab cohort. H, Representative CT images showing tumor change at the baseline and the best response after cetuximab therapy. Red circles, lesions. The ARID1A status and therapeutic evaluation are depicted. I, PFS and OS of patients with colorectal cancer who received cetuximab therapy. J and K, IHC images (J) and quantitation (K) of ARID1A and CD8 in CT26 and CT26 ARID1AKO cell–derived s.c. tumors. Scale bar, 120 μm. L and M, IHC images (L) and quantitation (M) of ARID1A and CD8 in colorectal cancer samples (n = 75). Scale bar, 200 μm. N, Gross images of CT26 ARID1AKO cell–derived s.c. tumors. The tumor-bearing BALB/c mice received 2 weeks of i.p. injection with anti–PD-1 or IgG. O–Q, Tumor growth curves (O), tumor volume (P), and tumor weight (Q) of CT26 ARID1AKO cell–derived s.c. tumors treated with anti–PD-1 or IgG (n = 6). ns, not significant; *, P < 0.05; ***, P < 0.001. PD, progressive disease; SD, stable disease.
Figure 2.
Figure 2.
ARID1A deficiency reprogrammed AA metabolism to generate susceptibility. A, Heatmap shows the average signal distribution in the 3 kb region upstream and downstream of summit in CT26 and CT26 ARID1AKO cells. B, Differential peak calls of ATAC-seq in CT26 and CT26 ARID1AKO cells. Red and blue dots depict peaks with decreased or increased read density, respectively. The number in the bottom right or top left imply the count of called peaks showing decreased or increased accessibility. RPM, reads per million. C, GO analysis of differential genes explains the enrichment of metabolism-related signaling pathways. D, KEGG analysis of differentially expressed genes revealed signaling pathways involved in metabolic processes. E, Volcanic map of differential metabolites in CT26 and CT26 ARID1AKO cell lines. Red and green points represent upregulated and downregulated metabolites, respectively, whereas gray dots represent detected but not significantly different metabolites. F, KEGG analysis of differential metabolites uncovered alterations in metabolic pathways. G, Metabolite set enrichment analysis of differential metabolites revealed changes in metabolic pathways. H, Heatmap of differential metabolism of the AA metabolic pathway. I and J, The levels of PGE2 in CT26, CT26 ARID1AKO, and CT26 ARID1AOE (I) or CMT93, CMT93 ARID1AKO, and CTMT93 ARID1AOE (J) cells were detected by ELISA. K and L, The levels of PGE2 in CT26 and CT26 ARID1AKO cells (K) or CMT93 and CMT93 ARID1AKO cells (L) were detected by ELISA following treatment with or without aspirin (2 mmol/L) for 48 hours. M and N, Dose–response curves for CT26, CT26 ARID1AKO, and CT26 ARID1AKO cells with ARID1A restoration (M) or CMT93, CMT93 ARID1AKO, and CMT93 ARID1AKO cells with ARID1A restoration (N) to aspirin were detected by CCK8 assay. O and P, Relative cell viability rates for CT26 and CT26 ARID1AKO cells (O) or CMT93 and CMT93 ARID1AKO cells (P) to aspirin were detected by colony formation assay. ns, not significant; *, P < 0.05; **, P < 0.01; ***, P < 0.001; ****, P < 0.0001.
Figure 3.
Figure 3.
ARID1A deficiency leads to a reliance on PTGS1 and PTGS2 genes in colorectal cancer. A, Diagram illustrating the molecules implicated in the AA metabolic pathway and inhibitors targeting their products. B, Histogram of genes associated with AA metabolism in CT26 and CT26 ARID1AKO cells. C, Immunoblotting for validation of PTGS1 and PTGS2 expression in CT26 and CT26 ARID1AKO cells or CMT93 and CMT93 ARID1AKO cells. D, Immunoblotting for validation of correlation between ARID1A and PTGS1 and PTGS2 expression in multiple colorectal cancer cells. E, IHC images and quantitation of ARID1A, PTGS1, and PTGS2 in colorectal cancer samples (n = 75). Scale bar, 200 μm. F and G, Dose–response curves for CT26 and CT26 ARID1AKO cells to TFAP (F) or celecoxib (G) were detected by CCK8 assay. H and I, Dose–response curves for CMT93 and CMT93 ARID1AKO cells to TFAP (H) or celecoxib (I) were detected by CCK8 assay. J, Immunoblotting for validation of PTGS1 silencing by siRNA in CT26 and CT26 ARID1AKO cells. K, Relative cell viability rates were assessed after siPTGS1 transfection in CT26 and CT26 ARID1AKO cells by CCK8 assay. L, Immunoblotting for validation of PTGS2 silencing by siRNA in CT26 and CT26 ARID1AKO cells. M, Relative cell viability rates were assessed after siPTGS2 transfection in CT26 and CT26 ARID1AKO cells by CCK8 assay. N and O, Relative cell viability rates for CT26 and CT26 ARID1AKO cells with or without siPTGS1 (N) or siPTGS2 (O) were detected by colony formation assay. ns, not significant; *, P < 0.05; **, P < 0.01; ***, P < 0.001; ****, P < 0.0001.
Figure 4.
Figure 4.
PTGS1 and PTGS2 are target genes of the SWI/SNF complex containing ARID1A. A and B, Representative browser track of ATAC-seq and ChIP-seq on the PTGS1 (A) and PTGS2 (B) locus in CT26 and CT26 ARID1AKO cells. C–F, qPCR was performed on DNase I–treated chromatin samples. G and H, Immunoblotting for validation of PTGS1 and PTGS2 expression in CT26, CT26 ARID1AKO, and CT26 ARID1AKO with ARID1A restoration cells (G) or CMT93, CMT93 ARID1AKO, and CMT93 ARID1AKO with ARID1A restoration cells (H). I and J, Immunoblotting for validation of PTGS1 and PTGS2 expression in CT26 and CT26 ARID1AOE cells (I) or CMT93 and CMT93 ARID1AOE cells (J). K–N, The association of ARID1A (K and L) or SNF5 (M and N) with the PTGS1 and PTGS2 gene promoters in CT26 and CT26 ARID1AKO cells or CMT93 and CMT93 ARID1AKO cells was assessed by ChIP-qPCR. O–R, The association of H3K27ac (O and P) or H3K4me3 (Q and R) with the PTGS1 and PTGS2 gene promoters in CT26 and CT26 ARID1AKO cells or CMT93 and CMT93 ARID1AKO cells was assessed by ChIP-qPCR. ns, not significant; **, P < 0.01; ***, P < 0.001; ****, P < 0.0001.
Figure 5.
Figure 5.
Targeting AA metabolism promotes further amplification of CD8+ T-cell signaling. A, Schematic illustration of Hu-NYG PDX mouse model establishment and validation of immune cells. B, The levels of ARID1A expression were analyzed by IHC in colorectal cancer PDX models and divided into ARID1Ahigh and ARID1Alow. Scale bar, 100 μm. C, ARID1Ahigh and ARID1Alow PDX tumor sizes are shown after grouping and treatment for 2 weeks. D and E, The tumor volume inhibition rates (D) and relative tumor weight (E) after the indicated treatments in ARID1Ahigh and ARID1Alow PDX models. F, Schematic depiction of tumor cell inoculation into mouse xenograft models, followed by treatment with or without aspirin. G, Gross images of CT26 and CT26 ARID1AKO cell–derived s.c. tumors. BALB/c mice bearing tumors were treated with or without aspirin (n = 6). H–J, Tumor growth curves (H), tumor volume (I), and tumor weight (J) of CT26 and CT26 ARID1AKO cell–derived s.c. tumors treated with or without aspirin (n = 6). K, Quantification of CD45+CD3+CD8+, GZMB+CD8+, IFNγ+CD8+, PD-1+CD8+, and Tim3+CD8+ T cells in CT26 and CT26 ARID1AKO cell–derived s.c. tumor treated with or without aspirin. L and M, Representative images for PTGS1 (L) and PTGS2 (M) in CT26 and CT26 ARID1AKO cell–derived s.c. tumors treated with or without aspirin. Scale bar, 120 μm. ns, not significant; *, P < 0.05; **, P < 0.01; ***, P < 0.001; ****, P < 0.0001. A and F, Created in BioRender. Cui, L. (2024) https://BioRender.com/p39x013.
Figure 6.
Figure 6.
Targeting AA metabolism further inhibits vascular mimicry formation. A and B, GO (A) and KEGG (B) analysis of downregulated differential genes by ATAC-seq explained the enrichment of VM-related signaling pathways in CT26 and CT26 ARID1AKO cells. C and D, GO (C) and KEGG (D) analysis of differential genes in RNA-seq of CT26 and CT26 ARID1AKO cells. E and F, The tube formation and transwell invasion analysis of CT26 and CT26 ARID1AKO cells (E) or CMT93 and CMT93 ARID1AKO cells (F). Top, scale bar, 100 μm. Bottom, scale bar, 200 μm. G, Heatmaps of genes associated with VM formation in CT26 and CT26 ARID1AKO cells or CMT93 and CMT93 ARID1AKO cells. H, IHC images and quantitation of ARID1A and VM in colorectal cancer samples (n = 75). Scale bar, 120 μm. HPF, high-power field. I and J, The tube formation and transwell invasion analysis of CT26 and CT26 ARID1AKO cells (I) or CMT93 and CMT93 ARID1AKO cells (J) treated with or without aspirin. Top, scale bar, 100 μm. Bottom, scale bar, 200 μm. K, Representative images of immunostaining for VM in CT26 and CT26 ARID1AKO cell–derived s.c. tumors treated with or without aspirin. Scale bar, 120 μm. ns, not significant; *, P < 0.05; **, P < 0.01; ***, P < 0.001; ****, P < 0.0001.
Figure 7.
Figure 7.
The AA metabolic inhibitor and ICIs are synergistic in suppressing ARID1A-deficient colorectal cancer. A, Schematic illustration of the Hu-NYG PDX mouse model and cell line mouse transplanted tumor model treated with or without aspirin or anti–PD-1. B, Gross images of ARID1A-deficient colorectal cancer PDX model. NYG mice bearing tumors were treated with or without aspirin or anti–PD-1 (n = 3). C and D, Tumor volume (C) and tumor weight (D) of ARID1A-deficient colorectal cancer PDX model treated with or without aspirin or anti–PD-1 (n = 3). E, Quantification of CD45+CD3+CD8+, IFNγ+CD8+, and Tim3+CD8+ T cells in the ARID1A-deficient colorectal cancer PDX model treated with or without aspirin or anti–PD-1 (n = 3). F, Gross images of CT26 ARID1AKO cell–derived s.c. tumors. BALB/c mice bearing tumors were treated with or without aspirin or anti–PD-1 (n = 6). G–I, Tumor growth curves (G), tumor volume (H), and tumor weight (I) of CT26 ARID1AKO cell–derived s.c. tumors treated with or without aspirin or anti–PD-1 (n = 6). J, The secretion of PGE2 in CT26 ARID1AKO cell–derived s.c. tumors treated with or without aspirin or anti–PD-1 were detected by ELISA. K, Quantification of CD45+CD3+CD8+, GZMB+CD8+, IFNγ+CD8+, PD-1+CD8+, and Tim3+CD8+ T cells in CT26 ARID1AKO cell-derived subcutaneous tumors treated with or without aspirin or anti–PD-1 (n = 6). L, Gross images of CMT93 ARID1AKO cell–derived s.c. tumors. C57BL/6 mice bearing tumors were treated with or without aspirin or anti–PD-1 (n = 6). M–O, Tumor growth curves (M), tumor volume (N), and tumor weight (O) of CMT93 ARID1AKO cell–derived s.c. tumors treated with or without aspirin or anti–PD-1 (n = 6). P, The secretion of PGE2 in CMT93 ARID1AKO cell–derived subcutaneous tumors treated with or without aspirin or anti–PD-1 were detected by ELISA. Q, Quantification of CD45+CD3+CD8+, GZMB+CD8+, IFNγ+CD8+, PD-1+CD8+ and Tim3+CD8+ T cells in CMT93 ARID1AKO cell–derived s.c. tumors treated with or without aspirin or anti–PD-1 (n = 6). ns, not significant; *, P < 0.05; **, P < 0.01; ***, P < 0.001; ****, P < 0.0001. A, Created in BioRender. Cui, L. (2024) https://BioRender.com/p39x013.

References

    1. Clapier CR, Cairns BR. The biology of chromatin remodeling complexes. Annu Rev Biochem 2009;78:273–304. - PubMed
    1. Tokunaga R, Xiu J, Goldberg RM, Philip PA, Seeber A, Battaglin F, et al. . The impact of ARID1A mutation on molecular characteristics in colorectal cancer. Eur J Cancer 2020;140:119–29. - PMC - PubMed
    1. Shen J, Ju Z, Zhao W, Wang L, Peng Y, Ge Z, et al. . ARID1A deficiency promotes mutability and potentiates therapeutic antitumor immunity unleashed by immune checkpoint blockade. Nat Med 2018;24:556–62. - PMC - PubMed
    1. Bosse T, ter Haar NT, Seeber LM, v Diest PJ, Hes FJ, Vasen HF, et al. . Loss of ARID1A expression and its relationship with PI3K-Akt pathway alterations, TP53 and microsatellite instability in endometrial cancer. Mod Pathol 2013;26:1525–35. - PubMed
    1. Parikh AR, He Y, Hong TS, Corcoran RB, Clark JW, Ryan DP, et al. . Analysis of DNA damage response gene alterations and tumor mutational burden across 17,486 tubular gastrointestinal carcinomas: implications for therapy. Oncologist 2019;24:1340–7. - PMC - PubMed

MeSH terms