. 2025 Mar 3;85(5):875-893.
doi: 10.1158/0008-5472.CAN-24-2341.

Gain-of-Function Chromatin Remodeling Activity of Oncogenic FOXL2C134W Reprograms Glucocorticoid Receptor Occupancy to Drive Granulosa Cell Tumors

Affiliations

Gain-of-Function Chromatin Remodeling Activity of Oncogenic FOXL2C134W Reprograms Glucocorticoid Receptor Occupancy to Drive Granulosa Cell Tumors

Thomas Welte et al. Cancer Res. .

Abstract

Adult type ovarian granulosa cell tumors (AGCT) are rare malignancies with the near universal c.C402G (p.Cys134Trp) somatic mutation in FOXL2, a forkhead box family transcription factor important for ovarian function. Relapsed AGCT is incurable, but the mechanism of the unique FOXL2 mutation could confer therapeutic vulnerabilities. To identify FOXL2C134W-dependent pharmacologic synergies, we created and characterized endogenous FOXL2 isogenic AGCT cells and an AGCT tumoroid biobank. A drug screen identified that glucocorticoids promote FOXL2C134W-dependent AGCT growth. Epigenetic investigation revealed that the Cys134Trp mutation exposes latent DNA sequence-specific chromatin remodeling activity in FOXL2. FOXL2C134W-dependent chromatin remodeling activity redirected glucocorticoid receptor chromatin occupancy to drive hyaluronan synthase 2 gene expression and increase extracellular hyaluronan secretion. Treatment of AGCT models with hyaluronidase reduced viability, and dexamethasone rescued this effect. Combinatorial drug-drug interaction experiments demonstrated that dexamethasone antagonizes the potency of paclitaxel, a chemotherapy agent frequently used in the treatment of AGCT. Thus, gain-of-function pioneering activity contributes to the oncogenic mechanism of FOXL2C134W and creates a potentially targetable synergy with glucocorticoid signaling. Significance: Glucocorticoids promote granulosa cell tumor growth via epigenetic coregulation with the disease driver FOXL2C134W, providing mechanistic insight into disease oncogenesis and uncovering a potential treatment strategy.


Conflict of interest statement

A.K. Sood reports personal fees from Merck, GSK, Onxeo, ImmunoGen, Iylon, and AstraZeneca and other support from Advenchen outside the submitted work. D.M. Gershenson reports personal fees from Verastem Oncology, Elsevier, and UpToDate, and other support from Bristol Myers Squibb, Johnson & Johnson, and Procter and Gamble outside the submitted work. R.T. Hillman reports grants from Sumitomo Pharma outside the submitted work. No disclosures were reported by the other authors.

Figures

None
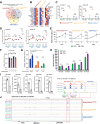
Graphical abstract
Figure 1.
Figure 1.
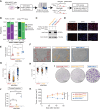
Loss of FOXL2C134W alters AGCT cellular phenotype in vitro. A, Schematic representation of the creation of isogenic FOXL2 cell lines. B, Proportion of allele-specific CRISPR/Cas9 editing at FOXL2 locus using two independent FOXL2 sgRNAs (sgRNA A and sgRNA B). The frequency of mutations predicted to result in premature termination of protein translation (purple) was significantly higher for wild-type FOXL2 allele compared with FOXL2 c.C402G allele for both sgRNA A (P = 3.58 × 10⁻⁹) and sgRNA B (P < 2.2 × 10⁻¹⁶; Fisher exact test). C, Immunoblot of KGN isogenic lines confirming the loss of FOXL2 expression in KGN-FOXL2−/− cells. Vinculin was used as a loading control. D, Immunofluorescent images of KGN isogenic lines confirming the loss of FOXL2 expression in KGN-FOXL2−/− cells. Red, FOXL2. DAPI (blue) was used as a reference nuclei stain. Scale bars, 20 μm. E, Proliferation rate of KGN-FOXL2−/− cells measured by BrdU incorporation is higher than KGN-FOXL2C402G/+ or KGN-FOXL2C402G/− cells; two-sided t test. Error bars, SEM. F, Example colony formation assay brightfield images of KGN isogenic lines when seeded at low plating densities. Dotted outlines added for visual clarity. Scale bars, 500 µm. G, Colonies with KGN-FOXL2−/− cells are more circular compared with KGN-FOXL2C402G/− and KGN-FOXL2C402G/+ cells; two-sided t tests. Box plot represents median ± IQR. H, Colonies with KGN-FOXL2−/− cells are more solid compared with KGN-FOXL2C402G/− and KGN-FOXL2C402G/+ cells; two-sided t tests. Box plots represent median ± IQR. I, Representative images of serum-starved KGN-FOXL2C402G/+, KGN-FOXL2C402G/−, and KGN-FOXL2−/− following Boyden-chamber chemotactic migration assay toward serum-containing growth medium. Scale bars, 670 µm. J, Absorbance-based quantification of crystal violet stain extracted from transwell migration wells demonstrated increased migration of KGN-FOXL2−/− compared with KGN-FOXL2C402G/− or KGN-FOXL2C402G/+; two-sided t tests. Error bars, SEM. K, KGN-FOXL2C402G/+ and KGN-FOXL2C402G/− subcutaneous tumors exhibited increased growth compared with KGN-FOXL2−/− tumors (n = 6 animals per group); two-way ANOVA with Tukey correction. Representative experiment is shown. Error bars, SEM of the mean. n.s., not significant; *, P ≤ 0.05; **, P ≤ 0.01; ****, P ≤ 0.0001.
Figure 2.
Figure 2.
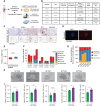
Glucocorticoids promote AGCT proliferation in the presence of FOXL2C134W. A, Ranked Z scores based on the area under the growth rate index (GRI) curve for drug screens performed in KGN-FOXL2C402G/+ (left) and KGN-FOXL2−/− cells (right). Glucocorticoid compounds (green), glucocorticoid prodrugs (cortisone, prednisone, cortisone acetate, and meprednisone; purple), and other compounds (gray) are shown. B, Comparison of differential effect in KGN-FOXL2C402G/+ cells vs. KGN-FOXL2−/− cells between primary drug screen and validation screen. Glucocorticoid compounds (green) and other compounds (gray) are shown. C, Dose–response curves for dexamethasone, methylprednisolone, and the deoxycorticosterone acetate in KGN-FOXL2C402G/+ (red), KGN-FOXL2C402G/− (orange), and KGN-FOXL2−/− (blue) cells; by two-way ANOVA with Tukey correction. Error bars, SD of the mean. GR50, half maximal growth rate index. D, Representative GR expression detected by IHC in human AGCT tumors. Scale bars, 200 µm. GRI = Hafner growth rate index (52). n.s., not significant, P ≥ 0.05; ****, P < 0.0001.
Figure 3.
Figure 3.
Glucocorticoids promote the growth of AGCT tumoroids. A, Summary of human AGCT biobanking. B, Clinical features of five donor patients with AGCT tissue used in this study. C, IHC staining of five clinical AGCT markers: comparison between tumor of origin (top row) and derived tumoroid culture (bottom row), case GCT025. Scale bars, 200 µm. See also Supplementary Fig. S8A. D, Immunofluorescence staining of AGCT tumoroid from GCT025 with FOXL2 antibody (red); nuclear localization was identified by costaining with DAPI. Scale bars, 50 µm. See also Supplementary Fig. S8B. E, Raw variant allele frequency (VAF) of FOXL2 c.C402G in tumors (blue) and tumoroid cultures (red). F, Prevalence of somatic exonic DNA sequence variant patterns among AGCT tumor/tumoroid culture (TC) pairs detected by WES. Red, missense mutations; blue, synonymous coding mutations; green, nonsense coding mutations; purple, splicing mutations; orange, frameshift indels; yellow, nonframeshift indels. G, Concordance of somatic exonic DNA sequence variants among five AGCT tumor/tumoroid pairs. Blue, shared; orange, tumor only; red, tumoroid only. H, Brightfield images of AGCT tumoroid cultures of five AGCT cases. Scale bars, 130 µm. I, CCK8 quantification of dexamethasone (30 nmol/L)- and vehicle (DMSO)-treated AGCT tumoroid cultures. Results of a two-sided t test are shown. n.s., not significant; P ≥ 0.05; *, P < 0.05; ***, P < 0.001.
Figure 4.
Figure 4.
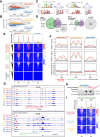
FOXL2C134W confers sequence-specific chromatin accessibility. A, RNA-seq MA plot of KGN-FOXL2C402G/+ compared with KGN-FOXL2−/− gene expression. Labels indicate genes identified as wild-type FOXL2 or FOXL2C134W targets in prior studies (–42). B, RNA-seq MA plot of KGN-FOXL2C402G/− compared with KGN-FOXL2−/− gene expression. Labels indicate genes identified as wild-type FOXL2 or FOXL2C134W targets in prior studies (–42). C, Description of FOXL2C134W recognition motifs (and reverse complements) identified by de novo motif discovery from IDR ChIP-seq peaks. Red dotted lines indicate regions of similarity to previously identified FOXL2 motifs (18). RC, reverse complement. D, Prevalence of motif A and motif B identified de novo from IDR ChIP-seq peaks and prevalence of these motifs by motif scanning among less stringent overlap ChIP-seq peaks. E, ATAC-seq signal measured in KGN-FOXL2C402G/+, KGN-FOXL2C402G/−, and KGN-FOXL2−/− cells at ±2 kilobase windows around 22,349 FOXL2 ChIP-seq peaks identified in the overlap peak set (Supplementary Table S9), separated by the presence of both motif A and motif B (red), motif A (green), motif B (purple), or no motif (black). F, ChIP-seq signal for H3K27ac, H3K4me1, and H3K27me3 in KGN-FOXL2C402G/+, KGN-FOXL2C402G/−, and KGN-FOXL2−/− cells at ±1 kilobase windows centered around 22,349 FOXL2 ChIP-seq peaks identified in the Overlap peak set (Supplementary Table S9), separated by the presence of both motif A and motif B (red), motif A (green), motif B (purple), or no motif (black). G, Example genome browser views of FOXL2C134W ChIP-seq peaks (green bars) and associated loss of chromatin accessibility, as measured by ATAC-seq signal, in KGN-FOXL2−/− cells compared with other isogenic cell lines. H, Immunoblot demonstrating behavior of engineered doxycycline-inducible GFP, FOXL2wt, and FOXL2C134W transgenes introduced into KGN-FOXL2−/− cells. Comparison is shown to endogenous FOXL2 expression in unmodified KGN-FOXL2C402G/+ cells. I, ATAC-seq signal measured in KGN-FOXL2C402G/+, KGN-FOXL2C402G/−, and KGN-FOXL2−/− cells that contain reintroduced FOXL2 mutant (KGN-FOXL2−/−; iFOXL2C402G, magenta) or reintroduced FOXL2 wild-type (KGN-FOXL2−/−; iFOXL2wt, cyan) or introduced GFP-control (KGN-FOXL2−/−; iGFP, orange) at ±2 kilobase windows around the motif A–containing subset of the overlap FOXL2 ChIP-seq peak set. See Supplementary Fig. S12 for peaks containing both motif A and motif B, motif B, or no FOXL2 motif.
Figure 5.
Figure 5.
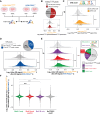
FOXL2C134W redirects GR chromatin occupancy and alters the dexamethasone-induced gene expression program. A, Schematic representation of the Foxl2 ChIP-seq and GR ChIP-seq experiments performed on isogenic FOXL2 cell lines. B, Proportion of GR-binding sites overlapping FOXL2C134W binding sites and log2 ratio of FOXL2C134W ChIP-seq signal with dexamethasone treatment compared with the vehicle alone. C, Comparison of dexamethasone-stimulated log2 ratio of FOXL2C134W ChIP-seq signal by the presence or absence of GRE motif. GRE motif logo is shown as inset. D, Proportion of FOXL2C134W binding sites overlapping GR binding sites and log2 ratio of dexamethasone (Dex)-stimulated GR ChIP-seq signal in KGN-FOXL2C402G/− cells compared with KGN-FOXL2−/− cells. E, Comparison of dexamethasone-stimulated log2 ratio of GR ChIP-seq signal in KGN-FOXL2C402G/− cells compared with KGN-FOXL2−/− cells by the presence or absence of FOXL2C134W motifs. Inset, FOXL2C134W motif logos. F, Regions of overlapping FOXL2C134W and GR occupancy were linked to the nearest protein coding gene transcriptional start site within 100 kilobase limit. The relative dexamethasone-stimulated expression of these nearby genes is shown in KGN-FOXL2C402G/− cells by the presence of FOXL2C134W motif. n.s., not significant, P ≥ 0.05; ****, P < 0.0001.
Figure 6.
Figure 6.
Concordance between mitogenic effect of dexamethasone, HAS2 expression, and increased hyaluronan. A, Differential RNA-seq gene expression with FDR-based filtering identified 17 dexamethasone (Dex)-induced genes with significantly increased expression in both KGN-FOXL2C402G/+ and KGN-FOXL2C402G/− cells, but not KGN-FOXL2−/− cells. B, Gene-specific Z-score is shown for 17 candidate genes. HAS2 (dotted red line) demonstrated a sustained (48 hours) increase in gene expression in KGN-FOXL2C402G/+ and KGN-FOXL2C402G/− cells, but decreased expression in KGN-FOXL2−/− cells following dexamethasone treatment. C, qPCR measurement of HAS2 gene expression with dexamethasone treatment or vehicle alone; all comparisons are two-sided t tests. Results from two independent HAS2 probes are shown. D, qPCR measurement of HAS2 gene expression in doxycycline-inducible KGN-FOXL2−/−-based “rescue” cell lines with dexamethasone treatment or vehicle alone. Blue, specific doxycycline-inducible rescue lines. All comparisons are two-sided t tests. Results from two independent HAS2 probes are shown. E, Time-dependent measurement of secreted hyaluronan with dexamethasone treatment or vehicle alone; two-way ANOVA. Error bars, SD of the mean. F, CCK8 cell viability measurement of KGN-FOXL2C402G/+ cells following anti-CD44 treatment, with or without cotreatment with dexamethasone or vehicle alone; all comparisons are two-sided t tests. Error bars, SEM of the mean. G, CCK8 cell viability measurement of KGN-FOXL2C402G/+ cells following hyaluronidase treatment, with or without cotreatment with dexamethasone or vehicle alone; all comparisons are two-sided t tests. Error bars, SEM of the mean. H, Measurement of secreted hyaluronan with dexamethasone treatment or vehicle alone in AGCT tumoroids; all comparisons are two-sided t tests. Error bars, SEM of the mean. I, CCK8 cell viability measurement of AGCT tumoroids following hyaluronidase treatment; all comparisons are two-sided t tests. Error bars, SEM of the mean. J, An enhancer element near (∼70 kb) the HAS2 transcriptional start site exhibits FOXL2C134W-dependent chromatin accessibility at a motif A–containing peak (region 2), as measured by ATAC-seq. Adjacent GR binding at a GRE motif containing site is dependent upon FOXL2C134W co-occupancy (region 1). n.s., not significant, P ≥ 0.05; *, P < 0.05; **, P < 0.01; ***, P < 0.001, ****, P < 0.0001.
Figure 7.
Figure 7.
Dexamethasone antagonizes paclitaxel potency in AGCT. A, Dose–response curves for paclitaxel treatment of KGN-FOXL2C402G/+ cells performed in the presence of 30 nmol/L dexamethasone or DMSO vehicle. B, Representative image of difference from Bliss surface for drug–drug combination experiment between dexamethasone and paclitaxel in KGN-FOXL2C402G/+ cells. Red, antagonistic; black, additive; green, synergistic effect at the corresponding concentrations, relative to single agent effect.

References

    1. Ferlay J, Soerjomataram I, Dikshit R, Eser S, Mathers C, Rebelo M, et al. . Cancer incidence and mortality worldwide: sources, methods and major patterns in GLOBOCAN 2012. Int J Cancer 2015;136:E359–86. - PubMed
    1. Li X, Tian B, Liu M, Miao C, Wang D. Adult-type granulosa cell tumor of the ovary. Am J Cancer Res 2022;12:3495–511. - PMC - PubMed
    1. Savage P, Constenla D, Fisher C, Shepherd JH, Barton DP, Blake P, et al. . Granulosa cell tumours of the ovary: demographics, survival and the management of advanced disease. Clin Oncol 1998;10:242–5. - PubMed
    1. Mangili G, Ottolina J, Gadducci A, Giorda G, Breda E, Savarese A, et al. . Long-term follow-up is crucial after treatment for granulosa cell tumours of the ovary. Br J Cancer 2013;109:29–34. - PMC - PubMed
    1. How JA, Legarreta AF, Handley KF, Fellman B, Foster KI, Glassman D, et al. . Serial cytoreductive surgery and survival outcomes in recurrent adult-type ovarian granulosa cell tumors. Am J Obstet Gynecol 2024;230:544.e1–544.e13. - PMC - PubMed

MeSH terms

Supplementary concepts