. 2024 Dec 9;20(12):e1012768.
doi: 10.1371/journal.ppat.1012768. eCollection 2024 Dec.

Fatal Lassa fever in cynomolgus monkeys is associated with systemic viral dissemination and inflammation

Affiliations

Fatal Lassa fever in cynomolgus monkeys is associated with systemic viral dissemination and inflammation

Jimmy Hortion et al. PLoS Pathog. .

Abstract

The pathogenesis of Lassa fever has not yet been fully deciphered, particularly as concerns the mechanisms determining whether acute infection is controlled or leads to catastrophic illness and death. Using a cynomolgus monkey model of Lassa virus (LASV) infection reproducing the different outcomes of the disease, we performed histological and transcriptomic studies to investigate the dynamics of LASV infection and the immune mechanisms associated with survival or death. Lymphoid organs are an early major reservoir for replicating virus during Lassa fever, with LASV entering through the cortical sinus of draining lymph nodes regardless of disease outcome. However, subsequent viral tropism varies considerably with disease severity, with viral dissemination limited almost entirely to lymphoid organs and immune cells during nonfatal Lassa fever. By contrast, the systemic dissemination of LASV to all organs and diverse cell types, leading to infiltrations with macrophages and neutrophils and an excessive inflammatory response, is associated with a fatal outcome. These results provide new insight into early viral dynamics and the host response to LASV infection according to disease outcome.


Conflict of interest statement

The authors have declared that no competing interests exist.

Figures
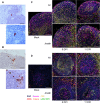
Fig 1
Fig 1. LASV tropism in SLOs.
Detection of LASV RNA (red) by ISH in the ILN of animals infected with AV (A) or Josiah (B), with hematoxylin staining. Scale bars: 100 μm. Identification of LASV target cells by immunofluorescence in the MLN (C) and spleens (D) of AV- and Josiah-infected animals on days 5 (left image) and 11 (right image) after infection, and mock animals, by confocal microscopy. The following stains were used: LASV GPC (green), calprotectin (orange), CD68 (red), CD3 (yellow), desmin (pink), and DAPI (blue). Scale bars: 100 μm.
Fig 2
Fig 2. LASV tropism in organs.
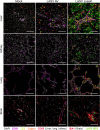
Liver, kidney, lung, and brain tissues obtained at 11 DPI from mock-, AV-, and Josiah-infected animals were stained for LASV GPC (green), calprotectin (orange), CD68 or IBA1 (red), CD3 (yellow), desmin (magenta), and with DAPI (blue) and analyzed by confocal microscopy. Scale bars: 100 μm.
Fig 3
Fig 3. Josiah LASV tropism in the brain.
Brain sections were obtained from Josiah-infected animals at 11 DPI and analyzed by confocal microscopy. A. The choroid plexus was stained for LASV RNA (red), CD31 (green), GFAP (yellow), Iba1 (magenta), and with DAPI (gray). The bottom image shows the histological structure of the plexus, which contains, from the center out: the blood vessel lumen, endothelium, connective tissue, ependymal cells and the ventricle lumen. Scale = 50 μm. B. Intraparenchymal capillaries stained for LASV RNA (red) and CD31 (green, upper images) or Iba1 (green, lower images). The arrows indicate LASV-infected endothelial cells (upper images) and pericytes (lower images). Scale = 20 μm.
Fig 4
Fig 4. Quantification of the cytotoxic cells and neutrophils infiltrating the lungs.
(A) Staining of lungs obtained from mock-infected animals and AV- or Josiah-infected animals (n = 3) at 11 DPI for CD3 (green), GrzB (red), and with DAPI (blue) (upper images) or for calprotectin (green) and with DAPI (blue) (lower images). Scale bars: 100 μm. (B) Quantification of GrzB+ cells (upper graph) or calprotectin+ cells (lower graph) in the lungs at 11 DPI. Results are expressed as the mean of three individual values ± standard error of the mean (SEM) of the number of cells/mm2, with * indicating p < 0.05 and ** p < 0.01. (C) Quantification of GrzB+ cells (upper graph) or calprotectin+ cells (lower graph) in the lungs, liver, kidneys, brain, adrenal glands, and thymus at 2, 5, and 11 DPI in AV- (blue) and Josiah- (red) infected animals (n = 3 per group). Results are expressed as the mean (line) and individual values, in numbers of cells/mm2, for LASV-infected animals. The mean value for the mock-infected animals (n = 3) is indicated by the dotted line and individual values are shown in black. The colored asterisks indicate significant differences between Josiah- or AV-infected animals and mock-infected animals, black asterisks indicate significant differences between Josiah- and AV-infected animals. * indicates p < 0.05, ** p < 0.01 and *** p < 0.001.
Fig 5
Fig 5. Cell content determination by transcriptome deconvolution in SLOs and PBMCs.
RNA-seq data obtained with MLN and spleen (A) or with PBMCs (B) from mock-infected animals or LASV-infected animals at 2, 5, 10, and 28 (AV only) DPI were used for a deconvolution analysis by the CIBERSORT method with the LM22 matrix signature (n = 3 for each group). The values in the “mock” column indicate the mean proportion of each cell type within the total cell population. The values indicated in the other columns are the differences of the mean value for the group concerned relative to that for mock-infected animals. These differences are also illustrated with the colorscale in a heatmap. Significant differences (p < 0.05) with respect to the mock-infected animals are indicated by numbers in bold typeface, and differences between Josiah-infected and AV-infected animals at a given time point are indicated by a vertical black line.
Fig 6
Fig 6. Transcriptomic profile of splenic marginal zone cells.
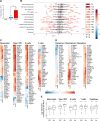
(A) The percentage of total sequence reads mapping on LASV genome is represented as the mean ± SEM for splenic marginal zone cells purified by LCM at 11 DPI from mock-, AV-, and Josiah-infected animals (n = 3 per group). * indicates a significant difference (p < 0.05) between groups. (B) Differential expression of genes from certain HALLMARK pathways expressed as a log2 fold-change (logFC) for Josiah-infected splenic marginal zone cells obtained at 11 DPI compared with AV-infected cells. Each individual gene is represented by a dot and the total number of genes in the pathway is indicated in parentheses. The genes distribution is summarized by boxplots in black and the average differential expression by red triangles. Genes with extreme logFC (2*standard deviation of the logFC) are labeled with their names in red. Heatmaps of the CAMERA enrichment scores for the pathways are presented for each comparison between animal groups: AV-infected animals vs. mock-infected, Josiah-infected vs. mock-infected, and Josiah-infected vs. AV-infected. Red indicates a global upregulation of the pathway, blue a global downregulation, and the color intensity the amplitude of the variation. (C) Heatmaps representing gene expression for the monocyte, type I IFN, B-cell and T-cell gene sets and (D) for the gene set for cytokines/chemokines/receptors. The colors on the heatmap represent the mean standardized (centered and scaled) gene expression for AV- and Josiah-infected splenic marginal zone cells obtained at 11 DPI (n = 3 per group) normalized against that in mock-infected samples (n = 3). The intensity of expression is indicated by the scale. Gene names with an * indicates significance for any of the comparisons (E) Boxplot representation of the distribution of the log expression of the genes in each pathway between AV- and Josiah-infected splenic marginal zone cells obtained at 11 DPI (n = 3 per group) normalized against the mock-infected samples (n = 3) (central line, median; limits, first and third quartiles; whiskers, largest or smallest value no more than 1.5 times the interquartile range away from the hinge). Outlying data are plotted individually.
Fig 7
Fig 7. Transcriptomic profile of hepatocytes.
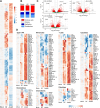
(A) The percentage of total sequence reads mapping on LASV genome is represented as the mean ± SEM for hepatocytes purified by LCM at 11 DPI from mock-, AV-, and Josiah-infected animals (n = 3 per group). We purified non-infected (NI) and infected (I) hepatocytes from the Josiah-infected animals. * indicates a significant difference (p < 0.05) between conditions. (B) Heatmaps of CAMERA enrichment scores for the most significant pathways in gene set analyses applied to the HALLMARK gene sets. Comparisons between Josiah-infected hepatocytes (Jo-I) and mock-infected hepatocytes, AV-infected hepatocytes (AV) and mock-infected hepatocytes, Josiah-infected hepatocytes and AV-infected hepatocytes, and Josiah-infected hepatocytes and non-infected hepatocytes from Josiah-infected animals are shown on the x-axis with gene sets on the y-axis. The number of genes in each pathway is indicated in parentheses. Gray squares indicate gene sets displaying no significant regulation, whereas the red and blue squares indicate pathways significantly upregulated (red squares) or downregulated (blue squares) in one group relative to the other. (C) Heatmaps representing gene expression variations for the type I IFN, cytokines/chemokines/receptors, and coagulation gene sets. The colors on the heatmaps represents the differential expression (DE) of genes between hepatocytes obtained from animals in different groups at 11 DPI (n = 3 per group). The comparisons are the same as for (B). The DE of genes is expressed as a log fold-change value and is given by the color scale. Red (resp. blue) indicates an upregulation (resp. downregulation) of the gene in the group at the numerator of the comparison compared to the group at the denominator. (D) Boxplot representation of the log FC values showing the variation in the expression of the genes in each pathway between groups of hepatocytes obtained at 11 DPI (n = 3 per group) (central line, median; limits, first and third quartiles; whiskers, largest or smallest value no more than 1.5 times the interquartile range away from the hinge). Outlying data are plotted individually.
Fig 8
Fig 8. Transcriptomic profile of the lungs.
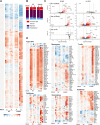
(A) Significant changes in global gene expression (absolute log FC > 1 and adjusted p-value < 0.05) in the lungs of mock-, AV-, and Josiah-infected animals at 11 DPI. Individual values from three animals per group are presented. The color indicates the standardized (centered and scaled) gene expression, normalized against that in mock-infected samples. The intensity of expression is indicated by the color scale. Red (resp. blue) indicates expression higher (resp. lower) to the mock-infected mean. (B) The relative proportions of pulmonary cell types in the lungs at 11 DPI were determined by transcriptome deconvolution and grouped by functional type. The values presented were obtained from the data in S2B Fig. (C) Volcano plots representing the genes differentially expressed (red circles) (threshold of adjusted p-value < 0.05 and absolute log2FC > 1) between two groups, as indicated in the table. The x-axis reflects the log2 fold-change difference in expression for each gene in the first group with respect to the second group. The y-axis indicates the statistical significance of these results, calculated as the–(minus) Log of the p-values. The numbers of downregulated and upregulated differentially expressed genes for each comparison are shown in the upper left and right parts of the graphs, respectively. Blue dots represent differentially expressed genes with absolute log2FC < 1, green and gray dots represent not differentially expressed genes with absolute log2FC > 1 for green and < 1 for gray. (D) Heatmaps representing standardized gene expression for the type I IFN, monocytes T-cell, cytokine, and chemokine gene sets in lung extracts obtained at 11 DPI from AV- and Josiah-infected animals. Individual values from three animals per group are presented. The color indicates the standardized (centered and scaled) gene expression, normalized against that in mock-infected samples. The intensity of expression is indicated by the color scale. Red (resp. blue) indicates expression higher (resp. lower) to the mock-infected mean. Gene names with a symbol indicates significance for each of the following comparison * for AV-infected animals compared to mock-infected, + for Josiah-infected animals compared to AV-infected animals and § for Josiah-infected animals compared to mock-infected.
Fig 9
Fig 9. Transcriptomic profile of the kidneys.
(A) Significant changes in global gene expression (absolute log FC > 1 and adjusted p-value < 0.05) in the kidneys of mock-infected animals and those of AV-, and Josiah-infected animals at 5 and 11 DPI. Expressed as in Fig 8A. (B) Relative proportions of cell types in the kidneys of mock animals and LASV-infected animals at 5 and 11 DPI, determined by transcriptome deconvolution and grouped by functional type. The values presented were obtained from the data in S2A Fig. (C) Volcano plots representing the genes differentially expressed as for Fig 8C between AV-infected and mock-infected animals (upper plots), Josiah-infected and mock-infected animals (center plots), and Josiah-infected and Av-infected animals (lower plots). Comparisons are presented for 5 (left plots) and 11 DPI (right plots). (D) Heatmaps representing standardized gene expression for the type I IFN, monocyte, T-cell, cytokine, and chemokine gene sets, as for Fig 8D, except that gene expression was assessed at 5 (left columns) and 11 (right columns) DPI for LASV-infected animals.
Fig 10
Fig 10. Adrenal glands and LASV infection.
(A) Tropism of LASV for the adrenal glands, by functional zone. ISH techniques were used to stain LASV RNA in the adrenal glands of Josiah-infected animals at 11 DPI. The various zones of the adrenal glands are indicated above the image and the families of hormones secreted by each zone are indicated below. (B) Quantification of adrenal hormones in the plasma of animals. Levels of aldosterone in pg/mL, and of renin in ng/mL, in AV- and Josiah-infected animals, by time after infection. Levels of cortisol in ng/mL in mock-infected animals and in AV- and Josiah-infected animals at 12 DPI. * indicates p < 0.05, ** p < 0.01. (C) Significant changes in global gene expression (absolute log FC > 1 and adjusted p-value < 0.05) in the adrenal glands of mock-infected animals and in those of AV-infected and Josiah-infected animals at 5 and 11 DPI. Expressed as in Fig 8A. (D) Heatmaps representing standardized gene expression for the type I IFN, monocyte, T-cell, cytokine, and chemokine gene sets, as in Fig 9D.

References

    1. Buchmeier MJ, de la Torre J-C, Peters CJ. Arenaviridae. In: Knipe DM, Howley PM, Cohen JI, Griffin DE, Lamb RA, Martin MA, et al.., editors. Fields virology. 6th ed. Philadelphia: Lippincott Williams & Wilkins; 2013. p. 1283–303.
    1. Duvignaud A, Jaspard M, Etafo IC, Gabillard D, Serra B, Abejegah C, et al.. Lassa fever outcomes and prognostic factors in Nigeria (LASCOPE): a prospective cohort study. Lancet Glob health. 2021;9(4):e469–e78. doi: 10.1016/S2214-109X(20)30518-0 - DOI - PMC - PubMed
    1. Garry RF. Lassa fever—the road ahead. Nature rev Microbiol. 2023;21(2):87–96. Epub 2022/09/14. doi: 10.1038/s41579-022-00789-8 - DOI - PMC - PubMed
    1. Manning JT, Forrester N, Paessler S. Lassa virus isolates from Mali and the Ivory Coast represent an emerging fifth lineage. Front Microbiol. 2015;6:1037. doi: 10.3389/fmicb.2015.01037 - DOI - PMC - PubMed
    1. Safronetz D, Lopez J, Sogoba N, Traoré S, Raffel S, Fischer E, et al.. Detection of Lassa virus, Mali. Emerg Infect Dis. 2010;16(7):1123–6. doi: 10.3201/eid1607.100146 - DOI - PMC - PubMed

LinkOut - more resources