. 2025 Aug 1;82(2):470-486.
doi: 10.1097/HEP.0000000000001179. Epub 2024 Dec 9.

Enhanced hepatitis B virus-specific immunity by combining neutralizing antibody therapy and DNA vaccination in a murine model of chronic hepatitis B virus infection

Affiliations

Enhanced hepatitis B virus-specific immunity by combining neutralizing antibody therapy and DNA vaccination in a murine model of chronic hepatitis B virus infection

Maxime Beretta et al. Hepatology. .

Abstract

Background and aims: Successful treatment of chronic HBV infection remains a great challenge due to the difficulty in inducing efficient immune responses. Here, we investigated the therapeutic potential of DNA vaccination combined with a potent HBV broadly neutralizing antibody targeting the small surface viral antigen.

Approach and results: C57BL/6 mice were transduced with adeno-associated virus-HBV and were treated twice a week with HBV broadly neutralizing antibodies for 5 weeks. A DNA-based vaccine encoding the HBV core, envelope, and polymerase proteins was administered once to mice 3 weeks after initiating antibody therapy. The antiviral effects and antigen-specific immune responses were evaluated before and for 8 weeks after therapeutic vaccination. Vaccine administration with or without antibody treatment induced the development of functional HBV-specific CD8+ T cells and envelope-specific resident memory T cells in the liver. The combination of antibody treatment and DNA vaccination enhanced the recruitment of B and CD8+ T lymphocytes into the liver of HBV-carrier mice 2 weeks after vaccination. However, although still detectable 2 months after vaccination, HBV-specific CD8+ T cells showed an exhausted phenotype, suggesting that they are dysfunctional. In contrast, more effective control of antigenemia was observed following combination therapy, which was associated with the presence of HBs-specific memory B cells.

Conclusions: Although the combination therapy did not result in a functional cure, our findings indicate it produced additive effects on the development of HBV-specific T cells in the liver immediately following treatment, offering a better insight into the mechanisms underlying hepatic tolerance.

Keywords: T-cell response; antibody; chronic HBV infection; immune therapy; therapeutic vaccination.


Conflict of interest statement

Malika Ait-Goughoulte is employed by Hoffmann La Roche. Hugo Mouquet and Maryline Bourgine report grants from Institut Roche during the conduct of the study. Maxime Beretta, Malika Ait-Goughoulte, Nadège Pelletier, Hugo Mouquet and Maryline Bourgine reported a patent to anti-HBV antibodies and methods of use, WO/2021/249990. The remaining authors have no conflicts to report.

Figures

None
Graphical abstract
FIGURE 1
FIGURE 1
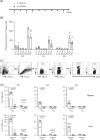
Immunogenicity of DNAvac in C57BL/6 mice. (A) Timeline of injection and tissue collection. Mice (n=5/group) were immunized intramuscularly with 150 μg of DNAvac—a mixture containing 3 plasmids encoding HBV core (C), polymerase (P), and envelope (S) antigens—(circles) or pCDNA3 (triangles). Spleens and livers were harvested at 2, 3, and 8 weeks (W) after immunization. (B) Splenocytes were stimulated with HBV peptides derived from either C, P, or S proteins, and HBV-specific T-cell responses were evaluated by IFN-γ ELISpot. The magnitude of the cell response was measured as the number of IFN-γ-secreting T cells per million lymphocytes. (C) Gating strategy for the identification of HBV-specific T cells using tetramers, corresponding to the H-2 Kb-restricted immunodominant epitope of the envelope (S353) and core (C93) proteins. (D) Frequencies of HBV envelope-specific and core-specific CD8+T cells identified by ex vivo staining in livers of immunized mice. Data were expressed as means±SEM. p-values were calculated by using an unpaired, nonparametric, two-tailed t test. Only significant differences <0.05 are shown. Abbreviations: FSC, forward scatter; IFN, interferon.
FIGURE 2
FIGURE 2
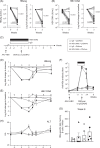
Control of serological HBV parameters by HBV bNAb inoculations and DNAvac injections. Naive C57BL/6 mice were transduced with 5×10¹⁰ vg of AAV-HBV. Six weeks after transduction, HBV-carrier mice were injected i.v. every 3–4 days with 1 mg (∼40 mg/kg) of HBV bNAb (closed symbols) or IgG (open symbols). (A, B) Antibodies were administered to HBV-carrier mice for 3 weeks. HBsAg (A) and HBV DNA (B) in sera expressed either in IU/mL or in Δlog10 values before injection and 3 days after the last antibody injection (n=10 animals for HBV bNAb, n=5 animals for IgG). Dotted lines indicate the limit of detection. p-values were determined by using a paired two-tailed t test for antibody effects and unpaired t test for group comparisons. (C) HBV-carrier mice were treated with the antibodies for 5 weeks. DNAvac (circles) or pCDNA3 (triangles) were injected intramuscularly 3 weeks after the start of antibody treatments. Blood samples were taken at different time points during the follow-up. (D, E) HBsAg (D) and HBV DNA (E) log decrease in the sera of AAV-HBV–treated mice (n=10 animals at week −3, 0, 2, 3 and n=5 animals at week 4 and 8 for the IgG + pcDNA3 group; n=15 mice at week −3, 0, 2, 3 and n=10 at week 4 and 8 for the other groups). p-values were determined by using a mixed-effects model with Tukey correction for multiple comparisons. (F) Anti-HBs titers in the sera of AAV-HBV-treated mice (n=5 animals per group). Lower limit of quantification is indicated with a dotted line. (G) Frequencies of HBs-specific IgG memory B cells were determined at week 8 by an in vitro cultured ELISpot assay and presented as memory B cells per spleen (n=5 animals per group). (H) Serum ALT profile over time (n=10 animals at week −3, 0, 2, 3 and n=5 animals at weeks 4 and 8). Data were expressed as means±SEM. Abbreviation: AAV, adeno-associated virus.
FIGURE 3
FIGURE 3
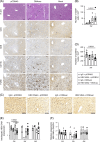
T-cell infiltration and reduced HBV expression in the liver 2 weeks after combination therapy. Groups of HBV-carrier mice were treated with HBV bNAb (closed symbols) or IgG (open symbols) for 5 weeks and injected with DNAvac (circles) or pCDNA3 (triangles) 3 weeks after the start of antibody treatments. (A) Representative images of serial liver sections from pCDNA3- (left column) or DNAvac-immunized (middle column) or untreated HBV-carrier mice (right column) stained with H&E (upper row) or anti-CD4, anti-CD8, anti-CD11b or anti-F4/80 antibodies. Arrows indicate cellular infiltrates. Scale bars, 100 μm. Representative pictures from the experiment with 4 mice per group (B) Quantification of CD8-positive T cells in the liver of pCDNA3-immunized or DNAvac-immunized mice (n=4 mice per group). (C) Representative immunohistochemical HBcAg staining of liver sections and (D) quantification of HBcAg-positive hepatocytes (n=4–8 mice per group). (E) Intrahepatic DNA levels and (F) pregenomic viral RNA transcripts from HBV-carrier mice were determined at indicated time points. Data were expressed as means±SEM. p-values were calculated with an unpaired two-tailed t test for B; one-way ANOVA followed by Tukey multiple comparison test for (D–F). Only significant differences<0.05 are shown. Abbreviations: bNAb, broadly neutralizing antibody; H&E, hematoxylin and eosin; ND, not done.
FIGURE 4
FIGURE 4
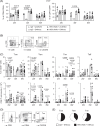
Combination therapy elicited cellular immunity in the liver. Groups of HBV-carrier mice were treated as shown in Figure 3. Lymphocytes were isolated from the spleen and liver of mice at the indicated time points after DNA immunization. (A) Absolute counts of splenocytes (left) and intrahepatic lymphocytes (right) at 2W, 3W, and 8W after DNA injection. (B) Gating strategy for phenotypic characterization of intrahepatic cell subsets. (C) Percentage and (D) absolute numbers of the different cell subsets in the liver at 2W and 3W after DNA injections. Mouse treatments are indicated below the panels. Results represent a combination of 3 independent experiments (n=4-13 mice per group). Error bars indicated SEM. p-values were determined by a two-way ANOVA test with Tukey post hoc test for A and Kruskal-Wallis test followed by Dunn test for multiple comparisons (C, D). Only significant differences<0.05 are shown. Abbreviations: bNAb, broadly neutralizing antibody; FSC, forward scatter; LD, live/dead; NK, natural killer; NKT, natural killer T; SSC, side scatter.
FIGURE 5
FIGURE 5
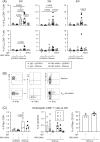
Induction of memory responses in the liver. Mice are those described in Figure 4. Intrahepatic lymphocytes were analyzed by flow cytometry at 2, 3, and 8 weeks after DNA immunization. (A) Expression of CD44 activation marker by the CD8+ and CD4+ cells collected at different time points. (B) Example of flow cytometry used to identify Tcm (CD44+/CD62L+), Tem (CD44+/CD62L−/CD69−/CXCR6−), T effector (Teff; CD44+/CD62L−/CD69+/CXCR6−), and Trm (CD44+/CD62L−/CD69+/CXCR6+) in liver-associated CD8 T cells. CD8+ T cells were identified as lymphocytes, singlets, viability+, and CD3+NK−. (C) Frequencies and absolute numbers of intrahepatic Tcm, Tem, Trm, and Teff CD8 T cells (n=8, 4, and 14 mice for IgG + pCDNA3 at W2, W3, and W8, respectively; n=4, 0, and 12 mice for HBV bNAb + pCDNA3 IgG at W2, W3, and W8, respectively; n=8, 4, and 14 mice for IgG + DNAvac at W2, W3, and W8, respectively; n=12, 8, and 14 mice for HBV bNAb + DNAvac at W2, W3, and W8, respectively). Data were expressed as means±SEM. p-values were determined by a Kruskal-Wallis test followed by Dunn test for multiple comparisons (A) and a two-way ANOVA test with Tukey post hoc test for (C). Only significant differences <0.05 are shown. (D) Identification of S353- specific CD8 T cells within the different subsets of memory T cells (black dots). (E) Proportion of S353-specific CD8 T cells from the 2 DNA-immunized groups within the different subsets of memory T cells (n=5 mice per group). Note that the proportion in the Teff population could not be calculated due to the low number of cells. Abbreviations: bNAb, broadly neutralizing antibody; ND, not done; Tcm, T central memory; Tem, T effector memory; Trm, T tissue-resident memory.
FIGURE 6
FIGURE 6
Induction of HBV-specific CD8 T-cell responses by combination therapy. (A) Quantification of intrahepatic S353- and C93-specific CD8 T cells by tetramer staining. HBV-carrier mice were treated with HBV bNAb (closed symbols) or IgG (open symbols) and immunized with DNAvac (circles) or pCDNA3 (triangles). Naive mice serve as a control for nonspecific tetramer staining (open diamonds) (n=4–12 mice per group). (B) Flow cytometry gating strategy. Intrahepatic T cells were stimulated with the S353 peptide overnight followed by intracellular staining. Lymphocytes were gated on live cells, singlets, and subsequently on CD8+ T cells before evaluating cytokine productions. (C) Frequency of IFNɣ+CD8+ T cells (left) 2 weeks after DNA immunization. The capacity of intrahepatic cells to secrete 1 (white bars), 2 (gray bars), or 3 (black bars) cytokines (middle panel) or to be cytotoxic (IFNɣ+CD107+) (left) (n=4 mice per group). Data were expressed as means±SEM. p-values were determined by the Kruskal-Wallis test with a Dunn test for multiple comparisons. Only significant differences <0.05 are shown. Abbreviations: bNAb, broadly neutralizing antibody; IFN, interferon.
FIGURE 7
FIGURE 7
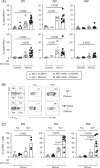
Combination therapy does not prevent T-cell exhaustion. Mice were treated as in Figure 3, and intrahepatic lymphocytes were harvested at 2W, 3W, and 8W. Mouse treatments are indicated below the panels. (A) Frequency of CD4+ and CD8+ T cells expressing PD1 (n=4–12 mice per group). (B) Representative plots of S353-specific (Tet +) or negative (Tet −) CD8+ T cells identified ex vivo by tetramer staining in the 2 groups immunized with DNAvac. (C) Frequency of PD1-expressing CD8+ T cells in the Tet + and Tet− populations (n=3–9 mice per group). Data were expressed as means±SEM. p-values were determined by Kruskal-Wallis test with a Dunn test for multiple comparisons. Only significant differences <0.05 are shown. Abbreviations: bNAb, broadly neutralizing antibody; ND, not done; PD1, programmed cell death protein 1.

Similar articles

References

    1. Polaris Observatory C . Global prevalence, treatment, and prevention of hepatitis B virus infection in 2016: A modelling study. Lancet Gastroenterol Hepatol. 2018;3:383–403. - PubMed
    1. Naggie S, Lok AS. New therapeutics for hepatitis B: The road to cure. Annu Rev Med. 2021;72:93–105. - PubMed
    1. Godon O, Fontaine H, Kahi S, Meritet J, Scott-Algara D, Pol S, et al. Immunological and antiviral responses after therapeutic DNA immunization in chronic hepatitis B patients efficiently treated by analogues. Molecular Therapy. 2014;22:675–684. - PMC - PubMed
    1. Hadziyannis SJ, Sevastianos V, Rapti I, Vassilopoulos D, Hadziyannis E. Sustained responses and loss of HBsAg in HBeAg-negative patients with chronic hepatitis B who stop long-term treatment with adefovir. Gastroenterology. 2012;143:629–636 e621. - PubMed
    1. Burton AR, Pallett LJ, McCoy LE, Suveizdyte K, Amin OE, Swadling L, et al. Circulating and intrahepatic antiviral B cells are defective in hepatitis B. J Clin Invest. 2018;128:4588–4603. - PMC - PubMed

MeSH terms