. 2025 Feb;638(8052):920-926.
doi: 10.1038/s41586-024-08449-y. Epub 2024 Dec 9.

Quantum error correction below the surface code threshold

Collaborators

Quantum error correction below the surface code threshold

Google Quantum AI and Collaborators. Nature. 2025 Feb.

Abstract

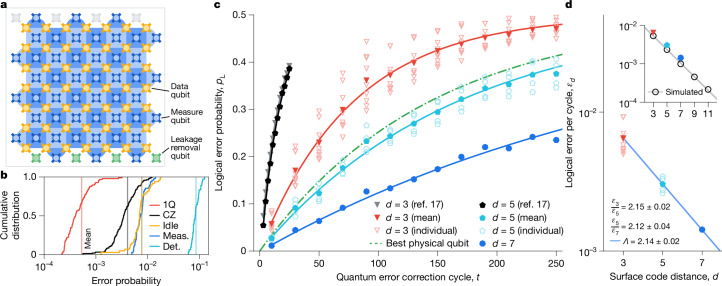
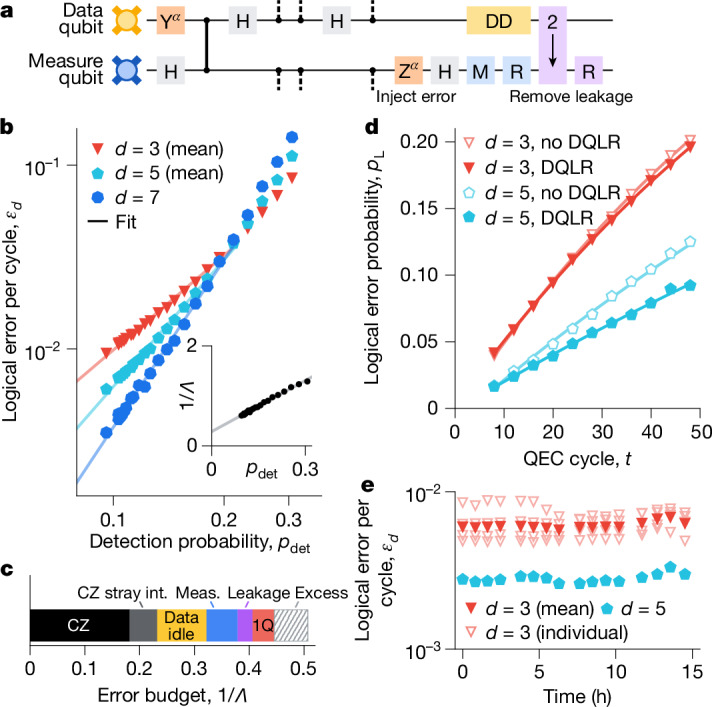
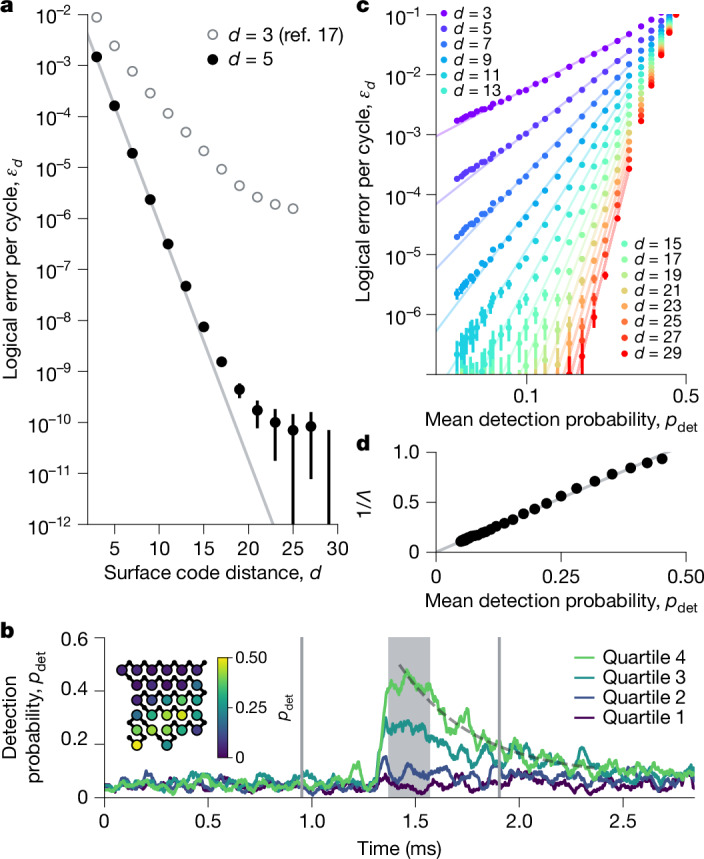
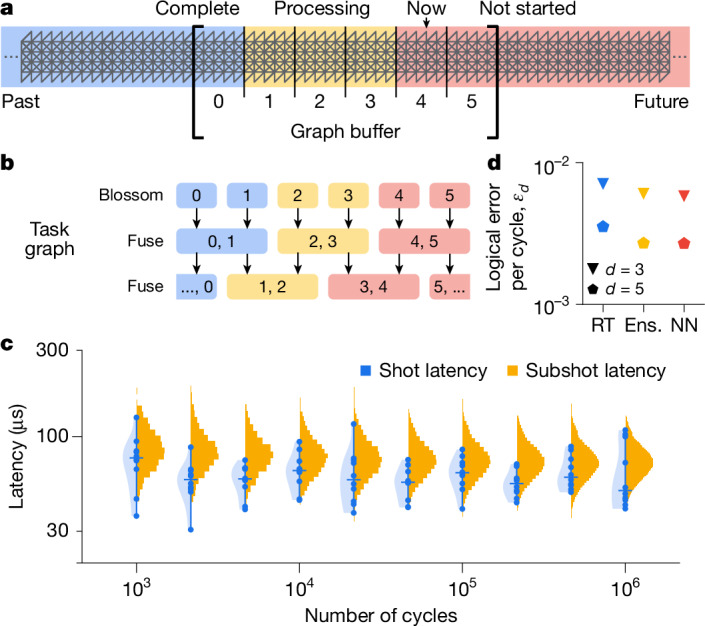
Quantum error correction1-4 provides a path to reach practical quantum computing by combining multiple physical qubits into a logical qubit, in which the logical error rate is suppressed exponentially as more qubits are added. However, this exponential suppression only occurs if the physical error rate is below a critical threshold. Here we present two below-threshold surface code memories on our newest generation of superconducting processors, Willow: a distance-7 code and a distance-5 code integrated with a real-time decoder. The logical error rate of our larger quantum memory is suppressed by a factor of Λ = 2.14 ± 0.02 when increasing the code distance by 2, culminating in a 101-qubit distance-7 code with 0.143% ± 0.003 per cent error per cycle of error correction. This logical memory is also beyond breakeven, exceeding the lifetime of its best physical qubit by a factor of 2.4 ± 0.3. Our system maintains below-threshold performance when decoding in real time, achieving an average decoder latency of 63 microseconds at distance 5 up to a million cycles, with a cycle time of 1.1 microseconds. We also run repetition codes up to distance 29 and find that logical performance is limited by rare correlated error events, occurring approximately once every hour or 3 × 10⁹ cycles. Our results indicate device performance that, if scaled, could realize the operational requirements of large-scale fault-tolerant quantum algorithms.


Conflict of interest statement

Competing interests: The authors declare no competing interests.

Figures

Fig. 1
Fig. 1. Surface code performance.
a, Schematic of a distance-7 (d = 7) surface code on a 105-qubit processor. Each measure qubit (blue) is associated with a stabilizer (blue-coloured tile). Data qubits (gold) form a d × d array. We remove leakage from each data qubit using a neighbouring qubit below it, with additional leakage removal qubits at the boundary (green). b, Cumulative distributions of error probabilities measured on the 105-qubit processor. Red, Pauli errors for single-qubit gates; black, Pauli errors for CZ gates; gold, Pauli errors for data qubit idle during measurement and reset; blue, identification error for measurement; teal, weight-4 detection probabilities (distance 7, averaged for 250 cycles). c, Logical error probability pL for a range of memory experiment durations. Each data point represents 105 repetitions decoded with the neural network and is averaged over the logical basis (XL and ZL). Black and grey, data from ref. for comparison. Curves, exponential fits after averaging pL over code and basis. To compute εd values, we fit each individual code and basis separately and report their average (Supplementary Information). d, Logical error per cycle, εd, reducing with surface code distance d. Uncertainty on each point is less than 7 × 10−5. The symbols match those in c. Means for d = 3 and d = 5 are computed from the separate εd fits for each code and basis. Line, fit to equation (1), determining Λ. The inset shows simulations up to d = 11 alongside experimental points, both decoded with ensembled matching synthesis for comparison. Line, fit to simulation; Λsim = 2.25 ± 0.02.
Fig. 2
Fig. 2. Error sensitivity in the surface code.
a, One cycle of the surface code circuit, focusing on one data qubit and one measure qubit. Black bar, CZ; H, Hadamard; M, measure; R, reset; DD, dynamical decoupling; orange, injected coherent errors; purple, DQLR. b, Error injection in the surface code on a 105-qubit processor. Distance 3 averages over 9 subset codes, and distance 5 averages over 4 subset codes, as shown in Fig. 1. Logical performance is plotted against the mean weight-4 detection probability averaging over all codes, for which increasing the error injection angle α increases the detection probability. Each experiment is ten cycles with 2 × 104 total repetitions. Lines, power-law fits for data points at or below at which the codes cross. The inset shows the inverse error suppression factor, 1/Λ, versus the detection probability. Line, fit to points at which 1/Λ < 1, 3.4pdet + 0.29. c, Estimated error budget for the surface code based on component errors and simulations. CZ, CZ error, excluding leakage and stray interactions; CZ stray int., CZ error from unwanted interactions; data idle, data qubit idle error during measurement and reset; meas., measurement and reset error; leakage, leakage during CZs and due to heating; 1Q, single-qubit gate error; excess, unmodelled error, which is the difference between experimental and simulated 1/Λ (correlated matching). d, Comparison of logical performance with and without DQLR in each cycle. Distance-3 points (red triangles) are averaged over 4 quadrants. Each experiment is 105 repetitions. Curves, exponential fits. QEC, quantum error correction. e, Repeating experiments to assess performance stability, comparing distance 3 and distance 5. Each point represents a sweep of logical performance versus experiment duration, up to 250 cycles. To obtain the data in d and e, a 72-qubit processor is used.
Fig. 3
Fig. 3. High-distance error scaling in repetition codes.
a, εd versus d when decoding with minimum-weight perfect matching. The repetition code points are from d = 29, 103-cycle experiments, 107 repetitions for each basis X and Z. We subsample smaller codes from the same d = 29 dataset, averaging over subsamples. Line, fit of Λ. We include data from ref. for comparison. b, Example event causing elevated detection probabilities, which decay exponentially with time constant 369 ± 6 μs (grey dashed line). Three consecutive experimental shots are plotted, delimited by the vertical grey lines. The 28 measure qubits are divided into four quartiles based on the average detection probability in the grey-shaded window. Each trace represents the detection probability averaged over one quartile and a time window of ten cycles. Roughly half the measure qubits experience an appreciable rise in detection probability. The inset shows the average detection probability for each measure qubit (coloured circle) in the grey-shaded window. c, Logical error scaling with the injected error. We inject a range of coherent errors on all the qubits and plot against the observed mean detection probability pdet. Each experiment is ten cycles, and we average over 106 repetitions. Smaller code distances are again subsampled from d = 29. Lines, power-law fits εd=Adpdet(d+1)/2 (one fit parameter, Ad), restricted to εd > 10−7 and pdet < 0.3. d, 1/Λ scaling with the injected error. Typical relative fit uncertainty is 2%. Line, fit; 2.2pdet. To obtain the data in this figure, a 72-qubit processor is used.
Fig. 4
Fig. 4. Real-time decoding.
a, Schematic of the streaming decoding algorithm. The decoding problems are subdivided into blocks, with different threads responsible for different blocks. b, Task graph for processing blocks. Detections are enabled to match to the block boundaries, which will then be processed downstream during a fuse step. If a configuration of detection events cannot be resolved by a future fuse step, the decoder heralds failure. We use ten-cycle blocks to ensure that the heralded failure rate is negligible compared with the logical failure rate. c, Decoder latency versus experiment duration. Each blue point corresponds to a latency measurement for a full shot (ten shots per duration; horizontal bar, median; blue shading, violin plot). The yellow histograms represent fine-grained latency measurements of the time between receiving data and completing decoding for each ten-cycle block in a shot. The values from these fine-grained measurements, which we refer to as subshot latencies, tend to be slightly larger than those from full-shot latency measurements as the decoder may need to wait to fuse with detection events in future cycles. Infrequently, we see brief subshot latency spikes above 1 ms (Supplementary Information). d, Accuracy comparison for the surface code with three decoders. We include the real-time decoder (RT), ensembled matching synthesis (Ens.) and the neural network decoder (NN). Uncertainty on each point is less than 4 × 10−4 (Supplementary Information). To obtain the data in this figure, a 72-qubit processor is used.

References

    1. Shor, P. W. Scheme for reducing decoherence in quantum computer memory. Phys. Rev. A52, R2493 (1995). - PubMed
    1. Gottesman, D. Stabilizer Codes and Quantum Error Correction (California Institute of Technology, 1997).
    1. Dennis, E., Kitaev, A. Y., Landahl, A. & Preskill, J. Topological quantum memory. J. Math. Phys.43, 4452–4505 (2002).
    1. Kitaev, A. Y. Fault-tolerant quantum computation by anyons. Ann. Phys.303, 2–30 (2003).
    1. Aspuru-Guzik, A., Dutoi, A. D., Love, P. J. & Head-Gordon, M. Simulated quantum computation of molecular energies. Science309, 1704–1707 (2005). - PubMed

LinkOut - more resources